R E S E A R C H A R T I C L E
Open Access
Testing the construct validity of hospital
care quality indicators: a case study on hip
replacement
Claudia Fischer
1,2*, Hester F. Lingsma
1, Helen A. Anema
2, Job Kievit
3, Ewout W. Steyerberg
1and Niek Klazinga
2Abstract
Background:Quality indicators are increasingly used to measure the quality of care and compare quality across hospitals. In the Netherlands over the past few years numerous hospital quality indicators have been developed and reported. Dutch indicators are mainly based on expert consensus and face validity and little is known about their construct validity. Therefore, we aim to study the construct validity of a set of national hospital quality indicators for hip replacements.
Methods:We used the scores of 100 Dutch hospitals on national hospital quality indicators looking at care delivered over a two year period. We assessed construct validity by relating structure, process and outcome indicators using chi-square statistics, bootstrapped Spearman correlations, and independent sample t-tests. We studied indicators that are expected to associate as they measure the same clinical construct.
Result:Among the 28 hypothesized correlations, three associations were significant in the direction
hypothesized. Hospitals with low scores on wound infections had high scores on scheduling postoperative
appointments (p-value = 0.001) and high scores on not transfusing homologous blood (correlation coefficient = -0.28;
p-value = 0.05). Hospitals with high scores on scheduling complication meetings, also had high scores on providing
thrombosis prophylaxis (correlation coefficient = 0.21;p-value = 0.04).
Conclusion:Despite the face validity of hospital quality indicators for hip replacement, construct validity seems to be limited. Although the individual indicators might be valid and actionable, drawing overall conclusions based on the whole indicator set should be done carefully, as construct validity could not be established. The factors that may explain the lack of construct validity are poor data quality, no adjustment for case-mix and statistical uncertainty.
Keywords:Hip replacement, Database, Health care quality, Quality indicators, Validity
Background
As quality improvement becomes a central tenet of health care, quality indicators (QIs) are becoming in-creasingly important. Quality is monitored and publicly reported in order to provide patients and health insurers with information regarding choices and to improve the quality of the underlying complex and resource-intensive care procedures [1].
For such purposes QIs need to be based on reliable data [2, 3], and they must cover quality aspects on a structural, process, and outcome level [4]. The under-lying assumption is that good structures of care increase the likelihood of good processes and good processes in-crease the likelihood of good outcomes (the Donabedian framework) [4]. Another important prerequisite for the external use of the indicators and fair comparison of hospitals is that QIs are valid [5] and actionable. QIs need to provide insight into which factors determine the occurrence of an outcome, so that hospitals are able to act on the process to improve the outcome.
Total hip replacements are interesting for quality of care research because hip replacements are common, * Correspondence:[email protected]
1
Department of Public Health, Centre for Medical Decision Making, Erasmus MC, Dr. Molewaterplein 50, NA-2217, 3000 CA Rotterdam, The Netherlands 2Department of Public Health, Amsterdam Medical Centre, Meibergdreef 9, 1105 AZ Amsterdam, The Netherlands
Full list of author information is available at the end of the article
elective procedures that are being performed more and more frequently [6]. Although the clinical and economic effectiveness of hip replacements is proven [7], it is still possible to observe variation in performance between providers [8, 9]. As a result, these orthopaedic proce-dures have for instance been included in pay-for-performance schemes by social insurance programs such as Medicare and Medicaid [10]. In such a pro-gram hospitals are rewarded for meeting pre-defined performance targets related to the health care that is delivered [11]. In the pay-for-performance scheme of Medicare and Medicaid, the so-called ‘Premier Quality Initiative Demonstration’, a composite score was cre-ated from three measures of surgical process quality and three measures of surgical outcome. A perform-ance bonus consisting of two percent of diagnosis-related group payments for total hip and knee arthroplasty was given to hospitals that scored in the top 10% on the composite measure [10]. For such external use (as well as for internal use such as in local hospital qual-ity improvement), it is critical that indicators present a valid picture of the quality of the health care that is provided by a hospital [5]. However, empirical evalua-tions of the relation between outcome indicators and process and structure indicators that measure the same construct are scarce in Europe [12]. Even if quality indicators are tested in different health care systems, an evaluation in the health care system in which the indicator is used is essential. Differences in national health care and local hospital organization may influence the indicator’s validity [1]. Insight into the validity of QIs is particularly important when data reliability is at stake, for instance when there are no national standards that hospitals or database software providers should follow when setting up their in-hospital quality registries in which the quality data is entered [1, 2]. This is the case in the Netherlands, where QIs were developed by the Dutch Health Care Transparency Program (DHTP) through a combin-ation of expert consensus and available scientific literature. They were tested in only a few hospitals. Employees of the hospitals are required to calculate and report these QIs annually to the DHTP; public reporting and publication of these QIs has occurred for several subsequent years [13].
Therefore we aimed to evaluate several publicly available indicators of quality of hospital care in the Netherlands related to hip replacements (15 indica-tors) with regard to their construct validity, or the
“degree to which an indicator measures what it claims to be measuring” [14]. In this study construct validity is operationalized by a significant associationbetween two quality indicators that measure the same under-lying construct in the expected direction.
Methods
We conducted a cross-sectional data analysis, using quantitative data from two registration years (2008 and 2009) as reported by the hospitals.
QIs under investigation
The QIs we evaluated are all related to pre-operative and post-operative health care for hip replacements. We used data from two consecutive years. Table 1 shows an overview of the definitions, numerators (i.e. number of patients who underwent a certain care process) and denominators (i.e. total number of patients) of the struc-ture, process and outcome (S-P-O) QIs evaluated in this study. Moreover, it can be seen that the structure QIs in the hip replacement set are dichotomous (yes/no), whereas the majority of the process and outcome indica-tors are continuous measures (a proportion of patients with particular treatment or outcome).
Data source
Dutch health care transparency program data (DHTP)
The QI data originate from a national database hosted by the DHTP [15]. Dutch hospital staff annually collect and submit to DHTP hospital-specific performance scores (numerators and denominators) for various diseases and interventions based on health care delivered in the preceding calendar year.
Although we had data on indicator scores for three subsequent years (2008, 2009, 2010) we only could include indicator scores from two years (2008, 2009) in our study. This is due to major changes in the indica-tors, which would have influenced the comparability of the indicator scores between the years. For our study we selected the available numerators and denominators for each hospital and indicator. All QI scores were aggre-gated on the hospital level (Table 1).
Analysis
To describe the range in scores across hospitals we calculated the mean and interquartile range (IQR) of all indicator scores and denominators on the hospital level.
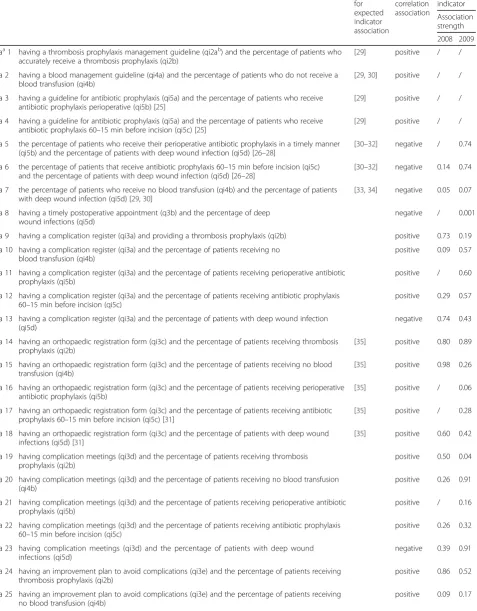
Based on the indicator manual, the literature and medical expert opinion, we hypothesized 28 associations between hip replacement indicators that measure the same underlying construct. Table 2 shows an overview of the hypothesized indicator associations and their direction of association.
(fictitious hospitals) that were constructed from the original dataset. The relationships between the dichot-omous structure indicators were analysed by means of chi-square tests. Finally, to examine the relationship be-tween dichotomous structure and continuous process/ outcome indicators independent sample t-tests were ap-plied. Here we also bootstrapped 1000 random replicas. Analyses were conducted in the statistical programs SPSS version 21. Significance was set atα< 0.05.P-values below 0.1 were regarded as marginally significant.
Results
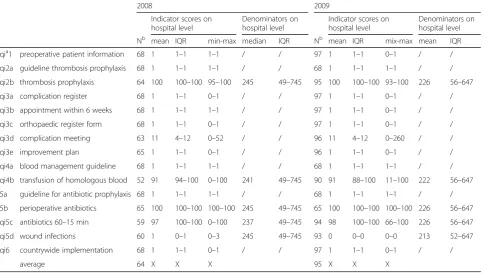
On average 64 hospitals provided data to calculate indi-cator scores in year 2008, from a total of 100 available hospitals in the Netherlands. The participation increased in subsequent year, in which on average 95 % of the hospitals provided data. Many indicator scores improved from 2008 to 2009. For example, the percentage of wound infections ranged from 0 to 3 % across hospitals
in 2008, while in 2009 the range was from 0 to 0.03 % (Table 3).
Based on their face validity and on the literature, we hypothesized 28 associations (hypothesized associations, ha) to be significant. We found three of these correla-tions to be significant in the direction hypothesized, of which one was found in the data from 2008 and two were found in the data from 2009 (ha 7, ha 8, ha 19).
[image:3.595.55.538.103.477.2]As expected, hospitals that reported planning appoint-ments within six weeks after surgery 0.01 % reported deep wound infections, compared to 0.02 % of those who did not report to plan postoperative appointments within six weeks (p-value = 0.001). Further, our analysis showed that hospitals with a higher percentage of patients who did not receive a homologue blood transfu-sion had a lower percentage of wound infections, although this correlation was only marginally significant (ha 7: r= -0.28, p-value = 0.05). Hospitals that had high scores on the number of complication meetings also had
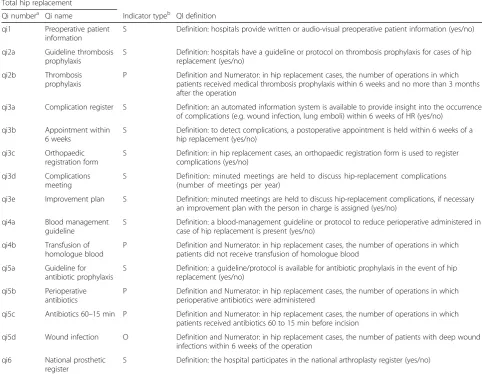
Table 1Included DHTP total hip replacement quality indicators
Total hip replacement
Qi numbera Qi name Indicator typeb QI definition
qi1 Preoperative patient information
S Definition: hospitals provide written or audio-visual preoperative patient information (yes/no)
qi2a Guideline thrombosis prophylaxis
S Definition: hospitals have a guideline or protocol on thrombosis prophylaxis for cases of hip replacement (yes/no)
qi2b Thrombosis prophylaxis
P Definition and Numerator: in hip replacement cases, the number of operations in which patients received medical thrombosis prophylaxis within 6 weeks and no more than 3 months after the operation
qi3a Complication register S Definition: an automated information system is available to provide insight into the occurrence of complications (e.g. wound infection, lung emboli) within 6 weeks of HR (yes/no)
qi3b Appointment within 6 weeks
S Definition: to detect complications, a postoperative appointment is held within 6 weeks of a hip replacement (yes/no)
qi3c Orthopaedic registration form
S Definition: in hip replacement cases, an orthopaedic registration form is used to register complications (yes/no)
qi3d Complications meeting
S Definition: minuted meetings are held to discuss hip-replacement complications (number of meetings per year)
qi3e Improvement plan S Definition: minuted meetings are held to discuss hip-replacement complications, if necessary an improvement plan with the person in charge is assigned (yes/no)
qi4a Blood management guideline
S Definition: a blood-management guideline or protocol to reduce perioperative administered in case of hip replacement is present (yes/no)
qi4b Transfusion of homologue blood
P Definition and Numerator: in hip replacement cases, the number of operations in which patients did not receive transfusion of homologue blood
qi5a Guideline for antibiotic prophylaxis
S Definition: a guideline/protocol is available for antibiotic prophylaxis in the event of hip replacement (yes/no)
qi5b Perioperative antibiotics
P Definition and Numerator: in hip replacement cases, the number of operations in which perioperative antibiotics were administered
qi5c Antibiotics 60–15 min P Definition and Numerator: in hip replacement cases, the number of operations in which patients received antibiotics 60 to 15 min before incision
qi5d Wound infection O Definition and Numerator: in hip replacement cases, the number of patients with deep wound infections within 6 weeks of the operation
qi6 National prosthetic register
S Definition: the hospital participates in the national arthroplasty register (yes/no)
a
According to number in DHTP hip and knee replacement indicator set
bS
Table 2Hypothesized indicator association and direction of association
Hypothesized indicator associations Evidence
for expected indicator association
Expected correlation association
p-value indicator
Association strength
2008 2009
haa1 having a thrombosis prophylaxis management guideline (qi2ab) and the percentage of patients who accurately receive a thrombosis prophylaxis (qi2b)
[29] positive / /
ha 2 having a blood management guideline (qi4a) and the percentage of patients who do not receive a blood transfusion (qi4b)
[29,30] positive / /
ha 3 having a guideline for antibiotic prophylaxis (qi5a) and the percentage of patients who receive antibiotic prophylaxis perioperative (qi5b) [25]
[29] positive / /
ha 4 having a guideline for antibiotic prophylaxis (qi5a) and the percentage of patients who receive antibiotic prophylaxis 60–15 min before incision (qi5c) [25]
[29] positive / /
ha 5 the percentage of patients who receive their perioperative antibiotic prophylaxis in a timely manner (qi5b) and the percentage of patients with deep wound infection (qi5d) [26–28]
[30–32] negative / 0.74
ha 6 the percentage of patients that receive antibiotic prophylaxis 60–15 min before incision (qi5c) and the percentage of patients with deep wound infection (qi5d) [26–28]
[30–32] negative 0.14 0.74
ha 7 the percentage of patients who receive no blood transfusion (qi4b) and the percentage of patients with deep wound infection (qi5d) [29,30]
[33,34] negative 0.05 0.07
ha 8 having a timely postoperative appointment (q3b) and the percentage of deep wound infections (qi5d)
negative / 0.001
ha 9 having a complication register (qi3a) and providing a thrombosis prophylaxis (qi2b) positive 0.73 0.19
ha 10 having a complication register (qi3a) and the percentage of patients receiving no blood transfusion (qi4b)
positive 0.09 0.57
ha 11 having a complication register (qi3a) and the percentage of patients receiving perioperative antibiotic prophylaxis (qi5b)
positive / 0.60
ha 12 having a complication register (qi3a) and the percentage of patients receiving antibiotic prophylaxis 60–15 min before incision (qi5c)
positive 0.29 0.57
ha 13 having a complication register (qi3a) and the percentage of patients with deep wound infection (qi5d)
negative 0.74 0.43
ha 14 having an orthopaedic registration form (qi3c) and the percentage of patients receiving thrombosis prophylaxis (qi2b)
[35] positive 0.80 0.89
ha 15 having an orthopaedic registration form (qi3c) and the percentage of patients receiving no blood transfusion (qi4b)
[35] positive 0.98 0.26
ha 16 having an orthopaedic registration form (qi3c) and the percentage of patients receiving perioperative antibiotic prophylaxis (qi5b)
[35] positive / 0.06
ha 17 having an orthopaedic registration form (qi3c) and the percentage of patients receiving antibiotic prophylaxis 60–15 min before incision (qi5c) [31]
[35] positive / 0.28
ha 18 having an orthopaedic registration form (qi3c) and the percentage of patients with deep wound infections (qi5d) [31]
[35] positive 0.60 0.42
ha 19 having complication meetings (qi3d) and the percentage of patients receiving thrombosis prophylaxis (qi2b)
positive 0.50 0.04
ha 20 having complication meetings (qi3d) and the percentage of patients receiving no blood transfusion (qi4b)
positive 0.26 0.91
ha 21 having complication meetings (qi3d) and the percentage of patients receiving perioperative antibiotic prophylaxis (qi5b)
positive / 0.16
ha 22 having complication meetings (qi3d) and the percentage of patients receiving antibiotic prophylaxis 60–15 min before incision (qi5c)
positive 0.26 0.32
ha 23 having complication meetings (qi3d) and the percentage of patients with deep wound infections (qi5d)
negative 0.39 0.91
ha 24 having an improvement plan to avoid complications (qi3e) and the percentage of patients receiving thrombosis prophylaxis (qi2b)
positive 0.86 0.52
ha 25 having an improvement plan to avoid complications (qi3e) and the percentage of patients receiving no blood transfusion (qi4b)
high scores on providing thrombosis prophylaxis (ha 19:
r= 0.21,p-value = 0.04).
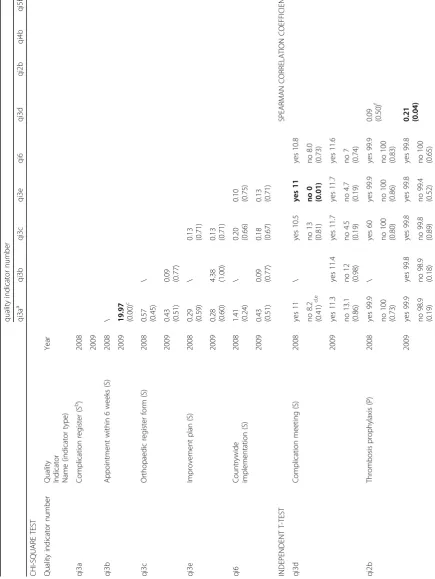
We found several indicator associations, which were not a priori expected.
We found two significant structure-structure associa-tions. We observed that hospitals that maintained a complication registration were also more likely to score high on planning a postoperative appointment within six weeks post-surgery (χ2: 19.97, p-value < 0.01). Further, hospitals that reported holding complication meetings, 11 % reported to use an improvement plan compared to 0 % of those who did not report to hold complication meetings (p-value = 0.01). We also observed several process-process associations. Primarily, the administra-tion of thrombosis prophylaxis correlated significantly with the administration of antibiotic prophylaxis, sug-gesting that hospitals that accurately administer throm-bosis prophylaxis were more likely to accurately administer antibiotic prophylaxis to their patients (r=
0.27, p-value < 0.05) and, secondly, managed to do it in time (r= 0.28,p-value < 0.05).
We additionally observed a significant correlation between the administration of antibiotic prophylaxis and the administration of antibiotic prophylaxis in a timely manner (SpearmanR= 0.46,p-value < 0.01).
Having an improvement plan was related to the per-centage of patients who received their antibiotic prophy-laxis in a timely manner; however, they were related differently than might be expected. Of hospitals having an improvement plan, 98 % reported to provide anti-biotic prophylaxis, compared to 100 % of those who do not have an improvement plan (p-value = 0.03) (Table 4).
Discussion
[image:5.595.55.539.100.172.2]By associating structure, process, and outcome indicators we measured the construct validity of national quality indicators for hip replacement. Of the 28 a priori expected associations (per year) only three were observed to be
Table 2Hypothesized indicator association and direction of association(Continued)
ha 26 having an improvement plan to avoid complications (qi3e) and the percentage of patients receiving perioperative antibiotic prophylaxis (qi5b)
positive / 0.39
ha 27 having an improvement plan to avoid complications (qi3e) and the percentage of patients receiving antibiotic prophylaxis 60–15 min before incision (qi5c)
positive 0.51 0.05
ha 28 having an improvement plan to avoid complications (qi3e) and the percentage of patients with deep wound infections (qi5d)
negative 0.26 0.72
a
hypothesized association (ha),b
quality indicator (qi)
Table 3Hospital-level variation in total hip replacement scores in year 2008 and 2009
2008 2009
Indicator scores on hospital level
Denominators on hospital level
Indicator scores on hospital level
Denominators on hospital level
Nb mean IQR min-max median IQR Nb mean IQR mix-max mean IQR
qia1 preoperative patient information 68 1 1–1 1–1 / / 97 1 1–1 0–1 / /
qi2a guideline thrombosis prophylaxis 68 1 1–1 1–1 / / 68 1 1–1 1–1 / /
qi2b thrombosis prophylaxis 64 100 100–100 95–100 245 49–745 95 100 100–100 93–100 226 56–647
qi3a complication register 68 1 1–1 0–1 / / 97 1 1–1 0–1 / /
qi3b appointment within 6 weeks 68 1 1–1 1–1 / / 97 1 1–1 0–1 / /
qi3c orthopaedic register form 68 1 1–1 0–1 / / 97 1 1–1 0–1 / /
qi3d complication meeting 63 11 4–12 0–52 / / 96 11 4–12 0–260 / /
qi3e improvement plan 65 1 1–1 0–1 / / 96 1 1–1 0–1 / /
qi4a blood management guideline 68 1 1–1 1–1 / / 68 1 1–1 1–1 / /
qi4b transfusion of homologous blood 52 91 94–100 0–100 241 49–745 90 91 88–100 11–100 222 56–647
5a guideline for antibiotic prophylaxis 68 1 1–1 1–1 / / 68 1 1–1 1–1 / /
5b perioperative antibiotics 65 100 100–100 100–100 245 49–745 65 100 100–100 100–100 226 56–647
qi5c antibiotics 60–15 min 59 97 100–100 0–100 237 49–745 94 98 100–100 66–100 226 56–647
qi5d wound infections 60 1 0–1 0–3 245 49–745 93 0 0–0 0–0 213 52–647
qi6 countrywide implementation 68 1 1–1 0–1 / / 97 1 1–1 0–1 / /
average 64 X X X 95 X X X
a
Quality indicator (qi) b
[image:5.595.57.545.443.716.2]Table 4 Associations among total hip replacement indicators within the years 2008 and 2009 quality indi cator numbe r qi3a a qi3b qi3c qi3e qi6 qi3d qi2b qi4b qi5b qi5c qi5d CHI-SQUARE TES T Qual ity indicator num ber
Quality Indicator Name
[image:6.595.69.505.154.734.2]significant in the direction hypothesized. Additionally seven associations that were not a priori expected were also found to be significant. None of the associations were consistent over the two-year time period, despite the scientific foundation of the quality indicators and overall expert consensus regarding their validity. Therefore, the construct validity of the quality indicator set under evalu-ation seems limited. We only found three of the a priori expected associations to be significant. For example, we observed that in hospitals that scheduled an appointment with a patient within six weeks after the patient’s hip replacement, the number of relevant wound infections after hip replacement was lower compared to hospitals that did not plan such an appointment. This is consistent with the international literature and with the widely held opinion that an appointment within this period helps to detect postoperative complications at an early stage, and thereby prevent advanced severe wound infections [16]. We additionally observed several process-process associa-tions, which in retrospect, might indicate an overall qual-ity awareness culture on the hospital level. For example, hospitals that had high scores on the administration of perioperative antibiotics also had high scores on the administration of antibiotics prior to the incision.
Our study showed limited construct validity between the tested quality indicators. This finding is in line with existing literature. Several studies tend to show relatively weak associations between different types of quality indicators in the health care field [17–20]. Associations between quality indicators are complex and different methodological factors influence the association between them.
An important factor for construct validity is data reli-ability. Although the data registration showed signs of improvement in 2009 compared to 2008, data reliability remained an issue in the data of the DHTP. In previous studies it was found that differences in data collection and reporting methods used by hospital employees, such as the use of different indicator definitions, most likely influenced the comparability of the DHTP data [2]. Moreover, many of the indicators are not very specific. For instance, 9 of the 15 hip replacement indicators are dichotomous indicators (yes/no). But for example the in-dicator“availability of a guideline”(e.g. qi4a, qi5b), gives no information about actual adherence to the guideline.
The lack of association we found among the indicators may be explained by the limited variation and the small numbers observed among many of the included quality indicators. For example, in 2008 the average event rate for patients developing wound infections was merely 1 %. When there are few observations and event rates are that low, indicator scores will randomly fluctuate over time, even if the underlying quality of care remains constant [21].
Furthermore, an important factor influencing con-struct validity is the extent of case-mix correction, as case-mix factors make up a large part of observed outcome variation [22]. Lack of adjustment for patient characteristics, which are not related to quality of hos-pital care but influence the patients’risk for an outcome, may lead to a biased reflection of quality of care and an unfair comparison between hospitals. As aggregated hospital-level data currently does not include informa-tion on the underlying patient characteristics, a valid and fair analysis between the hospitals cannot be guaranteed.
As quality improvement has become a central tenet of health care, QIs are becoming increasingly important. Many countries have already started their own QI pro-gram and many more are preparing to start QI propro-grams soon. Despite the increasing number of countries imple-menting QI programs, the number of studies testing the validity of indicators is limited. While a number of stud-ies have tested the construct validity of indicators in the U.S. [23–28], a limited number of such studies have been conducted in the European health care setting [12]. However, given the differences in national health care and local hospital organizations indicators should be evaluated before they are adopted from another health system. The validity of quality of care indicators cannot be assumed for a health care setting outside of the one where the indicator was developed and tested [1]. There-fore further research on the validity of the currently used indicators in the health care setting in which they are used is warranted. Several methodological lessons can be learned from our observations. In order for a QI to be valid, it must be reliable [2]. An indicator’s reliability is determined by the accuracy of the underlying data and the unambiguousness definition of the indicator [2]. Moreover, when hospital employees are responsible for collecting the data and computing the QIs, there needs to be some central control over these processes. Further-more, to increase data reliability the software market should be regulated and standards should be set for the development of automatic data extraction software. In order to find relationships between indicators it is crucial to take into account the influence of low event rates and case-mix differences. Failing to adjust for these factors may confound the relationship between quality indicators.
subject of study. Merely the presence of a significant association that was expected based on the literature was considered to be a sign of construct validity of both indicators. One could argue therefore that the method of validity assessment in our study is not very strong. A better way to assess the construct validity is to relate the indicator scores of interest with measures derived from other clinical databases. However, for countries in which reliable health care databases are scarce ours is the only approach possible. Second, the judgement on the construct validity of an indicator is always arbitrary. In our study we used a significant association in the expected direction as an indication of construct validity; however, most of the significant associations were weak. Third, when assessing multiple associations one typically corrects for multiple testing, for instance with a Bonferoni correction. As we a priori planned our associations based on the available scientific evidence, we did not correct for multiple testing. However, we do realize that we have to treat the observed significant associations with caution. Further research and trend data is needed to test construct validity over a longer time period in order to be able to identify systematic indicator associations.
Conclusion
Overall it can be concluded that despite the face validity of hospital quality indicators for hip replacement, con-struct validity seems to be limited. Although the individual indicators might be valid and actionable, drawing overall conclusions based on the whole indicator set should be done with caution, as construct validity could not be established. Limitations of the quality indicators that likely explain the lack of construct validity are poor data quality, lack of adjustment for case-mix and statistical uncertainty. Before any action can be taken based on the indicator scores these limitations must be addressed.
Acknowledgements
We thank Richard Stephens for editing this paper.
Funding
The Dutch Federation of University Medical Centres (NFU) has received a grant from the Dutch Ministry of Health, Welfare and Sport to carry out this research.
Availability of data and materials
The data that support the findings of this study are available from DHTP.
Authors’contributions
All listed authors made a substantial contribution to the concept, design, data acquisition, analysis, and interpretation of the data, as well as drafting of the manuscript and revising it. CF designed the study, carried out the statistical analysis and drafted the manuscript. HL contributed to the design of the study, helped drafting the manuscript and helped with interpreting the findings. HA coordinated data collection, and contributed to the design of the study, the interpretation of the data and the manuscript revision. JK helped interpret the findings and made critical revisions of the manuscript. NK helped to set up this study, contributed to the interpretation of the findings and made critical revisions. ES advised on the design of the study and also critically revised the manuscript. All authors have approved the final version of the manuscript.
Competing interests
The authors declare that they have no competing interests.
Consent for publication
Not applicable.
Ethics approval and consent to participate
No patient identifying data was used in our analysis, therefore no ethics approval or consent was required for this study.
Author details
1Department of Public Health, Centre for Medical Decision Making, Erasmus MC, Dr. Molewaterplein 50, NA-2217, 3000 CA Rotterdam, The Netherlands. 2
Department of Public Health, Amsterdam Medical Centre, Meibergdreef 9, 1105 AZ Amsterdam, The Netherlands.3Department of Medical Decision Making, Leiden University Medical Centre, LUMC-J10-S, PO Box 96002300 RC Leiden, The Netherlands.
Received: 9 March 2016 Accepted: 21 September 2016
References
1. Anema HA, Kievit J, Fischer C, Steyerberg EW, Klazinga NS. Influences of hospital information systems, indicator data collection and computation on reported Dutch hospital performance indicator scores. BMC Health Serv Res. 2013;13:212.
2. Anema HA, van der Veer SN, Kievit J, Krol-Warmerdam E, Fischer C, Steyerberg E, et al. Influences of definition ambiguity on hospital performance indicator scores: examples from The Netherlands. Eur J Public Health. 2013.
3. Adeyemo D, Radley S. Unplanned general surgical re-admissions - How many, which patients and why? Ann R Coll Surg Engl. 2007;89(4):363–7. 4. Donabedian A. The quality of care. How can it be assessed? JAMA.
1988;260(12):1743–8.
5. Mainz J. Defining and classifying clinical indicators for quality improvement. Int J Qual Health Care. 2003;15(6):523–30.
6. Torjesen I. NHS is unlikely to meet Nicholson challenge to deliver pound20bn in efficiency savings, says King’s Fund. BMJ. 2012;345, e6496. 7. Jenkins PJ, Clement ND, Hamilton DF, Gaston P, Patton JT, Howie CR.
Predicting the cost-effectiveness of total hip and knee replacement: a health economic analysis. The bone & joint journal. 2013;95-B(1):115–21. 8. SooHoo NFLJ, Ko CY, Zingmond DS. Provider volume of total knee
arthroplasties and patient outcomes in the HCUP-nationwide inpatient sample. J Bone Joint Surg Am. 2003;85(9):12.
9. Mahomed NN, Barrett JA, Katz JN, Phillips CB, Losina E, Lew RA, et al. Rates and outcomes of primary and revision total hip replacement in the United States medicare population. J Bone Joint Surg Am. 2003;85-A(1):27–32. 10. Bhattacharyya T, Freiberg AA, Mehta P, Katz JN, Ferris T. Measuring the report card: the validity of pay-for-performance metrics in orthopedic surgery. Health Aff. 2009;28(2):526–32.
11. Desai AS, Stevenson LW. Rehospitalization for heart failure: predict or prevent? Circulation. 2012;126(4):501–6.
12. Fischer C, Anema HA, Klazinga NS. The validity of indicators for assessing quality of care: a review of the European literature on hospital readmission rate. Eur J Public Health. 2012;22(4):484–91.
13. Heiden-vanderLoo M, Ho VKY DR, et al. Weinig lokaal recidieven na mammachirurgie: goede kwaliteit van de Nederalndse borstkankerzorg. Ned Tijdschr Geneeskd. 2010;154:A1984. 1.
14. Cronbach LJ, Meehl PE. Construct validity in psychological tests. Psychol Bull. 1955;52(4):281–302.
15. Kallewaard M BN, van Everdingen JJE, et al. Kwaliteit van Zorg in de Etalage, Eindrapportage 2007. Available from: https://www.zorginzicht.nl/ opendata/Paginas/aangeleverdebestanden.aspx?sub=1&fLvlT=
Openbare%20database&subldx=3. Accessed 3 Oct 2016.
16. Saleh KOM, Resig S, et al. Predictors of wound infection in hip and knee joint replacement: results from a 20 year surveillance program. J Orthop Res. 2000;20(3):10.
18. Sidorenkov G, Haaijer-Ruskamp FM, de Zeeuw D, Bilo H, Denig P. Review: relation between quality-of-care indicators for diabetes and patient outcomes: a systematic literature review. Med Care Res Rev. 2011;68(3):263–89.
19. Howell EA, Zeitlin J, Hebert PL, Balbierz A, Egorova N. Association between hospital-level obstetric quality indicators and maternal and neonatal morbidity. JAMA. 2014;312(15):1531–41.
20. Bottle A, Goudie R, Cowie MR, Bell D, Aylin P. Relation between process measures and diagnosis-specific readmission rates in patients with heart failure. Heart. 2015;101(21):1704–10.
21. Walker K, Neuburger J, Groene O, Cromwell DA, van der Meulen J. Public reporting of surgeon outcomes: low numbers of procedures lead to false complacency. Lancet. 2013;382(9905):1674–7.
22. van Gestel YRBM, Lemmens VEPP, Lingsma HF, de Hingh IHJT, Rutten HJT, Coebergh JWW. The hospital standardized mortality ratio fallacy: a narrative review. Med Care. 2012;50(8):662–7.
23. Peterson ED, Roe MT, Mulgund J, DeLong ER, Lytle BL, Brindis RG, et al. Association between hospital process performance and outcomes among patients with acute coronary syndromes. JAMA. 2006;295(16):1912–20. 24. Bradley EH, Herrin J, Elbel B, McNamara RL, Magid DJ, Nallamothu BK,
et al. Hospital quality for acute myocardial infarction: correlation among process measures and relationship with short-term mortality. JAMA. 2006;296(1):72–8.
25. Silber JH, Williams SV, Krakauer H, Schwartz JS. Hospital and patient characteristics associated with death after surgery. A study of adverse occurrence and failure to rescue. Med Care. 1992;30(7):615–29. 26. Tsai TC, Joynt KE, Orav EJ, Gawande AA, Jha AK. Variation in
surgical-readmission rates and quality of hospital care. N Engl J Med. 2013;369(12):1134–42.
27. Isaac T, Jha AK. Are patient safety indicators related to widely used measures of hospital quality? J Gen Intern Med. 2008;23(9):1373–8. 28. Werner RM, Bradlow ET. Relationship between Medicare’s hospital compare
performance measures and mortality rates. JAMA. 2006;296(22):2694–702. 29. Woolf SH, Grol R, Hutchinson A, Eccles M, Grimshaw J. Clinical guidelines: potential benefits, limitations, and harms of clinical guidelines. BMJ. 1999;318(7182):527–30.
30. Grimshaw JM, Russell IT. Effect of clinical guidelines on medical practice: a systematic review of rigorous evaluations. Lancet. 1993;342(8883):1317–22. 31. Engesaeter LB, Lie SA, Espehaug B, Furnes O, Vollset SE, Havelin LI.
Antibiotic prophylaxis in total hip arthroplasty: effects of antibiotic prophylaxis systemically and in bone cement on the revision rate of 22,170 primary hip replacements followed 0–14 years in the Norwegian Arthroplasty Register. Acta Orthop Scand. 2003;74(6):644–51.
32. Southwell-Keely JP, Russo RR, March L, Cumming R, Cameron I, Brnabic AJ. Antibiotic prophylaxis in hip fracture surgery: a metaanalysis. Clin Orthop Relat Res. 2004;419:179–84.
33. Slappendel R, Dirksen R, Weber EW, van der Schaaf DB. An algorithm to reduce allogenic red blood cell transfusions for major orthopedic surgery. Acta Orthop Scand. 2003;74(5):569–75.
34. Sculco TP, Baldini A, Keating EM. Blood management in total joint arthroplasty. Instr Course Lect. 2005;54:51–66.
35. Pedersen A, Johnsen S, Overgaard S, Soballe K, Sorensen HT, Lucht U. Registration in the danish hip arthroplasty registry: completeness of total hip arthroplasties and positive predictive value of registered diagnosis and postoperative complications. Acta Orthop Scand. 2004;75(4):434–41.
• We accept pre-submission inquiries
• Our selector tool helps you to find the most relevant journal • We provide round the clock customer support
• Convenient online submission • Thorough peer review
• Inclusion in PubMed and all major indexing services • Maximum visibility for your research
Submit your manuscript at www.biomedcentral.com/submit