P. C. Baker, M. D. Judd, S. D. J. McArthur
Institute for Energy and Environment, University of Strathclyde,
Glasgow, G1 1XW, UK
ABSTRACT
Partial discharge (PD) monitoring has been the subject of significant research in recent years, which has given rise to a range of well-established PD detection and measurement techniques, such as acoustic and RF, on which condition monitoring systems for high-voltage equipment have been based. This paper presents a novel approach to partial discharge monitoring by using a low-cost, low-power RF detector. The detector employs a frequency-based technique that can distinguish between multiple partial discharge events and other impulsive noise sources within a substation, tracking defect severity over time and providing information pertaining to plant health. The detector is designed to operate as part of a wireless condition monitoring network, removing the need for additional wiring to be installed into substations whilst still gaining the benefits of the RF technique. This novel approach to PD detection not only provides a low-cost solution to on-line partial discharge monitoring, but also presents a means to deploy wide-scale RF monitoring without the associated costs of wide-band monitoring systems.
Index Terms — Partial Discharges, UHF Detectors, Substations, Monitoring, Wireless Sensor Networks.
1 INTRODUCTION
PARTIAL discharge monitoring can play an important role in the ongoing maintenance of high-voltage plant. Due to the increased regulatory and operational demands faced by operators and the large capital value of equipment, the need for effective condition monitoring is a key requirement to avoid equipment failure, ensure equipment uptime, and mitigate business risk in an increasingly competitive marketplace.
Partial discharges occur due to degradation in the dielectric insulation surrounding plant components. These defects may occur during its operational lifetime or may be present during the manufacturing process, and can increase in both intensity and frequency, eventually leading to internal arcing which in some cases can lead to loss of the asset.
The need for effective monitoring capabilities across all industries, along with the associated miniaturization of digital electronic devices, has led to the development of low-power wireless sensor network technology. These networks, based upon individual low-power devices, are designed to accumulate and disseminate sensory data from equipment under inspection to monitoring engineers, with the aim of increasing the level of knowledge regarding the state of the equipment. This technology has been used in numerous industrial applications [1], including substations [2-3].
This paper presents a low cost, low power sensor system
designed to detect PDs within high-voltage plant such as oil-filled transformers and gas-insulated switchgear (GIS). Requirements and specification of the detector are given, followed by a laboratory case study which tests the detector prototype against three SF6 partial discharge test cells. The
results of these tests are presented, and a novel method of visualization and classification is proposed.
One of the key drivers behind the design of the device was that it may be deployed as part of a wireless sensor network within a substation. Such a device would be installed on a piece of plant, and would communicate wirelessly with its peers or a central basestation. On-board processing of data can be carried out at thesensor-level, performing analysis quicker and reducing overall communication overheads. Such networks can also be easily integrated with existing monitoring infrastructure such as multi-agent systems and IEC61850 [4]. Looking forward, wireless sensors within a substation could employ energy harvesting to extract energy from the surrounding electric field, enabling them to self-power from the substation environment [5].
Using low-power circuitry for a condition monitoring sensor places fundamental limits on the capabilities of the device. Whereas previous RF techniques have focused on capturing large amounts of high-frequency data using fast oscilloscopes or equivalent and applying some type of data mining method to extract the required information [6], the approach to PD monitoring presented in this paper differs from traditional
methods as it attempts to identify and classify impulsive noise events by comparing spectral energies within specific
A Frequency-Based RF Partial Discharge
Detector for Low-Power Wireless Sensing
frequency bands. The RF signals emitted by PD defects have previously been shown to contain varying proportions of energy across different frequency bands by defect type [7-8], therefore defect classification based upon frequency ’fingerprints’ is possible. This method may not be as precise as widebandmethods, but it does not require wide-band signal capturing and conditioning hardware which is both resource intensive andexpensive and cannot economically be deployed across numerous pieces of plant. By applying the RF monitoring technique using low-cost hardware, it is feasible that low-power PD detectors could be installed network-wide, becoming an integral part of substation condition monitoring as a whole.
This research demonstrates that through the application of a low power monitoring technique it is possible to determine the frequency and intensity of PD events, as well as identify multiple defects within high voltage plant. Tracking changes in the plant behavior with respect to PD activity will provide information to monitoring engineers that may be used to estimate plant health and plan maintenance.
2 BACKGROUND
2.1 P
ARTIALD
ISCHARGEM
ONITORINGContin et al [9] state that frequency content is lost using conventional peak detection equipment, which may be advantageous in the separation and classification of PD sources. A multi-channel peak detector, which splits each recorded pulse across a number of frequency bands, is capable of capturing spectral energies as well as the total pulse magnitude, which can directly facilitate the separation of signals into homogeneous groups. Previous research into PD monitoring has highlighted the advantages of “separating PD pulses in homogeneous classes; each one relevant to a specific defect”, and by separating defects by class, subsequent analysis and identification becomes easier [10].
2.2 RF
PD
M
ONITORINGJudd et al [6] [11] have previously discussed that RF techniques allow for ‘detection, location, analysis, and monitoringof PD’ in both GIS and oil-filled transformers. RF monitoring has been proven as an effective tool in diagnosing faults, and significant ongoing research is being carried out to refine the associated techniques [12-14]. The current state of the art in RF monitoring equipment consists of a wide-band UHF signal capture and conditioning unit, coupled with a PC to perform analysis and provide a data visualization through a
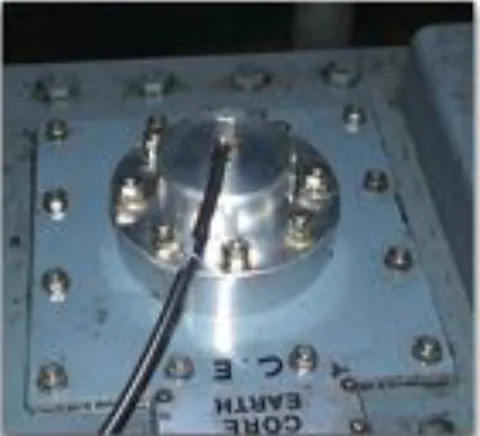
user interface. Figure 1 outlines the architecture of such a system, which is able to differentiate between a number of different PD fault types, and perform accurate fault location using time-of-flightdata coupled with previous case data. For specific instances where HV plant is undergoing an unknown fault, the benefits ofusing a wide band on-line RF monitoring system are significant. A transformer which has been previously fitted with dielectric windows, such as the one seen in Figure 2, can be fitted with a portable RF monitor which can be left for a number of days or weeks to record PD activity. After this period, the data can be analyzed and conclusions can be drawn on the nature and location of the faults under observation. Such a system has beenproven to be effective in a number of different situations [15-16].
One drawback of this system is that, despite its portable nature, it requires a large processing capability to be able to effectively capture signals in the UHF band, and because of this, it must be tethered to a mains power source for on-line operation. This presents an issue for large-scale RF monitoring deployments, as it is notviable to install such a system on all high-voltage plant.
CIGRE has recently published a report outlining facilities for CM systems [17] which recommends choosing appropriate levels of monitoring based upon asset value. A low-cost PD detector would allow RF monitoring to be economically viable on low-valued assets, where the RF technique would not otherwise be considered. This system would be complementary to existing monitoring schemes, helping engineers to make informed decisions regarding plant maintenance, such as when to carry out servicing or when to apply wide-band monitoring techniques.
2.3 PD
F
REQUENCYC
HARACTERISTICSThe magnitude and frequency characteristics of certain partial discharge defects in SF6 have been presented in [8],
[image:2.612.324.564.490.708.2]which states that that the frequency spectra of PD emissions
[image:2.612.48.300.613.713.2]contain defect-specific information which may be used for classification.
However, the observed frequency components of PD emissions depend on several factors other than the specific defect type, such as the relationship between PD source and sensor in terms of geometry and distance due to complex propagation effects (In an oil-filled transformer, defect and sensor position will have a more significant effect due to the extra complexity of internal components compared with GIS).
While these factors do affect PD emissions, certain defects exhibit significantly different frequency spectra. For instance, in [8], free particle defects were found to have a high intensity and high amplitude across the full frequency spectrum, while protrusions were found to have a low amplitude and a higher intensity at low frequencies, with floating electrode defects having a significantly higher intensity than particle and protrusion defects. The frequency spectrum of an individual PD source was also found to not change over time.
Despite the geometric arrangement of PD and sensor having an impact on the observed spectrum, it may be possible to classify a defect with some level of certainty based upon its frequency spectrum. The technique described in this paper demonstrates that this is possible.
2.4 W
IRELESSS
ENSORN
ETWORKSRecent developments in miniaturization of digital electronics devices have fuelled the development of wireless sensor networks (WSNs), which are increasingly being used for a wide-range of monitoring applications. To date, this technology has seen limited applications in the field of condition monitoring for power system assets. These networks are made up of a number of individual devices which can ‘self organize’ to form an ad-hoc network with redundant links. Sensory data is transmitted through the sensor network, and passed back through data aggregation nodes to a wired network where the data is presented to monitoring engineers. These devices offer an integrated computing platform; encapsulating sensing, processing, data storage, communications and power components in a single compact package.
Wireless sensor networks offer significant advantages over wired equivalents. Firstly, wireless sensors will not require costly and potentially hazardous cabling throughout a substation. Secondly, by analyzing monitoring data at the source, bandwidth requirements can be reduced to a manageable level, thus reducing the need for expensive high-capacity communication links between substations and corporate networks.
Impulsive noise, such as the RF signals emitted by PDs, is known to have a degrading effect on wireless data channels. This is a recognized problem for substation applications, and is the subject of ongoing research [18-19].
The low-power PD detector was specifically designed to take advantage of wireless sensor technology. By combining wireless sensor networks with the RF monitoring technique, this low-power technology presents a fast-track route to wide-scale deployment of on-line PD sensors across the entire network, capable of detecting and diagnosing multiple defects,
which could allow monitoring engineers to infer the ongoing state of health of plant, leveraging the RF technique where it wouldotherwise not be practical.
3 DETECTOR REQUIREMENTS
The functional requirements of the detector are as follows: the detector must be able to sense and record the intensity of PD signals and their relative spectral magnitudes for a set of predefined frequency bands, and; the detector must also be able to differentiate between PD and background RF noise such as mobile phone signals and other impulsive events such as coronadischarge.
As the detector is ultimately to be directly attached to plant, it must be relatively small although size constraints are not paramount as the plant under observation will be orders of magnitude larger than the monitoring device.
Another key requirement is the ability for the detector to interface with RF sensors attached to plant enclosures. New GIS installations increasingly include integrated RF sensors, and sensor mounting facilities are undergoing standardization efforts for oil-filled transformers [17], where they may be mounted to inspection hatches and through oil valves [6]. Figure 2 shows an example of such a sensor, which has been fitted to the top of a transformer tank and interfaces with the inside of the tank through a dielectric window built into the sensor housing. If standard interfaces continue to be provided on both new and retrofitted equipment, low-power detectors could be attached to plant in the future with little or no downtime.
Figure 4. Partial discharge detector simplified block diagram. The three-channel detector converts raw RF signals info proportional spectral magnitudes.
[image:3.612.320.567.417.578.2] [image:3.612.318.570.617.704.2]4 DETECTOR OVERVIEW
The prototype detector measures 120mm x 80mm x 60mm, and is enclosed in a metal box with an N-type input connector for each channel, as shown in Figure 3. To allow configurability, the detector was designed to use external band filters that can be reconfigured easily if required. These filters are N-Type Barrel filters which are screwed directly onto the input connectors on the front of the detector. A graphical overview of the device can be seen in Figure 4.
4.1 D
ETECTORF
REQUENCYB
ANDSThe detector frequency bands are listed in Table 1. These values where chosen based upon previous work carried out on frequency-based analysis of PD emissions. Meijer [8] previously used the relative energies of a low-frequency span of 100MHz to 350MHz compared to a high-frequency span of 750MHz to 1100MHz with which to calculate a classification feature. These bands were used as a basis for the detector, with an additional centre band added to cover the entire spectrum. There is some overlap between the bands, which is due to the availability of compatible filters.
To facilitate detector prototyping, the detector also featured BNC connectors at the output to allow signal measurement, although future iterations of the design will remove output connectors in favor of an internal wireless sensor node, which will only require an antenna to provide output via a wireless network connection.
4.2 P
HYSICALD
EVICEO
VERVIEWThe detector consists of three identical channels, each capable of converting wide-band RF signals to an output pulse
which approximates the RF signal envelope. At the input of each channel, a passive inline filter is connected to restrict the input frequency range. At the centre of the circuit is a Schottky diode detector circuit, followed by a 5MHz low-pass filter used to condition the output pulse by removing any trace UHF frequency components. This signal is then amplified from the millivolt range up to the volt range, allowing it to be sampled by an analogue to digital converter such as those found on wireless sensor nodes. The resultant output is three pulse envelopes representing the relative energy within the three frequency bands, which are then sampled and stored for analysis.
While the detector has been designed for low-power operation, it is a prototype device and therefore is not yet fully optimized. The active current at 5V was measured at 16mA. To put this into context: in an ideal case, four 1.5V AA NiMH batteries rated at 1500mAh would power the device constantly for over 93 hours. With a duty cycle of 1%, this would be extended to over 12 months. Higher capacity batteries, circuit optimization, intelligent power management and an alternative power source such as those described in [20] would extend the battery life even further. Looking forward, a combination of all of these techniques must be used if robust, battery-operated wireless sensors are to be deployed into substations.
4.3 O
UTPUTD
ATAThe tri-band PD detector captures the peak value of the PD envelope for three discrete frequency bands. These values can then be normalized into a proportional form, which represents the relative spectral energies within the PD signal. The total magnitude of the captured sample is also included as a fourth feature, as the sum of the three channels
.
The fourvalues are combined into a 4-tuple, which represents the feature vector for a single detector sample (1).!
Features1..4={ P1
Pi
i=1 3
"
,P2 Pi
i=1 3
"
,P3 Pi
i=1 3
"
, i=1Pi3
"
} (1)Table 1.Channel Frequency Range
Band Range
Lower 0 - 450MHz
Middle 400 - 750MHz
Upper 700 - 3200MHz
Figure 5. Three 3-dimensional proportional data points mapped onto a 2-dimensional simplex, with their corresponding histograms. This type of plot is commonly called a ternary or simplex plot.
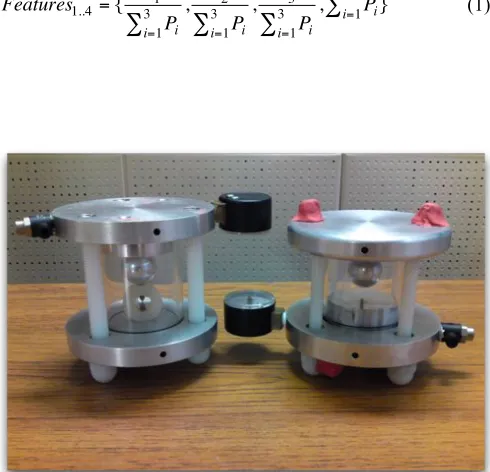
Figure 6. Two of the test cells used for the experiment. On the left is the floating electrode in SF6 test cell, and on the right is the rolling particle in SF6
[image:4.612.320.565.479.715.2] [image:4.612.48.297.565.715.2]The proportional nature of the first three sample features is advantageous for visualization purposes, as each point within a normalized proportional data set of dimension n falls within an n
-
1 dimension simplex. In this case, the proportional sample values fall within a triangular 2D simplex, which is illustrated by example in Figure 5. This normalization technique is identical to the process used to generate the gas-in-oil ratios used to plot Duval’s Triangle [21]. Hence a similar visualization technique, also using a ternary plot, may be used to visualize and aid analysis of the PD data. The fourth result feature, the total magnitude, has not currently been used for analysis but is retained to aid diagnosis in the future, where the absolute value of signal energy will be used to track defect severity over time.5 LABORATORY CASE STUDY
The aim of the laboratory study was to determine the effectiveness of the PD detector, and to establish whether it could differentiate between both different defect types and multiple defects at different positions. Testing of the device was carried out within a laboratory environment using an air-filled 1.3m x 1.3m x 2.3m metal enclosure with a number of test cells designed to simulate different defect types. Two of these test cells are shown in Figure 6.
The test tank was fitted with three monopole RF sensors, plus an additional panel which can accept a number of different RF PD sensor types. To ensure the optimum signal was provided to the detector, an initial test was carried out using a monopolesensor, dipole sensor, spiral sensor and disc coupler sensor. The disc coupler was found to have the highest dynamic range outof all the sensors, and therefore was chosen for use in all subsequent tests.
Three test cells that simulate the following defects were compared: rolling particle in SF6, floating electrode in SF6,
and protrusion in SF6. These test cells were connected to a
50kV Foster transformer, as shown in Figure 7, which was energized at up to 15kV to generate PDs within each of the cells. Each cell has an aluminium plate, top and bottom, which are connected to the terminals of the transformer. Joining these terminals is a perspex cylinder which forms an airtight vessel in which the simulated defect is situated. The cells were each filled with SF6, pressurized at 2 bar for all the
experiments.
Each of the test cells were used at two positions within the test tank, illustrated in Figure 8. The position of the transformer and the length of the high-voltage cables were the limiting factors in positioning the test cells. To safely operate the transformer, it was necessary to position it directly beneath the sensor hatch so its controls could be manipulated from outside the test tank. With the transformer position fixed, the available locations for the test cells were immediately in front of the sensor hatch and in the center of the test tank.
As well as being tested in two positions, the floating electrode test cell was oriented in three planes to simulate the RF emission of an individual defect propagating in different directions. This was carried out to see how the defect orientation might affect the recorded frequency spectrum. The defect orientations are shown in Figure 8.
[image:5.612.50.296.54.324.2]In future iterations of the detector, gain compression within the UHF preamplifier stage would be used to match the dynamic range of the PD signals with that of the envelope Figure 8. Defect positions within the test tank, and defect orientations used with the floating electrode test cell.
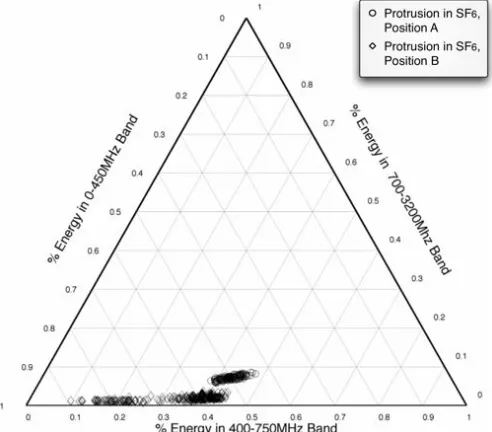
Figure 9. Ternary plot showing protrusion in SF6 results. Note the distinctive
[image:5.612.318.570.55.129.2]'wedge' shape, focused towards the lower portion of the frequency spectrum.
[image:5.612.319.565.506.722.2]detectors. However, in the experiments reported here, an appropriate level of amplification or attenuation was added manually for this purpose. The 3-channel detector was fed from a single sensor using a pair of N-type T-pieces. Signals were captured on a 4-channel 1 GSs-1 LeCroy oscilloscope,
and archived to disk for further analysis. The results of these tests are discussed below.
5.1
E
XPERIMENTALR
ESULTS5.1.1 PROTRUSION IN SF6
The protrusion in SF6 test cell, as shown in Figure 6,
contains a vertically protruding needle from one of the
conductors. When energized to inception voltage, corona discharge can be visibly observed at the tip of the needle. The results captured by the detector can be seen in Figure 9, which show that the recorded spectra form a distinctive ’wedge’ shape, where the spectra varies in intensity between the lower and middle bands, but have less than a 10% proportion of high-frequency content.
The results fall into two distinct clusters, corresponding to two positions. The presence of two distinct clusters, purely based upon position, suggests that multiple protrusion defects in SF6 may be distinguished based upon frequency spectra. It
[image:6.612.47.563.55.306.2]should be noted that the geometry of the test tank is Figure 10. Ternary plot showing floating electrode in SF6 test results. Results from the two positions can be linearly separated.
Figure 12. Ternary plot showing all experimental results.
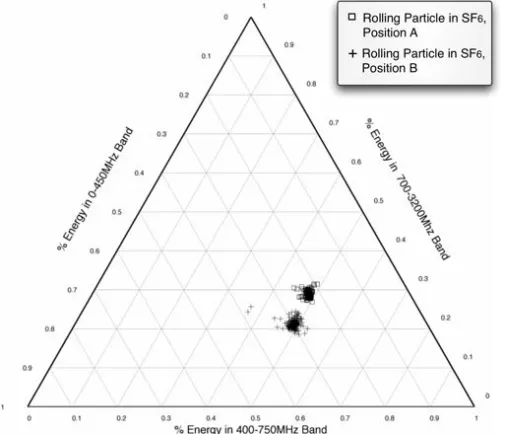
Figure 11. Ternary plot showing rolling particle in SF6 test results. Two
[image:6.612.318.567.337.558.2] [image:6.612.47.304.340.557.2]completely different to GIS, so further tests would be required to validate this in practise.
5.1.2 ROLLING PARTICLE IN SF6
The rolling particle test cell contains aluminium ball rolling on a concave plate at the bottom of the cell. When activated, PDs occur between the base-plate and the ball. Recorded PD emissions for this test cell can be seen in Figure 11. The results from both positions fall within the same region of the chart, with half the spectral energy falling within the middle 400MHz-750MHz band. The remaining spectral energy varies between the upper and lower bands based upon position. Results from each position are uniform with minor variance, falling in tight clusters.
There is a clear separation between results from each position, with no overlap between results. This infers that the frequency spectrum of the rolling particle defect test cell is uniform, and the measured spectrum varies only with location. As the frequency spectra of fixed defects does not change over time, and free particles in SF6 may move within the GIS
enclosure, an observed change in frequency spectrum in a single observed defect would therefore infer that the defect is a free particle and is actively mobile.
5.1.3 FLOATING ELECTRODE IN SF6
The floating electrode test cell contains a polythene ring which holds a metal electrode approximately 1mm from one of the energized plates. When activated, a PD occurs between the plate and this electrode. The RF emissions from each PD pulse were also by far the largest of all the test cells, requiring a 10dB attenuator to be added in series with the disc coupler sensor. As the discharges from this test cell were consistent and of a large magnitude, testing with this cell was carried out using multiple orientations as well as positions A and B. The orientations used are defined inFigure 8.
PDs generated by this test cell were found to form a tight cluster, with their spectra largely consistent even across multiple positions and orientations, as shown in Figure 10. The defect orientation is shown to have little effect on the recorded RF spectrum, although the test tank is mostly free space, so propagation direction may have less of an effect than in actual plant where solid materials would be present. The plot shows that floating electrode defects have a higher proportion of spectral energy in the >700MHz band, differentiating them from the floating particle and protrusion defects.
5.2 R
ESULTA
NALYSISThe results discussed above demonstrate that a ternary plot can be used to assist the interpretation of frequency spectra of different PD defects, where 3 frequency bands are used. Figure 12 shows all of the experimental results on a single chart. Both the protrusion in SF6 and rolling particle in SF6
results form two distinct clusters for the different positions. As the defect position was the only variable altered between these results, it is clear that the tank geometry has an effect on defect frequency spectrum. Several assertions can be made based from the results, as follows.
For a piece of plant, if multiple defects are present in separate locations they will fall into separate clusters based upon the geometric relationship between the defect source and sensor, even if the defects are of the same type. This can be used as an advantage, as observing multiple clusters therefore signifies the presence of multiple defects.
However, this was not the case for the floating electrode defect, where the recorded frequency spectra fell into 6 tightly coupled clusters. Floating electrodes typically emit relatively high signals compared to other defects, so combining the signal magnitude as an additional feature may allow for more accurate analysis in this case.
The floating electrode and rolling particle defects have a similar frequency fingerprint, although the results given in this paper are still linearly separable. In practise, it may not be possible to distinguish these defect types based upon frequency alone, although it is clear from the results that the protrusion defect has a unique frequency fingerprint which can be easily classified using this technique. Further investigation into known defects is therefore recommended as only three defect types were investigated here, and it may be possible to classify additional defect types using this approach.
Known sources of RF noise can also be taken into account on the ternary plot. Within the UK, terrestrial television is broadcast between 470MHz and 850MHz. This is also true for mobile telephones and wireless data standards such as WiFi and Zigbee, which operate between 900MHz and 2700MHz. Such modulated signals are centred on a single carrier frequency, and therefore if detected by the PD detector, should appear at a single point on the ternary chart. In the case of terrestrial TV signals, these will appear in the lower right hand corner, and all other signals discussed will appear in the top corner.
The measurement technique presented in this paper cannot immediately be used as a universal classifier but is nevertheless a powerful diagnostic tool. The overall technique does extract defect-specific information from PD emissions, and is both adaptable and scalable. To improve the accuracy of this method, a larger set of wide-band RF measurements from PD test cells and on-line plant could be analyzed to expand knowledge pertaining to PD emission frequency spectra. Further case studies with a larger set of archived wide-band data would allow a more complete model to be created, which in turn may allow automatic defect classification to be achieved in the future.
6 CONCLUSION
This paper has presented a novel approach to RF PD monitoring using a low-powered detector which employs a frequency-based technique. The detector is capable determining the presence of multiple defects, as well as rudimentary defect classification. Ternary plots have been used for the presentation and analysis of the PD data, allowing defects to be linearly separated. In the future, frequency features of a PD emission may be combined with the PD magnitude measurement to track defect severity over time.
be integrated with the detector, creating a monitoring device capable of real-time data capture and analysis. The system will be able to analyze and log defects as they are recorded, and report back pertinent information to engineers when required. This system will then be deployed within a substation for online field trials. Future work will also see the detector integrated with an energy scavenging system, allowing the device to be self-powered from the substation environment.
ACKNOWLEDGMENT
The authors would like to thank Mr. J. Barrasford for his invaluable help and technical skills throughout the detector development process, and Dr. Bruce Stephen for lending his expert knowledge on data analysis techniques.
REFERENCES
[1] I. Akyildiz, W. Su, Y. Sankarasubramaniam, and E. Cayirci, “Wireless Sensor Networks: A Survey,” Computer Networks, Volume 38, Issue 4, pp.393–422, 2002.
[2] Q. Gao and H. Wang, “WSN design in high-voltage transformer sub-station,” Intelligent Control and Automation, 2008. WCICA 2008. 7th
World Congress on, pp. 6720–6724, Jun. 2008.
[3] A. Nasipuri, R. Cox, H. Alasti, L. Van der Zel, B. Rodriguez, R. McK- osky, and J. A. Graziano, “Wireless sensor network for substation monitoring: design and deployment,” in Proceedings of the 6th ACM
conference on Embedded network sensor systems. Association of
Computing Machinery, New York, NY, USA, 2008, pp. 365–366. [4] P. C. Baker, S. D. J. McArthur, and M. D. Judd, “Data Management of
On-Line Partial Discharge Monitoring Using Wireless Sensor Nodes Integrated with a Multi-Agent System,” Intelligent Systems Applications to Power Systems, 2007. ISAP 2007. International Conference on, pp. 1–6, 2007.
[5] M. Zhu, A. Reid, S. Finney, and M. Judd, “Energy Scavenging Technique for Powering Wireless Sensors,” Condition Monitoring and Diagnosis, 2008.CMD 2008. International Conference on, pp. 881–884, April 2008.
[6] M. D. Judd, L. Yang, and I. B. B. Hunter, “Partial Discharge Monitoring for Power Transformers using UHF Sensors Part 1: Sensors and Signal Interpretation,”IEEE Electrical Insulation Magazine, vol. 21, no. 2, pp. 5–14, March 2005.
[7] A. J. Reid, M. D. Judd, and R. A. Fouracre, “Frequency distribution of RF energy from PD sources and its application in combined RF and IEC60270 measurements,” in Electrical Insulation and Dielectric Phenomena, 2006 IEEE Conference on, 2006, pp. 640–643.
[8] S. Meijer, “Partial discharge diagnosis of high-voltage gas-insulated systems,” Ph.D. dissertation, Technische Universiteit Delft, November 2001.
[9] A. Contin, A. Cavallini, G. Montanari, G. Pasini, and F. Puletti, “Digital detection and fuzzy classification of partial discharge signals,” Dielectrics and Electrical Insulation, IEEE Transactions on [see also Electrical Insulation, IEEE Transactions on], vol. 9, no. 3, pp. 335–348, 2002.
[10] A. Cavallini, M. Conti, A. Contin, and G. Montanari, “Advanced PD inference in on-field measurements. II. Identification of defects in solid insulation systems,” Dielectrics and Electrical Insulation, IEEE Transactions on [see also Electrical Insulation, IEEE Transactions on], vol. 10, no. 3, pp. 528–538,2003.
[11] M. D. Judd, O. Farish, and B. F. Hampton, “The excitation of UHF signals by partial discharges in GIS,” Dielectrics and Electrical Insulation, IEEE Transactions on, vol. 3, no. 2, pp. 213–228, April 1996.
[12] P. D. Agoris, S. Meijer, J. J. Smit, and J. Lopez-Roldan, “Sensitivity check of internal sensor for power transformer partial discharge measurements,” Properties and applications of Dielectric Materials, 2006. 8th International Conference on, pp. 230–233, June 2006.
[13] Z. Tang, C. Li, X. Cheng, W. Wang, J. Li, and J. Li, “Partial discharge location in power transformers using wideband RF detection,” Dielectrics andElectrical Insulation, IEEE Transactions on, vol. 13, no. 6, pp. 1193–1199, December 2006.
[14] S. Coenen, S. Tenbohlen, S. Markalous, and T. Strehl, “Performance check and sensitivity verification for UHF PD measurements on power transformers,” Proc. 15th Int. Symp. on High Voltage Engineering (Ljubljana, Slovenia), Paper No: T7-100, April 2007.
[15] M. D. Judd, L. Yang, and I. B. B. Hunter, “Partial Discharge Monitoring for Power Transformers using UHF Sensors Part 2: Field experience,” IEEE Electrical Insulation Magazine, vol. 21, no. 3, pp. 5–13, May 2005.
[16] M. D. Judd, S. D. J. McArthur, A. J. Reid, V. M. Catterson, L. Yang, B. Jacobson, K. O. Svensson, and M. Gunnarsson, “Investigation of Radiometric Partial Discharge Detection for use in Switched HVDC Testing,” Power Engineering Society General Meeting, 2006. IEEE, June 2006.
[17] P. Jarman, “Recommendations for condition monitoring and condition assessment facilities for transformers,” CIGRE (Paris), Tech. Rep. Brochure 343,April 2008.
[18] Q. Shan, I. Glover, P. Moore, I. Portugues, R. Watson, and R. Rutherford, “Performance of Zigbee in Electricity Supply Substations,” Wireless Communications, Networking and Mobile Computing, 2007. (WiCom 2007). International Conference on, pp. 3866–3869, 2007.
[19] I. Portugues, P. Moore, I. Glover, and R. Watson, “A portable wideband
impulsive noise location system,” Instrumentation and Measurement, IEEETransactions on, vol. 57, no. 9, pp. 2059–2066, 2008.
[20] M Zhu. P. C. Baker, N. M. Roscoe, M. D. Judd, and J. Fitch, “Alternative Power Sources for Autonomous Sensors in High Voltage Plant,” Proceedings of the 2009 IEEE Electrical Insulation Conference (EIC), Montreal Canada, June 2009, pp 36-40.
[21] M. Duval, “A review of faults detectable by gas-in-oil analysis in transformers,” IEEE Electrical Insulation Magazine, vol. 18, no. 3, pp. 8–17, 2002.
Pete Baker is a Research Assistant within the Institute for Energy and Environment, at the University of Strathclyde in Glasgow, Scotland, UK. He received his B.Eng. (Hons) Degree from the University of Strathclyde in 2004. His research interests include wireless sensor networks, multi-agent systems, condition monitoring and systems integration.
Dr. Martin D. Judd (M 2002, SM 2004) is Reader in the Institute for Energy and Environment at the University of Strathclyde, where he manages the High Voltage Diagnostics Laboratory. He graduated from the University of Hull in 1985 with a BSc (Hons) degree in Electronic Engineering. His employment experience includes four years working for Marconi Electronic Devices Ltd followed by four years with EEV Ltd, both in Lincoln, England. Martin received a PhD from the University of Strathclyde in 1996 for his research into the excitation of UHF signals by partial discharges in gas insulated switchgear. From 1999 to 2004 he was an EPSRC Advanced Research Fellow. He is an expert on electromagnetic theory, propagation and measurement and leads a research team specializing in high frequency diagnostic techniques for high voltage electrical equipment and systems. He is a Chartered Engineer, a Member of the IET and a Fellow of the Higher Education Academy.