Sensor Networks
.
White Rose Research Online URL for this paper:
http://eprints.whiterose.ac.uk/145759/
Version: Accepted Version
Article:
Gorma, Wael Mohamed, Mitchell, Paul Daniel orcid.org/0000-0003-0714-2581, Morozs,
Nils orcid.org/0000-0001-9862-7378 et al. (1 more author) (Accepted: 2019)
CFDAMA-SRR: A MAC Protocol for Underwater Acoustic Sensor Networks. IEEE Access.
pp. 60721-60735. ISSN 2169-3536 (In Press)
[email protected] https://eprints.whiterose.ac.uk/ Reuse
Items deposited in White Rose Research Online are protected by copyright, with all rights reserved unless indicated otherwise. They may be downloaded and/or printed for private study, or other acts as permitted by national copyright laws. The publisher or other rights holders may allow further reproduction and re-use of the full text version. This is indicated by the licence information on the White Rose Research Online record for the item.
Takedown
If you consider content in White Rose Research Online to be in breach of UK law, please notify us by
CFDAMA-SRR: A MAC Protocol for
Underwater Acoustic Sensor Networks
WAEL GORMA1, PAUL D. MITCHELL2, (Senior Member, IEEE), NILS MOROZS3,
(Member, IEEE), AND YURIY V. ZAKHAROV4, (Senior Member, IEEE)
1,2,3,4
The authors are with the Department of Electronic Engineering, University of York, Heslington, York YO10 5DD, United Kingdom.
Corresponding author: Wael Gorma ([email protected]).
The work of P. Mitchell, N. Morozs and Y. Zakharov is partly supported by the UK Engineering and Physical Sciences Research Council (EPSRC) through the Grants EP/P017975/1 and EP/R003297/1.
ABSTRACT Underwater acoustic sensor networks are an enabling technology for many applications. Long propagation delays and limited bandwidth of the acoustic channel place constraints on the trade-off between achievable end-to-end delay, channel utilisation and fairness. This paper provides new insights into the use of the Combined Free/Demand Assignment Multiple Access (CFDAMA) schemes. CFDAMA can be classified as Adaptive TDMA where capacity is usually assigned on demand. CFDAMA with round robin requests (CFDAMA-RR) is shown to minimise end-to-end delay and maximise channel utilisation underwater. It sustains fairness between nodes with minimum overhead and adapts to changes in the underwater channel and time-varying traffic requirements. However, its performance is heavily dependent on the network size. The major contribution of the paper is a new scheme employing the round robin request strategy in a systematic manner (CFDAMA-SRR). Comprehensive event-driven Riverbed simulations of a network deployed on the sea bed show that SRR outperforms its underlying scheme, CFDAMA-RR, especially when sensor nodes are widely spread. Considering node locations, the novel scheme has a bias against long delay demand assigned slots to enhance the performance of CFDAMA-RR. Illustrative examples show good agreement between analytical and simulation results.
INDEX TERMS CFDAMA, Medium Access Control, TDMA, Underwater Acoustic Sensor Networks.
I. INTRODUCTION
U
NDERWATER Acoustic Sensor Networks (UASNs) are an enabling technology for numerous underwater scientific, industrial and homeland security applications [1]. The use of acoustic waves underwater places constraints on the functionality of Medium Access Control (MAC) protocols. Long propagation delays and limited distance-dependent bandwidth are key constraints, which pose chal-lenges to the design of MAC protocols including attempts to strike a balance between network end-to-end delay and throughput [2]. Low-cost sensing and communication vices are now being developed, which will make the de-ployment of many underwater sensor nodes (as many as 100 nodes or more) feasible in the future [3]. Due to the special characteristics of the underwater environment, specially de-signed underwater MAC protocols are very much in demand.Contention-based MAC protocols can be less efficient for centralised topologies due to the potential high contention in winning the channel [4]. However, they are more
is the centralised type. The problem of scheduling has also been addressed in [8]. The authors called their protocol the staggered TDMA underwater MAC protocol (STUMP). It is a collision-free MAC protocol exploiting node location diversity and alleviating the impact of slow propagation speed. The protocol leverages propagation delay information to increase channel utilisation by allowing concurrent data transmissions from several nodes.
Schedule-based techniques can also be combined with contention-based schemes [4]. This combination is classified as Adaptive TDMA where capacity is usually assigned on demand. Three capacity assignment schemes have been ex-amined in [2]. Demand assignment, Free assignment and the Combined Free and Demand Assignment Multiple Access (CFDAMA) schemes. Free assignment is shown to offer close to the theoretical minimum end-to-end delay, but only at low channel loads. Demand assignment can support much higher channel loads, but with longer delays. CFDAMA is capable of minimising the end-to-end delay and maximising the channel utilisation. It has been proposed in [9] for satellite channels to enhance the delay/utilisation performance of long delay geostationary satellite links. It is capable of improving the overall performance of networks which suffer from long propagation delays and limited capacity such as UASNs. The presence of the free assignment strategy in CFDAMA works as a backup slot provider. It means that CFDAMA can adapt to the severe underwater conditions that may bring about instantaneous connection loss, preventing sensor nodes from sending requests. Combining two different MAC schemes with the possibility of using several request strategies gives CFDAMA the flexibility to meet different network require-ments and applications. Simplicity is a fundamental feature of CFDAMA as most of the processing is done at a master node, typically equipped with a terrestrial high-speed link, synchronised clock and a more sustainable power source.
When designing and evaluating the performance of MAC protocols, applications associated with environmental mon-itoring are usually characterised with periodic data traffic models [7]. On the other hand, the Poisson traffic model, which enables tractable theoretical analysis, is a more ac-curate representation for other applications [10], [11], [12], such as remote fish detection or security monitoring. This paper evaluates the performance of CFDAMA schemes un-derwater with two distinct traffic types based on a Poisson model and a self-similar model [13]. As CFDAMA is a combined protocol, it is tolerant to changes in the type of data traffic.
In [2], in which we first considered CFDAMA for UASNs, the study is limited to a conventional request strategy based on random access. The impact of different request strate-gies has not been examined. Following that, we introduced a new CFDAMA scheme in [14], called CFDAMA with Intermediate Scheduler, to significantly reduce the average round-trip time required for making capacity requests and receiving subsequent acknowledgements. This enhances the overall delay/utilisation performance of CFDAMA. There,
the analysis of delay performance focuses on the dominant factors determining the average end-to-end delay of pack-ets. Queueing time at sensor nodes has not been covered. Spatial distribution of nodes and the statistical behaviour of traffic sources have not been investigated. Due to the long propagation delay underwater and the fact that sensor nodes can be widely spread, implementing CFDAMA with one of the conventional request strategies and without considering the location of nodes results in poorer efficiency than the level of which the scheme is capable. Beyond the previous work, we introduce in this paper a new scheme, CFDAMA with Systematic Round Robin requests (CFDAMA-SRR), to boost the effectiveness of CFDAMA underwater. The key contributions in this paper include:
• A new CFDAMA scheme, i.e. CFDAMA-SRR. • Analysis of CFDAMA-SRR behaviour for
representa-tive underwater scenarios, through analytical and nu-merical simulations.
• Recommendations on the trade-off between
CFDAMA-SRR parameters under two distinct traffic conditions.
• Comprehensive simulation results based on a realistic
underwater sensor deployment for seismic monitoring in oil reservoirs, with the use of the BELLHOP acoustic field computation program [15].
• Evaluation of CFDAMA-SRR performance via an
acoustic channel simulated based on well-known under-water propagation and ambient noise models.
The rest of the paper is organized as follows: Section II in-troduces CFDAMA, Section III describes the new CFDAMA variant, Section IV presents the simulated underwater scenar-ios and parameters, Section V illustrates the outcomes of the detailed simulation study, and finally, Section VI concludes the paper.
II. THE CFDAMA PROTOCOL
This section outlines the operation of CFDAMA, and de-scribes the CFDAMA scheduling algorithm and frame struc-tures. This is required in order to understand the new scheme proposed in the next section as well as some related math-ematical analysis and comparative performance results pre-sented later.
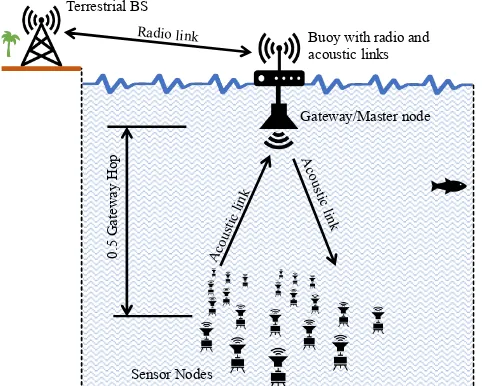
Detailed discussion on CFDAMA can be found in [2], [16], [17]. CFDAMA combines two capacity assignment strategies: free assignment and demand assignment. The major advantage of the CFDAMA protocol is that it exploits the effectiveness of demand assignment in achieving high channel utilisation and the contention-less nature of free assignment with a minimum end-to-end delay close to the minimum bound of a 0.5 gateway hop. A gateway hop relates to a transmission from a sensor node to the gateway and back down to the sensor nodes again, equivalent to one round trip as shown in Fig. 1.
A. CFDAMA SCHEDULING ALGORITHM
Sensor Nodes
Gateway/Master node
Aco ust
ic l ink
A cou
stic l ink
Terrestrial BS
Buoy with radio and acoustic links Radio link
0.
5
G
at
ew
ay
H
[image:4.576.38.279.62.255.2]op
FIGURE 1. An example of centralised UASN
scheduling as for instance used in [7], [8], [18]. Fig. 1 illustrates an example of a centralised UASN. The node near the sea surface is called master node or gateway and should incorporate a high-speed connection to the terrestrial world. Nodes that are deployed at greater depths are the sensor nodes. CFDAMA scheduling is performed using two serving tables operating at the gateway. They are known as the free assignment table and the reservation request table. The cycle starts when a request is made. Allocation of both types of slots (free and demand) is done on a frame-by-frame basis. The global scheduler informs all sensor nodes of their allocations in a Time Division Multiplex (TDM) fashion on the forward frame. Slots are initially assigned using the demand assigned mode, according to the entries in the reservation request table. Once all requests waiting in the queue have been dealt with, the scheduler then switches to free assignment mode and starts to freely assign slots to the remaining nodes in a round robin fashion. This is made by assigning individual free assigned slots, one after another, to the nodes whose IDs are, at that moment, waiting at the top of the free assignment table. Following each slot allocation, each served node-ID is dropped to the bottom of the table. This approach maintains fairness between nodes. Likewise, each time a node is allocated a set of successive demand assigned slots based on the number requested, its ID is also moved to the tail of the free assignment table.
B. CFDAMA FRAME STRUCTURES
To implement CFDAMA, two frame structures are needed, i.e. forward frame (from the gateway to the sensor nodes) and return frame (from the sensor nodes to the gateway). Both frames are made up of two segments: a data slot segment plus a segment of request slots in the case of the return frame. Whereas, in the case of the forward frame, they are a segment of acknowledgement slots plus an optional data slot segment (if required [14]). Data slots are allocated to nodes either as
free assigned slots (F) or demand assigned slots (D). Request packets are transmitted in the request slots on the return frame, and are subsequently acknowledged in the acknowl-edgement slots of the forward frame. The forward frame is delayed with respect to the return frame by a period long enough to allow the request packets that are received in the return frame to be immediately processed and acknowledged with assignments in the following forward frame. Request slots can be accessed using different strategies based on the CFDAMA variant used, for example, a round robin strategy for the CFDAMA-RR scheme [19]. The exact frame formats depend on which CFDAMA variant used.
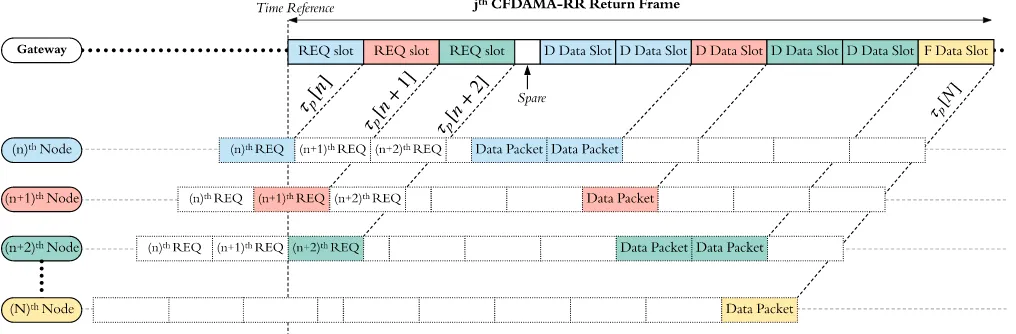
Fig. 2 illustrates an arbitrary transmission cycle in a ran-domly selected jth
return frame of CFDAMA-RR. In this example, based on round robin turns on a frame-by-frame basis, the turn at this instant is for the nth
, (n+ 1)th
and
(n + 2)th
nodes to make requests. As the figure shows, CFDAMA-RR devotes a region located at the start of the
Algorithm 1CFDAMA algorithm implemented at the
gate-way,NRS= Number of requested slots by a node,T ab1=the
free assignment table, T ab2= the reservation request table,
F= free slot,D= demand slot, j= pointer.
1: forevery return framedo
2: update T ab2 based on new requests arrived during
return frame(j)
3: whileavailable slots in forward frame (j)6=0do 4: ifT ab2is not emptythen
5: in forward frame (j) assignNRS D slots to 1 st
node inT ab2
6: remove this entry id fromT ab2 7: move this entry id to tail ofT ab1
8: else
9: assign 1F slot to the node whose id is at the top ofT ab1
10: move this entry to tail ofT ab1
11: end if
12: end while
13: end for
Algorithm 2CFDAMA algorithm implemented at each
sen-sor node,NPQ= number of packets queued,NOR= number
of outstanding requests,NGS= number of granted data slots 1: forevery forward framedo
2: if(NGS 6= 0)in forward frame(j)then 3: read due time of granted slots
4: scheduleNGStransmissions as appropriate
5: end if
6: ifa request slot is due in return frame (j+1)then 7: countNPQandNOR
8: NRS=NPQ−NOR
9: make a request ofNRSslots in return frame(j+1)
10: end if
FIGURE 2. An arbitrary CFDAMA-RR return frame with some allocations
return frame to round robin request slots. In this instance, the sensor node can make a request, if required, and the number of slots to be requested by a node is given by:
NRS=NPQ−NOR (1)
where NRS is the number of requested slots, NPQ is the
number of queued packets and NOR is the number of
out-standing requests. The illustrated example also shows that these nodes are transmitting data packets according to allo-cated D and F slots acknowledged in the(j−1)th
forward frame. Algorithms 1 and 2 outline the implementation of this CFDAMA-RR cycle. Furthermore, with reference to Fig. 2, each node is responsible for aligning the arrival of its packet with the beginning of its allocated slot referenced at the gateway by transmitting the packet τp[n] seconds prior to
the due time of the allocated slot. τp[n] is the propagation
delay between the nth
sensor node and the gateway. For practical synchronisation guard intervals can also be added as appropriate in case of node clock/location drift. Nodes must synchronise their built-in clocks with the master node’s clock. In practice, propagation delays need to be estimated in order to attain this synchronisation. Typically, this estimation of the long and time-variant propagation delay of acoustic waves is dealt with using a handshake technique [7] as often as required. Spare capacity is inserted in both frames to make their lengths equal for simplicity.
III. CFDAMA WITH SYSTEMATIC ROUND ROBIN REQUESTS (CFDAMA-SRR)
CFDAMA with Round Robin requests (CFDAMA-RR) was originally designed to get around the limitations of the Ran-dom Access (RA), Packet Accompanied (PA) and Combined Request (CR) request strategies [16], [17], and to maintain unbiased access rights for all nodes. This section intro-duces our new CFDAMA variant, CFDAMA-SRR, which has CFDAMA-RR as its underlying strategy.
A. CFDAMA WITH ROUND ROBIN REQUESTS (CFDAMA-RR)
To maintain fairness between nodes in accessing the channel, the CFDAMA-RR scheme eliminates the possibility of losing the channel due to contention between nodes or channel domination by transmitting nodes [19]. CFDAMA-RR uses the round robin technique to assign request slots to individual nodes. Therefore, nodes are not inhibited by other nodes from making requests, which means the scheme is contention less.
a: Drawbacks of CFDAMA-RR
Under certain conditions, CFDAMA-RR may have draw-backs some of which are summarised as follows:
• Its delay performance is heavily dependent on the
num-ber of nodes; gaining access to the channel becomes less regular as the number of nodes increases.
• The likelihood of wasting free assigned slots granted to
nodes that have no data to send at the instance of a free slot arrival. This is not specific to CFDAMA-RR, but it is most likely to happen with it.
• Its delay performance also relies on the number of
request slots per frame. A large number of request slots can lead to unreasonably high overhead and low throughput performance.
B. CFDAMA WITH SYSTEMATIC ROUND ROBIN REQUESTS (CFDAMA-SRR)
For the sake of improving the performance of CFDAMA-RR [19], the correlation between the round-trip delayτrand the
type of granted transmission slot needs investigating. Each successfully received packet must have gone through one of three possible scenarios:
• Scenario 1: in which the packet gets through by the use
of a free assigned slot.
• Scenario 2: in which the packet gets through by the
v v
!"#$%&
!#'(
0.5 ,#[n]
,-$($
.'
./&0
.
1
2
3
4
(5
67893: 9(5
current return frame Next return frame
̅
G
CFDAMA Scheduler
[image:6.576.44.271.63.230.2]!-$($
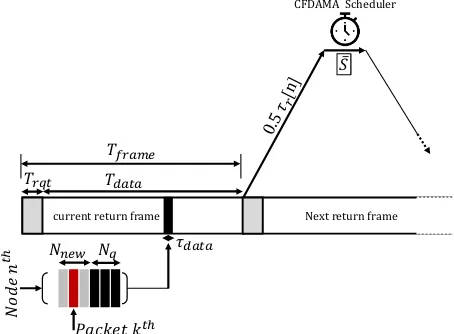
FIGURE 3. Systematic Round Robin Timing
• Scenario 3: in which the packet gets through by the use
of a due reserved slot, i.e. its own requested slot. With reference to Fig. 3, and by considering an arbitrary nth
node and the case where there are Nnew new packet
arrivals in the current CFDAMA frame, we will find the expectation through which scenario the arbitrarykth
packet will be transmitted. For simplicity the data slot durationτdata
is used as a time unit in the following discussion. Each particular node can have one request slot per a CFDAMA frame. The duration of CFDAMA frame is denoted byTframe
and is given by:
Tframe =Tdata+Trqt (2)
whereTrqtis the total duration of request slots in the frame
and Tdata is the total duration of data slots in the frame.
WhenTdata ≫ Trqt, which is usually the case for low frame
overheads, then Tframe ≈ Tdata. In every CFDAMA frame,
there will be two possibilities of the kth
packet arrival: arriving within the round-trip delay denoted by τr[n] time
slots or arriving after it. We will assume that on average the Nnew new packet arrivals happen uniformly within a
CFDAMA frame, which containsTframetime-slots, and thus,
the expected number of new packets withinτr[n]is given by:
x=lNnewτr[n]
Tframe
m
(3)
Therefore, if1< k < x, called constraintC1in the following
discussion, then the three packet escaping scenarios (defined above) could be possible. However, ifx < k < Nnew, called
constraint C2 in the following discussion, then Scenario 2
will be impossible as there will be no undue requested slots left. If C2 is satisfied, the tagged packet arrives after τr[n]
time-slots, and thus, will have to be granted either a free assigned slot (Scenario 1) which also must occur afterτr[n]
time-slots or wait for its own requested slot (Scenario 3). It is sensible to assume that the only way that the kth
packet escapes is via Scenario 3 when kexceeds a certain threshold. At high offered traffic levels, there must be a
number of old packetsNqfrom previous CFDAMA frame(s)
waiting in the node’s queue (Nq > 0). Thus, the certain
threshold is(a+b), which is the maximum total number of free-assigned slots granted to thenth
node during the interval of (τr[n] +Tframe + ¯S), where b represents the maximum
number of free-assigned slots granted to a node during the interval ofτr[n]time-slots, and forN number of nodes, it is
given by:
b=lτr[n]
N
m
(4)
arepresents the maximum number of free-assigned slots in a CFDAMA frame. In other words, the approximation can be made here is that if Nq +k > a, called constraintC3
in the following discussion, the only way thekth
packet es-capes is through its due demand requested slot (Scenario 3). Assuming k∆ is the expected instant of arrival of the kth
packet, the packet needs to wait for(τr[n] +Tframe+ ¯S−k∆)
slots in order to be granted its own demand-assignment slot. Since τr[n] is typically large underwater,S¯ is insignificant
compared toτr, on average the expected instant of the packet
arrivalk∆can be close toTframe/2, andTframeis comparable
to τr, this waiting interval can be approximated to γτr[n],
whereγ≈1.5is a constant.
During the intervalγτr[n], there are:⌈γτr[n]/N(1−d)⌉
free-assigned slots available for the taggednth
node, where
(1−d)is the fraction of free-assigned slots in a CFDAMA frame. This indicates that there will be a relatively large number of free-assignment slots available to use and that the number increases with τr[n]. The assumption that ought to
be made now is that if [(Nq+k) < ⌈γτr[n]/N(1−d)⌉],
called constraint C4 in the following discussion, then the
kth
packet will certainly escape through a free-assigned slot (Scenario 1). This event occurs more frequently whenτr[n]
is large because the fraction of demand-assigned slots (d) in a CFDAMA frame is also reduced. Subsequently, thekth
packet will also have more opportunities to escape using an undue requested slot (Scenario 2).
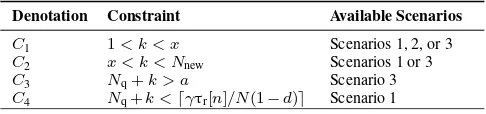
Considering Equations (3) and (4) and constraints (C1,C2,
C3andC4) summarised in Table 1, the round-trip delayτr[n]
has a significant impact on determining the scenario through which a packet will be transmitted. More specificity, τr[n]
will affect the transition from free assignment to demand assignment, and hence, the delay/utilisation performance. This transition will also depend on the position of the new packet in the node’s queue with respect to the intervalτr[n].
Due to long propagation delays and sensor nodes that are typ-ically located at different distances from the central gateway, implementing the CFDAMA-RR strategy without a form of location-based arrangement will cause the scheme to miss an opportunity of even better performance. For the reader’s reference, Table III lists the mathematical terms used in this section.
a: CFDAMA-SRR Solution
Satisfying the constraintC4 will depend not only onτr but
TABLE 1. List of Constraints
Denotation Constraint Available Scenarios
C1 1< k < x Scenarios 1, 2, or 3
C2 x < k < Nnew Scenarios 1 or 3
C3 Nq+k > a Scenario 3
C4 Nq+k <⌈γτr[n]/N(1−d)⌉ Scenario 1
behaviour of data traffic. They will be instantaneously de-termining the term (k+Nq)in the constraintC4.
Satisfy-ing constraint C4 means plenty of free assigned slots will
be available. Nodes that are located farther away from the gateway will allow their new packets to have a higher chance to satisfy the constraint C4 than the nodes that are located
closer. The closer nodes will actually have a higher chance that their newly arrived packets will satisfy the constraintC3,
and hence, have to wait for at least the period ofτrto obtain
a slot. IfC3is satisfied and there are not enough request slots
in the frame, newly arriving packets will have to wait for multiple frames before a capacity request can be made for them.
Given the above, this paper introduces a new variant of CFDAMA-RR, namely CFDAMA-SRR. The new scheme works the same way as CFDAMA-RR does, described in Section II, except for the fact that the round robin algorithm works with respect to the location of sensor nodes. The nodes make their capacity requests not only in a round robin fashion but also in a location-based manner with respect to the location of their centralised scheduling node. Opportunities to make a request are given successively to adjacent nodes one after another, starting from the centre to the edge of the network. CFDAMA-SRR can reduce the possibility that C3 is satisfied and boost the possibility thatC4 is satisfied.
At high channel loads, this new scheme can maximise the use of each single request opportunity leading to enhanced delay/utilisation performance. When a node makes a single request for more than one slot, a run of successive slots is then allocated allowing back to back packet transmissions. Subse-quently, the end-to-end delay of back to back packet trans-missions is determined by the inter-arrival time of packet generations with respect to the data slot duration. CFDAMA-SRR systematises the distribution of request opportunities which works in favour of the utilisation of a single request rather than multiple requests for the same demand. It also allows more time for those nodes located further away from the gateway to maximise the use of an increased number of free assigned slots owing to their longer round trips.
C. CFDAMA-SRR DELAY ANALYSIS
[image:7.576.299.534.74.310.2]In order to gain useful insights, this section provides an analytical approach to evaluating the average end-to-end de-lay performance of CFDAMA-SRR. This approach follows similar steps to the derivation used in [20] to model the performance of a CFDAMA variant of a small number of terminals for satellite systems. However, the assumptions made for underwater scenarios are different. Packets make
TABLE 2. List of Mathematical Terms
Term Description
N Number of nodes
Tframe CFDAMA frame duration
Tdata Total data slots duration in a frame
Trqt Total request slots duration in a frame τdata data slot duration
τrqt data slot duration
τr[n] Round-trip delay ofnthnode
τp[n] propagation delay betweennthnode and gateway
Nq Number of old packets
k Packet’s order in node’s queue
n Node’s pointer
Nnew Number of newly arrived packets
x Random variable = number of new packets inτr
a Number of free slots in CFDAMA frame
b Number of free slots duringτr
d Fraction of demand assignment in CFDAMA frame
γ Constant
λ Packet arrival rate per nodes
Λ System packet arrival rate
E(Q) Expected queueing delay
η A ratioN/τr
¯
T Waiting and service time
¯
Tr Average propagation delay
¯
D Overall CFDAMA mean delay
Bernoulli attempts continually until they get through either as Scenario 1, Scenario 2 or Scenario 3 described in Subsec-tion (B). The average end-to-end delay of packets will depend on the scenario it goes through. The analytical approach here is to evaluate the average delay a tagged kth
packet would experience based on the probability of each of the three scenarios.
In UASNs the packets end-to-end delay is heavily domi-nated by both the propagation delay and the number of sensor nodes in the network. Therefore, the claim this section will fulfil is that the CFDAMA average waiting and service time can be modelled as a M/G/1 queue when the round-trip delays are long. Packet transmissions will be dominated by Scenario 1 and the round robin free assignment scheme will be in operation most of the time when the round-trip delays are long. The following analysis steps will lead to obtaining the approximated mean and variance values of the waiting and service time. Plugging in these values in the Pollaczek-Khinchin formula [21] of the M/G/1queue will result the total waiting and service time. Finally, the average end-to-end delay of packets can be calculated using this waiting and service time plus the average propagation delay. With respect to the CFDAMA-SRR frame illustrated in Fig. 3, the frame hasTframetimeslots whereTframeis proportional to the
total number of sensor nodes N. The frame size and data slot size can be chosen based on the desired throughput and transmission rate in a given underwater scenario. For conve-nience in the following discussion, the time-slot durationτdata
is used as the time unit. For example, the round-trip delay is denoted by τr time-slots. For a Poisson data traffic source,
frame is given by [20]:
Pr{Nnew}=
e−λTframeλNnew Nnew!
(5)
where λ = Λ/N is the arrival rate per time slot at each node.Λis the network packets arrival rate per time slot. The beginning of the CFDAMA frame is defined to be the time origin. If a node’s queue (at this instance) is not empty, it can send a request to the CFDAMA scheduler at the beginning of the next frame. The expected instant of arrival of the first due demand-assigned slot(s) is:
Y =τr[n] + ¯S+Tframe (6)
whereS¯is queueing delay in the demand-assignment table of the scheduler, to be addressed later. The average period be-tween two successive free assigned slots to a particular node isN/(1−d), where(1−d)is the fraction of free assigned slots in a CFDAMA frame (table 2 summarises mathematical terms). Provided that the free-assignment strategy is round robin. Therefore, the probability that a packet at the front of the node’s queue escapes by a free assigned slot (scenario 1) is:
p=
(
(1−d)/N non−empty queue
2(1−d)/N empty queue (7)
By considering an arbitrary kth
packet of the Nnew new
arriving packets at a tagged randomnth
node in the current CFDAMA frame, one of two potential cases the arriving packet will go through, defined as follows:
• when the node queue is empty, i.e.Nq= 0 • when there are old packets queued up, i.e.Nq>0
In the underwater scenarios some assumptions can be made, as shown later, which means precise calculation of these probabilities is not required in this discussion. The sched-uler queue delay S¯ is generally negligible compared with the round-trip delay. Thus, the general unconditional mean queuing delay is:
E(D) = Tframe
X
Nq=0
PNqE(D|Nq) (8)
The computations of the kth
packet delay using Equa-tion (8) become tedious ask increases. To reduce the com-putational complexity, some of the constraints from the dis-cussion of Section III-B can be used. If the constraint C3
(Nq+k > a) is satisfied, then the only way the packet escapes
is via its due demand assigned slot (Scenario 3). The expected end-to-end delay in this case will be equivalent to demand-assignment theoretical delay and given by the following:
E(Dk|Nnew, Nq, Nq+k > a) =Tframe+τr[n]+ ¯S−k∆ (9)
As described in subsection III-B, during this waiting inter-val there are[γτr[n]/N(1−d)]free-assigned slots available
for the taggednth
node. This shows that the number of free-assignment slots will depend on τr and N. To reflect on
the effect of both the long round-trip delays and number of UASNs nodes on the performance of CFDAMA-SRR underwater, a normalisation parameter is introduced to the analysis. It is denoted byηand defined as the ratio between the two parameters Nτslot/τr, i.e. η = Nτslot/τr. By
plug-gingηin the former expression ([γτr/N(1−d)]), the number
of available free-assignment slots will be[γ(1−d)/η]. Asη decreases, the benefits of free-assignment slots are increased. With respect to the constraintC2 andC4 from the previous
section, ifx < k < Nnew, then Scenario 2 will be impossible
as the tagged packet cannot be transmitted via an undue requested slot, and if[(Nq +k) < [γ(1−d)/η]] then the
kth
packet will certainly escape through a free-assigned slot (Scenario 1). These two constraints will be satisfied more frequently when η ≪ 1 (i.e.τr ≫ Nτslot). Therefore,
the average service time that the kth
packet will take when it reaches the head of the node’s queue will rely mainly on Scenarios (1 and 3) and can be expressed as :
E(Q)≈ Ω
X
i=1
p(1−p)i−Nnew
i+ [1− Ω
X
i=1
p(1−p)i−Nnew ][Ω]
(10) The first term in (10) represents the delay of thekth
packet when transmitted as Scenario 1 and the second term gives the delay of thekth
packet when transmitted as Scenario 3, andpis given by expression (8). The Equation (10) can be simplified to:
E(Q) = [1−(1−p) Ω+1]
p −(Ω + 1)(1−p)
Ω+ Ω(1−p)Ω
(11) whereΩis a constant given by:
Ω =⌈γτr⌉, andp=1−d
N =
(1−d)γ ηΩ
For (Ω ≫ 1), as it is typically the case with underwater scenarios due to the largeτr, E(Q) can be simplified to:
E(Q)≈ (1−e− ν
)
p (12)
whereν = (1−d)γ/η. This simplification is based on the relatione−ν
≈(1−(ν/Ω))Ω. For small values ofη,dwill
be small, and as a result, theνvalue will be reactively large. Thus, e−ν
≪ 1. For example when η and d < 0.1, e−ν
will be less than1.4x10−6which is negligible. This suggests
that for a smallη, i.e. long round-trip delaysτr, the average
service time of a packet at the head of the node’s queue is approximated as:
E(Q) = 1
p= N
(1−d) ≈N f or d≪1 (13)
Hence, the mean value and the variance of the service time areN andN(N −1)in respectively. Plugging in the mean and variant values in the Pollaczek-Khinchin formula will result in the total waiting and service time as follows:
¯
T =N+λN(N−1)
Transmission Delay Receiver
Group
Closure Channel
Match Tx Antenna
Gain Prop. Delay (BELLHOP)
Rx Antenna Gain
Rx Power (Thorp Model)
Ambient
Noise Interference
SNR
BER AllocationError
Error Correction
[image:9.576.83.488.58.171.2]Receiver Transmitter
FIGURE 4. Underwater Acoustic Network Channel in Riverbed Modeller [14]
where λ is the arrival rate per node in packets/slot, i.e. equivalent to Erlangs [22]. The average packet end-to-end delay can then be given by:
¯
D= ¯T+ ¯Tr (15)
whereT¯ris the packets average propagating delay ofNnodes
and can be obtained from:
¯
Tr= N
X
n=1 γτr[n]
N (16)
Fig. 7, Fig. 8 and Fig. 9 illustrate a good agreement between the simulation and analytical results using Equation (15). The results have been obtained for various underwater scenarios and CFDAMA parameters which are detailed in Section IV.
IV. SIMULATION SET-UP AND DISCUSSION
Riverbed Modeller (RM) [23] has been used to develop a sim-ulator of the underwater scenarios described in this section. To reflect on the propagation of acoustic waves underwater, RM follows the stages shown in Fig. 4. This section provides the details.
A. SPEED OF SOUND UNDERWATER
The speed of sound through water is a fundamental property of acoustic communication channels and is the dominant bottleneck of the overall network performance. The sound speed is a function of a number of underwater environmental parameters e.g. the temperature, pressure and salinity of the water, and hence, it is variable in space and time [24]. The propagation speed of sound underwater near the surface grad-ually decreases because the temperature decreases rapidly but the pressure remains more or less the same. After that, it reaches a point where it is minimal after which the tem-perature stays constant but the pressure increases causing the sound speed to increase very slowly. This means sound sig-nals (rays) will follow curved paths which will be different to the Euclidean distances. For a realistic Sound Speed Profile (SSP) as used in [7], Fig. 5 depicts a case derived by Dushaw [25] from the 2009 World Ocean Atlas temperature, pressure and salinity data at(56.5o
N,11.5o
W)in April, i.e. around the North Atlantic Ocean off the coast of the UK and Ireland. The SSP caused refraction of the propagated acoustic rays, which in turn results in curved trajectories. These trajectory
traces have been extracted using the BELLHOP ray tracing program [26] and accurate propagation delays have been obtained.
B. UNDERWATER ACOUSTIC CHANNEL MODEL
[image:9.576.300.548.520.706.2]A vector containing the actual values of node-to-node prop-agation delays based on the SSP depicted in Fig. 5 have been extracted from BELLHOP and imported into RM. An empirical model [27] is used to predict the underwater am-bient noise based on channel bandwidth given in table 3. The Thorp model [28] is used to calculate the absorption coefficient in order to be used to estimate the received power. Based on these parameters, the signal to noise ratio (SNR) experienced by each transmitted packet is evaluated, and subsequently, the Bit Error Rate (BER) is estimated to determine the packet’s eligibility for successful reception at its receiver. This BER is not the empirical rate of bit errors, but rather the expected rate based on a look-up table and the corresponding SNR value. The RM counts the number of bit errors in each packet and maintains a bit-error accumulator. The acceptability test of a packet at the receiver is based on both the interference between packets as well as the proportion of bit errors due to noise. If a non-zero-length packet overlap between successive packet arrivals is detected,
the receiver rejects all packets involved in the overlap. If the number of bit errors in a packet exceeds a certain threshold, the receiver rejects the packet.
C. DATA TRAFFIC CHARACTERISTICS
Poisson data traffic is a traditional traffic model that has been for decades the first choice for evaluating communication protocol performance. The main feature of this model is that the inter-arrival times between packets can be modelled as independent exponentially distributed random events at each source. In spite of some arguments made in a number of studies claiming that the Poisson model is not suitable for many applications, e.g. [29], [30], it is still widely used for simulation-based studies as a tool allowing comparison with relatively tractable theoretical analysis. This applies also to UASNs, e.g. [10], [11], [12]. Many UASN applications can be characterised by periodic data traffic models, particularly for applications associated with environmental monitoring tasks [7]. In such tasks, the network is configured in a way that every node transmits a packet periodically containing a sensor reading to a base station or a gateway node, e.g. [31]. In [13], it is found that statistics of data traffic generated by event-based wireless sensor applications are found to obey the Pareto ON/OFF distribution very well. Two distinct traffic models (Poisson OFF and Pareto ON/OFF) have been developed in RM for the evaluation of CFDAMA-SRR per-formance in this paper.
D. NETWORK TOPOLOGY AND SIMULATION PARAMETERS
With reference to Fig. 1, different scenarios of 3 different network sizes (20, 50 and 100 nodes) and several packet durations have been studied. Sensor nodes are distributed randomly across a coverage area of 6 ×6 km, using the RM simulator with a centralised gateway at a 20m depth just above the central point of the coverage area. The depths of sensor nodes obey a uniform random distribution and are located between 470 and 490 m. The selection of these parameters corresponds to a typical oil reservoir seismic monitoring scenario, e.g. [32]. They have been chosen to be within the range of operating parameters of current commer-cial modems. For example, but not limited to, the EvoLogics S2CR 15/27 modem [33]. The trade-off between CFDAMA parameters has been assessed. These scenarios can provide a range of different test options for performance evaluation of the CFDAMA schemes or comparison with other approaches in the literature. The simulation parameters are listed in Table IV. Using given data slot duration (τdata), request slot
duration (τrqt), number of data slots (Nds) and number of
request slots (Nrs), one can obtainTframe from Equation (2),
which can be rewritten with respect to the aforementioned parameters as follows:
[image:10.576.299.537.74.194.2]Tframe=Ndsτdata+Nrsτrqt (17)
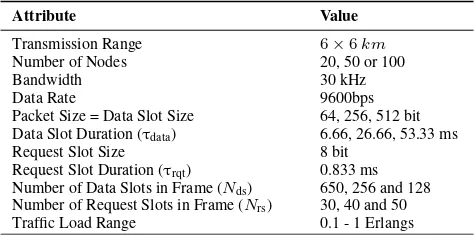
TABLE 3. Simulation Parameters
Attribute Value
Transmission Range 6×6km
Number of Nodes 20, 50 or 100
Bandwidth 30 kHz
Data Rate 9600bps
Packet Size = Data Slot Size 64, 256, 512 bit
Data Slot Duration (τdata) 6.66, 26.66, 53.33 ms
Request Slot Size 8 bit
Request Slot Duration (τrqt) 0.833 ms
Number of Data Slots in Frame (Nds) 650, 256 and 128 Number of Request Slots in Frame (Nrs) 30, 40 and 50
Traffic Load Range 0.1 - 1 Erlangs
V. ANALYSIS OF THE RESULTS
To enable the full realisation of the effectiveness of CFDAMA-SRR, the scheme has been simulated and inves-tigated in detail. Comparisons with CFDAMA-RR, round robin free assignment, demand assignment and with the ana-lytical model given in Equation (15) are shown in this section. Comparison with the STUMP protocol [8] is also provided in this section. In all the results presented, channel load is measured in Erlangs and represented as a fraction of the transmitted data. The channel is loaded up to its maximum useful data carrying capacity.
A. COMPARATIVE PERFORMANCE OF CFDAMA-SRR
Fig. 6 shows the mean end-to-end delay performance against a variety of channel loads ranging from 0.1 to 1 Erlang and based on both Poisson and Pareto ON/OFF traffic models. The graphs shown in the figure are for CFDAMA-SRR while the other variants of CFDAMA with different request strategies are shown later. The results show that like other CFDAMA variants, the CFDAMA-SRR scheme consistently outperforms its two constituent schemes (free and demand assignment) in both mean end-to-end delay and channel utilisation. The reason behind this is the nature of CFDAMA mechanism in general which is more adaptive to the variation in channel conditions; it exploits the advantages of its two underlying schemes based on the instantaneous value of channel load.
0 0.1 0.2 0.3 0.4 0.5 0.6 0.7 0.8 Offered Load in Erlang
0 10 20 30 40 50 60 70 80 90
End-to-End Delay in sec
[image:11.576.45.271.61.230.2]SRR Poisson RR Poisson SRR Pareto RR Pareto Free Assig. Poisson Demand Assig. Poisson Free Assig. Pareto Demand Assig. Pareto
FIGURE 6. Comparative delay/utilisation performance of CFDAMA-SRR vs. Round Robin Free assignment vs. Demand assignment with 100 nodes
0 0.1 0.2 0.3 0.4 0.5 0.6 0.7 0.8 0.9
Offered Load in Erlang
0 5 10 15 20 25 30 35 40 45 50
End-to-End Delay in sec
[image:11.576.305.531.62.230.2]SRR Poisson RR Poisson SRR Pareto RR Pareto STUMP Poisson Theoretical mean
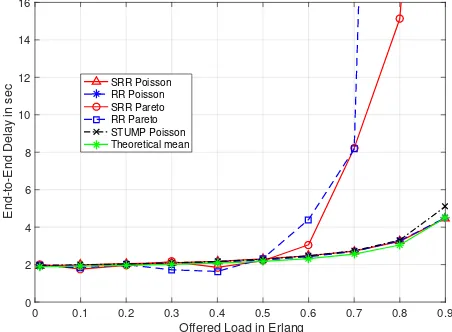
FIGURE 7. Comparative delay/utilisation performance of CFDAMA-SRR vs. CFDAMA-RR vs. STUMP with 20 nodes
traffic, the scenario is different where several packets could arrive between successive free slot allocations in some cases. Above 50% of channel capacity, the end-to-end delay is much higher with the Pareto ON-OFF traffic because of the greater burstiness of the ON-OFF data traffic. This is because of the statistics of Pareto ON/OFF data traffic which produce a longer period of time during which the number of nodes generating bursts exceeds a certain sustainable number. If a long burst of packets is generated from a Pareto ON/OFF source, a substantial number of packets would start to build up in the node’s queue. This will then result in significant demand by this node and subsequent slot allocation. It means the node will dominate the return frame for a significant period of time. All this will eventually cause a dramatic increase in the mean end-to-end delay at very high channel loads. A key point to note from these results is that despite the significantly longer burstiness of the Pareto ON/OFF traffic compared with traditional Poisson, the CFDAMA-SRR scheme is still capable of providing good end-to-end delay performance up to 90% of channel capacity.
0 0.1 0.2 0.3 0.4 0.5 0.6 0.7 0.8 0.9
Offered Load in Erlang
0 10 20 30 40 50 60
End-to-End Delay in sec
[image:11.576.45.268.272.441.2]SRR Poisson RR Poisson SRR Pareto RR Pareto STUMP Poisson Theoretical mean
FIGURE 8. Comparative delay/utilisation performance of CFDAMA-SRR vs. CFDAMA-RR vs. STUMP with 50 nodes
0 0.1 0.2 0.3 0.4 0.5 0.6 0.7 0.8 0.9
Offered Load in Erlang
0 2 4 6 8 10 12 14 16
End-to-End Delay in sec
SRR Poisson RR Poisson SRR Pareto RR Pareto STUMP Poisson Theoretical mean
FIGURE 9. Comparative delay/utilisation performance of CFDAMA-SRR vs. CFDAMA-RR vs. STUMP with 100 nodes
a: SRR vs. RR
[image:11.576.305.531.273.439.2]• The scheme has a bias against transmissions associated
with long round-trip demand assigned slots. The queu-ing time is correlated to the node location. Nodes that are located further from the gateway will have more availability of queued packets. Far nodes will also be able to efficiently exploit their request opportunities, and hence, the farther away the node is, the larger num-ber of packets will be served in a request opportunity.
• It allows those nodes which are located closer to the
gateway to make their requests first rather than poten-tially waiting for multiple CFDAMA frames. In the meantime, it allows more time for those nodes which are located further away from the gateway to maximise the use of the available free assigned slots rather than wasting them.
• For the same two reasons above, the likelihood of
wast-ing free assigned slots in some cases due to the potential absence of queued packets at sensor nodes is very low.
b: SRR vs. STUMP
STUMP represents an excellent TDMA-based solution in terms of throughput by transmitting data packets without MAC overhead. It achieves high utilisation by exploiting node location diversity to overlap node transmissions and enable ordered packet arrivals. However, its delay/utilisation performance dependent on the accuracy of its ordering al-gorithm. Also, it does not have a mechanism to respond to individual node requirements. Its waiting and service time increases as the value of channel load increases.
Fig. 7, Fig. 8 and Fig. 9 indicate that in virtually all cases both schemes perform similarly. The reason behind this similarity in performance is the limited burstiness of the Poisson traffic that cannot offer substantial demands for an excessive period of time long enough to enable demand assigned slots to contribute effectively. In contrast, free as-signed slots in this instance can contribute more effectively to support the transmission of independently generated pack-ets. The overhead of CFDAMA-SRR is negligible in these scenarios owing to long CFDAMA frames. With moderate channel loads, all data slots in the CFDAMA return frame are freely assigned, and hence, the resulting delay/utilisation performance is independent of the request strategy. At high offered load values and 100 nodes, CFDAMA-SRR has a small advantage over STUMP in terms of end-to-end delay. This is attributable to the increased demand made for packets having exponential inter-arrival time, and the fact that the TDMA slots assigned periodically by STUMP cannot be as effective as the on-demand slots assigned by CFDAMA-SRR at such high load levels. At a high channel load of 90%, the mean end-to-end delays are around 4.5 s with CFDAMA-SRR, and 5.1 s with STUMP.
B. PERFORMANCE OF CFDAMA-SRR WITH DIFFERENT PARAMETERS
a: Request Strategy
Fig. 10 illustrates the delay/utilisation performance of CF-DAMA with Poisson modelled traffic and different request strategies. It can be seen that choice of request strategy has a small effect on the performance over some parts of the offered load range, becoming clearer at high channel loads with Pareto ON/OFF traffic whose results are shown in the opposite figure - Fig. 11. Considering the results in Fig. 11 obtained with Pareto ON-OFF traffic source, it can be seen that the SRR strategy exhibits superior delay/utilisation performance at high channel loads to its substructure - the RR strategy. This is primarily attributable to the fact that CFDAMA-SRR limits the chances of wasting free assigned slots and also biases against demand assigned slots associated with long round-trip delays.
Moreover in Fig. 11, at high channel loads, the end-to-end delay rises rapidly and CFDAMA with both request strategies becomes less effective under Pareto ON/OFF model when the channel is loaded beyond 80% of its capacity. Despite the long burstiness and high channel load, the CFDAMA-SRR scheme is still able to provide acceptable utilisation performance up to 85% of channel capacity. Results in both figures (Fig. 10 and Fig. 11 ) also show that other request strategies (PA and CR) are also outperformed by SRR with Pareto ON/OFF model. In the PA strategy, a small number of nodes hog the channel, which inhibits other nodes from mak-ing strongly needed requests. The CR strategy overcomes this issue by combining PA with the RA strategy but still cannot outperform SRR. The CFDAMA-SRR scheme with Pareto ON/OFF traffic has a mean end-to-end delay of around 14 s at channel load of 80% whereas it is above 40 s with the RR scheme.
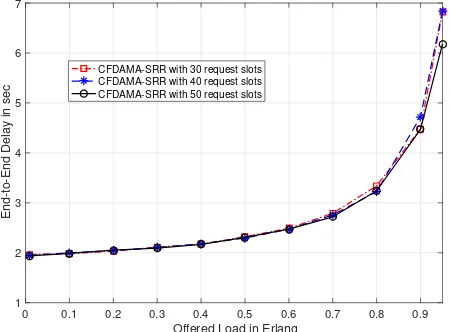
Considering different numbers of request slots for the CFDAMA-SRR schemes, Fig. 12 and Fig. 13 show the delay/utilisation performance with both Poisson and Pareto ON/OFF respectively. It can be seen that changing the num-ber of request slots has almost no noticeable impact on the delay performance at low and medium channel loads with either traffic model.
b: Number of Request Slots
0 0.1 0.2 0.3 0.4 0.5 0.6 0.7 0.8 0.9 Offered Load in Erlang
1 2 3 4 5 6 7
End-to-End Delay in sec
[image:13.576.45.270.61.228.2]CFDAMA-SRR CFDAMA-RR CFDAMA-PA CFDAMA-CR
FIGURE 10. CFDAMA-SRR with different request strategies and Poisson traffic condition
0 0.1 0.2 0.3 0.4 0.5 0.6 0.7 0.8 0.9
Offered Load in Erlang 0
5 10 15 20 25 30 35 40
End-to-End Delay in sec
[image:13.576.305.533.63.229.2]CFDAMA-SRR CFDAMA-RR CFDAMA-PA CFDAMA-CR
FIGURE 11. CFDAMA-SRR with different request strategies and Pareto ON/OFF condition
0 0.1 0.2 0.3 0.4 0.5 0.6 0.7 0.8 0.9
Offered Load in Erlang
1 2 3 4 5 6 7
End-to-End Delay in sec
CFDAMA-SRR with 30 request slots CFDAMA-SRR with 40 request slots CFDAMA-SRR with 50 request slots
FIGURE 12. CFDAMA-SRR with different number of request slots and Poisson traffic condition
slots resulted in longer delays and inferior channel utilisation at high channel loads with Pareto ON/OFF traffic.
0 0.1 0.2 0.3 0.4 0.5 0.6 0.7 0.8 0.9
Offered Load in Erlang
0 5 10 15 20 25 30 35 40
End-to-End Delay in sec
[image:13.576.46.270.270.437.2]CFDAMA-SRR with 30 request slots CFDAMA-SRR with 40 request slots CFDAMA-SRR with 50 request slots
FIGURE 13. CFDAMA-SRR with different number of request slots and Pareto ON/OFF condition
0 0.1 0.2 0.3 0.4 0.5 0.6 0.7 0.8 0.9
Offered Load in Erlang
0 5 10 15 20 25 30 35 40
End-to-End Delay in sec
CFDAMA-SRR, with 64b-bit packets CFDAMA-SRR, with 256-bit packets CFDAMA-SRR, with 512-bit packets
FIGURE 14. CFDAMA-SRR with different packet lengths and Poisson traffic condition
0 0.1 0.2 0.3 0.4 0.5 0.6 0.7 0.8 0.9
Offered Load in Erlang
0 10 20 30 40 50 60 70 80 90 100
End-to-End Delay in sec
CFDAMA-SRR, with 64b-bit packets CFDAMA-SRR, with 256-bit packets CFDAMA-SRR, with 512-bit packets
FIGURE 15. CFDAMA-SRR with different packet lengths and Pareto ON/OFF condition
c: Data Packet Size
[image:13.576.305.531.271.436.2] [image:13.576.45.270.478.644.2] [image:13.576.305.531.479.644.2]0 0.1 0.2 0.3 0.4 0.5 0.6 0.7 0.8 0.9 1 End-to-End Delay normalised by round trip
0 10 20 30 40 50 60 70 80 90
Probability %
[image:14.576.46.273.62.230.2]CFDAMA-RR, with Pareto traffic CFDAMA-SRR, with Pareto traffic CFDAMA-RR, with Poisson traffic CFDAMA-SRR, with Poisson traffic
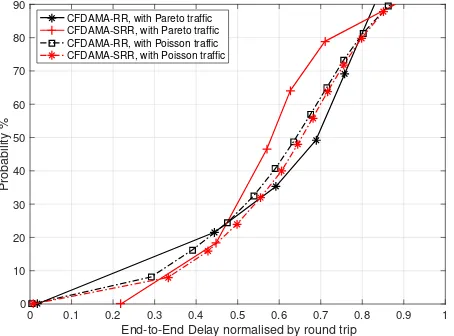
FIGURE 16. Cumulative Distribution Function at 30% offered load, 650 of 64-bit data slots and 50 of 8-bit request slots per frame
and Pareto ON/OFF traffic models respectively. The scheme performs better with short packets. This is attributable to the low data rate used, which is the typical date rate of underwater models. Long packets demand long slots in a CFDAMA frame, and long slots can make it less regular for slots to be freely assigned as the free slots are assigned using a round robin method. This increases the average end-to-end delay for long packets transmission. The resulting delay/utilisation characteristics with Pareto ON-OFF traffic are more sensitive to the packet size than the characteristics resulted with Poisson traffic model. These results put further emphasis on the notion that it is the periodic ON-OFF nature of the self-similar traffic model that is behind most of the performance differential to Poisson traffic. Unlike with Pois-son traffic source, the CFDAMA-SRR delay performance with Pareto ON-OFF traffic source and 1024-bit packets experienced a degradation. This is due to the heavy tail of the Pareto distribution with a high probability of long ON or OFF periods when such long packets are used.
C. END-TO-END DELAY DISTRIBUTION
Fig. 16 and Fig. 17 show the Cumulative Distribution Func-tion of the end-to-end delay (normalised by the average length of round trips) of all packet transmissions for the two strategies (SRR and RR) with 100 nodes and the two traffic types (Poisson and Pareto ON/OFF) at both 30% and 60% load values. For the same reasons explained above, the superiority of SRR is particularly manifested at high channel loads with Pareto ON-OFF traffic. At the 30% offered load value, 90% of packets with both traffic models do not exceed the boundary of a round trip. This indicates all the packets are transmitted via free assigned slots. At the 60% offered load value, 35% of RR packets with Pareto ON/OFF experience longer delays than a round trip, whereas 85% of SRR packets do not exceed the boundary of a round trip. With Poisson traffic, both strategies perform similarly and allow 90% of packets to arrive at the destination within a round-trip time.
0 0.2 0.4 0.6 0.8 1 1.2 1.4 1.6 1.8 2 End-to-End Delay normalised by round trip
0 10 20 30 40 50 60 70 80 90
Probability %
CFDAMA-RR, with Pareto traffic CFDAMA-SRR, with Pareto traffic CFDAMA-RR, with Poisson traffic CFDAMA-SRR, with Poisson traffic
FIGURE 17. Cumulative Distribution Function at 60% offered load, 650 of 64-bit data slots and 50 of 8-bit request slots per frame
VI. CONCLUSION
This paper has shown that the CFDAMA protocol offers excellent performance in dealing with the trade-off between end-to-end packet delays and channel utilisation with both Poisson and Pareto ON/OFF data traffic types through simu-lated underwater scenarios. The major advantage of the CF-DAMA protocol is the fact that it exploits the contention-less nature of free assignment and the effectiveness of demand assignment in achieving high channel utilisation efficiency. At low channel loads, the free assignment strategy provides end-to-end delays closer to the minimum bound of a 0.5 gateway hop. At high channel loads, the free assignment strategy becomes less effective, whereas the demand assign-ment strategy starts to dominate CFDAMA operations sup-porting higher channel utilisation. A new CFDAMA variant, namely CFDAMA-SRR, more suitable for the underwater environment has been proposed. It incorporates round robin request strategy but in a systematic way, to draw on the advantages of CFDAMA-RR. Simulation results show that CFDAMA-SRR is able to provide superior delay/utilisation performance than any other request strategy, with consistent throughput and stable end-to-end delay performance for a wide range of scenarios. With data rates up to 10 kbit/s and with 20, 50 and 100 nodes over a large coverage area, CFDAMA-SRR makes it possible to load the channel up to very high levels of its capacity with a delay performance less than that achievable with CFDAMA-RR. At a high channel load of 80%, the mean end-to-end delay of CFDAMA-SRR is less than 3 s with Poisson and 15 s with Pareto ON/OFF.
REFERENCES
[1] E. Felemban, F. K. Shaikh, U. M. Qureshi, A. A. Sheikh, and S. B. Qaisar, “Underwater sensor network applications: A comprehensive survey,” In-ternational Journal of Distributed Sensor Networks, vol. 11, no. 11, p. 896832, 2015.
[image:14.576.305.533.62.230.2][3] H. S. Dol, P. Casari, T. van der Zwan, and R. Otnes, “Software-defined underwater acoustic modems: Historical review and the nilus approach,” IEEE Journal of Oceanic Engineering, vol. 42, no. 3, pp. 722–737, July 2017.
[4] I. F. Akyildiz, D. Pompili, and T. Melodia, “Underwater acoustic sensor networks: research challenges,” Ad Hoc Networks, vol. 3, no. 3, pp. 257– 279, 2005.
[5] J. Heidemann, M. Stojanovic, and M. Zorzi, “Underwater sensor networks: applications, advances and challenges,” Phil. Trans. R. Soc. A, vol. 370, no. 1958, pp. 158–175, 2012.
[6] E. M. Sozer, M. Stojanovic, and J. G. Proakis, “Underwater acoustic networks,” IEEE JOE, vol. 25, no. 1, pp. 72–83, 2000.
[7] N. Morozs, P. Mitchell, and Y. V. Zakharov, “Tda-mac: Tdma without clock synchronization in underwater acoustic networks,” IEEE Access, vol. 6, pp. 1091–1108, 2018.
[8] K. Kredo II, P. Djukic, and P. Mohapatra, “Stump: Exploiting position diversity in the staggered tdma underwater mac protocol,” in INFOCOM. IEEE, 2009, pp. 2961–2965.
[9] T. Le-Ngoc and J. I. Mohammed, “Combined free/demand assignment multiple access (cfdama) protocols for packet satellite communications,” in Universal Personal Communications, 1993. Personal Communications: Gateway to the 21st Century. Conference Record., 2nd International Con-ference on, vol. 2. IEEE, 1993, pp. 824–828.
[10] A. A. Syed, W. Ye, and J. Heidemann, “Comparison and evaluation of the t-lohi mac for underwater acoustic sensor networks,” IEEE Journal on Selected Areas in Communications, vol. 26, no. 9, 2008.
[11] W.-H. Liao and C.-C. Huang, “Sf-mac: A spatially fair mac protocol for underwater acoustic sensor networks,” IEEE Sensors Journal, vol. 12, no. 6, pp. 1686–1694, 2012.
[12] C. Li, Y. Xu, C. Xu, Z. An, B. Diao, and X. Li, “Dtmac: A delay tolerant mac protocol for underwater wireless sensor networks,” IEEE Sensors Journal, vol. 16, no. 11, pp. 4137–4146, 2016.
[13] Q. Wang, “Traffic analysis & modeling in wireless sensor networks and their applications on network optimization and anomaly detection,” Net-work Protocols and Algorithms, vol. 2, no. 1, pp. 74–92, 2010.
[14] W. Gorma, P. Mitchell, and Y. Zakharov, “Cfdama-is: Mac protocol for underwater acoustic sensor networks,” in International Conference on Broadband Communications, Networks and Systems. Springer, 2018, pp. 191–200.
[15] M. B. Porter, “The bellhop manual and user’s guide: Preliminary draft,” Heat, Light, and Sound Research, Inc., La Jolla, CA, USA, Tech. Rep, 2011.
[16] P. D. Mitchell, D. Grace, and T. C. Tozer, “Performance of the combined free/demand assignment multiple access protocol with combined request strategies via satellite,” in Personal, Indoor and Mobile Radio Communi-cations, 12th IEEE International Symposium on, vol. 2. IEEE, 2001, pp. 90–94.
[17] P. Mitchell, T. Tozer, and D. Grace, “Improved medium access control for data traffic via satellite using the cfdama protocol,” IET Conference Proceedings, pp. 18–18, January 2000.
[18] A. A. Syed, W. Ye, and J. Heidemann, “Comparison and evaluation of the t-lohi mac for underwater acoustic sensor networks,” IEEE Journal on Selected Areas in Communications, vol. 26, no. 9, 2008.
[19] P. D. Mitchell, D. Grace, and T. C. Tozer, “Comparative performance of the cfdama protocol via satellite with various terminal request strategies,” in GLOBECOM. IEEE Global Telecommunications Conference (Cat. No. 01CH37270), vol. 4. IEEE, 2001, pp. 2720–2724.
[20] T. LE-NGOC and S. Krishnamurthy, “Performance of combined free/demand assignment multiple-access schemes in satellite communica-tions,” International Journal of Satellite Communications, vol. 14, no. 1, pp. 11–21, 1996.
[21] W. Chan, T.-C. Lu, and R.-J. Chen, “Pollaczek-khinchin formula for the m/g/1 queue in discrete time with vacations,” IEE Proceedings-Computers and Digital Techniques, vol. 144, no. 4, pp. 222–226, 1997.
[22] T. S. Rappaport et al., Wireless communications: principles and practice. prentice hall PTR New Jersey, 1996, vol. 2.
[23] I. Hammoodi, B. Stewart, A. Kocian, and S. McMeekin, “A comprehensive performance study of opnet modeler for zigbee wireless sensor networks,” in Next Generation Mobile Applications. NGMAST’09. 3rd Intern. Conf, 2009, pp. 357–362.
[24] W. D. Wilson, “Speed of sound in sea water as a function of temperature, pressure, and salinity,” The Journal of the Acoustical Society of America, vol. 32, no. 6, pp. 641–644, 1960.
[25] B. Dushaw., “Worldwide sound speed, temperature, salinity, and buoyancy from the noaa world ocean atlas.” Available: http://staff.washington.edu/dushaw/WOA/, 2009.
[26] M. Porter., “Acoustics toolbox,” Available:
http://oalib.hlsresearch.com/Modes/AcousticsToolbox/, 2017, Sep. [27] M. Stojanovic, “On the relationship between capacity and distance in an
underwater acoustic communication channel,” ACM SIGMOBILE Mobile Computing and Communications Review, vol. 11, no. 4, pp. 34–43, 2007. [28] W. H. Thorp, “Deep-ocean sound attenuation in the sub-and low-kilocycle-per-second region,” The Journal of the Acoustical Society of America, vol. 38, no. 4, pp. 648–654, 1965.
[29] V. Paxson and S. Floyd, “Wide area traffic: the failure of poisson mod-eling,” IEEE/ACM Transactions on Networking (ToN), vol. 3, no. 3, pp. 226–244, 1995.
[30] W. E. Leland, M. S. Taqqu, W. Willinger, and D. V. Wilson, “On the self-similar nature of ethernet traffic (extended version),” IEEE/ACM Transactions on Networking (ToN), vol. 2, no. 1, pp. 1–15, 1994. [31] A. Mainwaring, D. Culler, J. Polastre, R. Szewczyk, and J. Anderson,
“Wireless sensor networks for habitat monitoring,” in Proceedings of the 1st ACM international workshop on Wireless sensor networks and applications. Acm, 2002, pp. 88–97.
[32] A. K. Mohapatra, N. Gautam, and R. L. Gibson, “Combined routing and node replacement in energy-efficient underwater sensor networks for seismic monitoring,” IEEE Journal of Oceanic Engineering, vol. 38, no. 1, pp. 80–90, 2013.
[33] C. Petrioli, R. Petroccia, J. Shusta, and L. Freitag, “From underwater simulation to at-sea testing using the ns-2 network simulator,” in IEEE OCEANS 2011. IEEE, 2011, pp. 1–9.
WAEL GORMA received the B.Sc. degree in
electrical engineering from the University of Mis-urata, in 2008, and the M.Sc. degree in electronic engineering from both the Nottingham Trent Uni-versity, and College of Industrial Technology (CIT), in 2012. He has held lecturing positions for 2 years at CIT and others. He is currently a PhD student in the Communication Technologies Research Group at the Electronic Engineering De-partment, University of York, working on medium access control for underwater acoustic sensor networks. His research in-terests include multiple-access and medium access control and sharing for wireless radio and acoustic sensor networks in extreme environments.
PAUL D. MITCHELL (M’00-SM’09) received
NILS MOROZS (S’13-M’17) received the M.Eng. and Ph.D. degrees in electronic engineer-ing from the University of York, in 2012 and 2015, respectively. His Ph.D. research was part of the EU FP7 ABSOLUTE project where he developed LTE-compliant dynamic spectrum access methods for disaster relief and temporary event networks. Afterwards, he worked as Researcher in Wi-Fi and wireless convergence at BT in Martlesham, UK, and as Research Associate in the area of HAP-based communications at the Department of Electronic Engineering (EE), University of York. He is currently Research Associate at the Department of EE, University of York, working on channel modelling and medium access control for underwater acoustic sensor networks as part of the EP-SRC USMART project (EP/P017975/1). His research interests include the development of protocols and architectures for wireless radio and acoustic networks.
YURIY V. ZAKHAROV (M’01) received the
![FIGURE 5. Example of an SSP in the North Atlantic Ocean [7]](https://thumb-us.123doks.com/thumbv2/123dok_us/1841475.140438/9.576.300.548.520.706/figure-example-ssp-north-atlantic-ocean.webp)