Int. J. Electrochem. Sci., 11 (2016) 10296 – 10305, doi: 10.20964/2016.12.55
International Journal of
ELECTROCHEMICAL
SCIENCE
www.electrochemsci.orgShort Communication
Generalized Simulation Model of Nanostructure Self-Formation
Process by Anodic Oxidization of Aluminum and Titanium
Alexey N. Belov1,*, Vasily I. Shevyakov1, Alexander V. Solnyshkin1,2, Maxim I. Vorobiev1
1 Department of Intellectual Technical Systems, National Research University “MIET”, Moscow,
Zelenograd, 124498, Russia
2
Department of Condensed Matter Physics, Tver State University, Tver, 170100, Russia
*
E-mail: [email protected]
Received: 10 September 2016 / Accepted: 11 October 2016 / Published: 10 November 2016
The computer simulation results of physicochemical process of nanopore formation in aluminum and titanium oxides are presented in this paper. The model based on an electric field distribution in an electrochemical cell takes into account oxide formation and dissolution reactions on metal-oxide and oxide-electrolyte boundaries, respectively. Such an approach allows to describe geometric characteristics dependences of the nanostructured oxide layers on electrophysical and chemical parameters throughout the formation process. The experimental results confirm the proposed model validity.
Keywords: nanoporous metal oxide, self-formation, simulation
1. INTRODUCTION
Physical model of the initial stage of pore nucleation and evolution on the aluminum film surface in view of the presence of the natural oxide film was proposed in [6]. According to this model, the porous oxide growth was caused by simultaneous electrochemical oxidation at the oxide-metal boundary and dissolution of the electrolyte at the interface oxide. The authors suggested that defects of natural oxide film are caused by defect structure of the aluminum surface (edge dislocations, grain boundaries, etc.). The electrochemical dissolution rate for defect surface regions differed from the one for defectless regions. An ion current induced both growth and electrochemical dissolution of oxide film over the aluminum surface, but the dissolution process in defective regions occurred in a radial direction to form cavities. The porous oxide growth was characterized by not only changing the pore radius and depth, but also the interaction of pores and their ordering.
Along with the development of physical concepts, it was attempted theoretical modeling of the process formation of porous aluminum oxide. Authors in [7] proposed a theoretical model based on the Lorenz equation and the ratio of the actual density of aluminum and is in oxide. The simultaneous occurrence of the aluminum oxide formation and etching was taken into account. Both interfaces of the oxide-electrolyte and metal-oxide were permanently moved. This model allowed to calculate the geometric parameters of the nonporous oxide formed in different process conditions.
In papers [8-9], two-dimensional surfaces z f (x, y) were used to describe the interfaces of the oxide-metal and oxide-electrolyte. Thus, all equations were solved for a two-dimensional grid. Such a method of model presentation of the bulk phases and the interfaces imposed serious restrictions on the dynamics of the system in modeling the anodic oxidation process. These limitations were noticeable for the phase interface changes due to the irregularities which were not represented on a height grid (for example, growth of dendrites during crystallization or micropore nets developed in the etching material).
As opposed to the nanoporous aluminum oxide formation, the first mention of porous anodic titanium oxide self-organization was relatively new [10]. This topic was successfully developed by P. Schmuki and colleagues [11-12]. As of today, there are a number of approaches to the description of the self-organization mechanism of the porous titanium oxide layer [13]. However, there are no model concepts of the process.
In this work, we propose a generalized model describing the evolution process of complex interfaces during the anodic oxidization of aluminum and titanium. This model takes into account the features of electrolytes used for the porous oxide formation. The proposed model considers drift and diffusion of electrolyte ions under an electric field in the liquid and solid phases, the dependence of the activation energy of the reactions on the local electric field strength, and the presence of the electrical double layer at the interface of the solid and liquid phases. These numerical simulations are compared with experimental results obtained by the anodic oxidation of aluminum and titanium.
2. EXPERIMENT
be 2 bH 2 O M O bH
aM 2 a b
. (…)
The structure and properties of the anodic oxide films obtained from the reaction (…) are defined by character of the chemical interaction between the oxide and electrolyte.
An electrochemical formation of stable porous titanium oxide layers is carried out using ammonium fluoride solution in non-polar solvents such as ethylene glycol. It was found a small amount of water added to the solution strongly influences the kinetics of the electrochemical formation process and the layer geometry. During the anodic oxidation in such a system, two processes may predominantly occur: electrochemical formation of titanium oxide and its chemical dissolution by the products of ammonium fluoride dissociation in water. At the pH range from 1 to 7, HF, ions (HF2)–
and F– are present in the electrolyte [13] and it is possible the following reaction [20]
H TiO x OH Ti x OH Ti xOH Ti O H TiF H F TiO O H TiF H HF TiO H O H TiF HF TiO e 4 ) ( ) ( 2 ) ( 4 6 2 ) ( ) ( 3 2 2 ) ( 6 2 4 2 2 6 2 2 2 6 2 2 2 2 6 2 (…)
Titanium oxide is formed on the metal interface. Oxide dissolution occurs on the oxide-electrolyte boundary.
The formation process of porous aluminum oxide becomes apparent in self-organization of the porous structure. Some aspects of this complex process are not yet fully clarified. For example, it is not clear what kind of anion (O2– or OH–) prevails during the anodic process as the oxygen transport. On the one hand, OH– ions are generated by cathodic reduction or dissociation of water with dissolving the oxygen
2 2
2H O 2e 2OHH
2 2
2H O O 4e 4OH
On the other hand, O2– ions may be generated at the electrolyte-oxide interface by the dissociation of OH– or water as well as the H+ adsorption by the electrolyte ions.
Aluminum ionization leads to an amorphous layer formation in accordance with
2 2 3
2Al 3H O Al O 6H6e
2 3 2
2Al 6OH Al O 3H O 6e
2
2 3
2Al 3O Al O 6e In this case hydrogen is liberated at the cathode
2
6H6e 3H .
The pore formation is related to the electrochemical dissolution:
3
2 3 2
2Al O 12H6e 2Al 6H O, at which the hydrogen ionization occurs
2
3H 6H6e.
move to the anode. The thickness of the porous oxide film is a function of the current density and the anodization time.
For simulation of the porous oxide formation and comparison of the calculation results and the experimental data, a particular mode of anodic oxidation was selected as the number of its electrochemical parameters was used for the simulation. The mode of anodic oxidation was galvanostatic. It provided the oxide nanostructure formation with high reproducibility of geometrical parameters. The oxidizing process of titanium foil (99 % purity) was carried out in the fluorine containing electrolytes of 0.08 M NH4F in ethylene glycol (pH 6.2) with a water content of 2.5 and
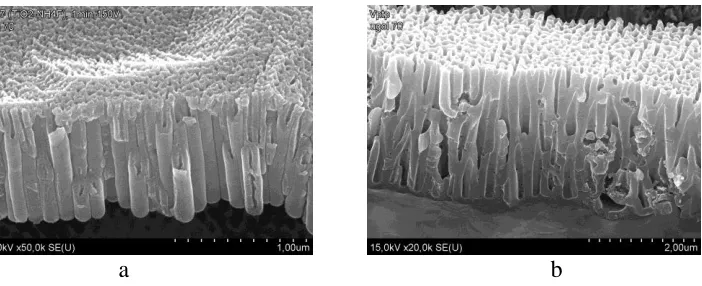
10 vol.% at temperature of 293 K and a current density of 3 mA/cm2 [14]. The anodic oxidation of aluminum foil (99 % purity) at a current density of 10 mA/cm2 was carried out in a mixture of 0.1 M phosphoric acid at temperature of 293 K. [15]. The oxidization was carried out for 30 minutes. Fig. 1 shows the SEM micrographs of oxide nanostructures.
[image:4.596.128.479.300.443.2]
a b
Figure 1. Cross section micrographs of titanium (a) and aluminum (b) oxide nanostructures.
As one can see form Fig.1, in both cases the pores were formed throughout the oxide layer depth and separated from the metal by the barrier layer. The structure of the porous layers of the anode metal oxide is an array of close-packed cells. There is the vertical pore in the cell center. The pore lateral size was nearly equal to 50 nm for titanium dioxide and 150 nm of aluminum oxide for the same period of the structure. In both cases, the pore structures were hexagonally ordered.
3. MODEL
The potential distributions in the oxide and the double layer adjacent to the oxide-electrolyte interface can be presented as follows [16]
0
(into the oxide), (1a)T k Ie
B r 0
2
2 2
(into the double layer), (1b)
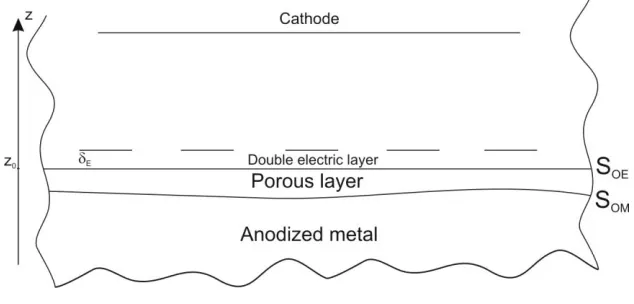
[image:5.596.140.457.245.397.2]where 0 is the vacuum permittivity, εr the dielectric constant of the electrolyte, e the electron charge, kB the Boltzmann's constant, T the temperature is equal to 293 K for all experiments in heat stabilized, the same temperature was used in all presented simulation results.
Figure 2. Electrochemical cell scheme.
The boundary conditions for the metal oxide surfaces (SOM) and oxide electrolyte (SOE) are a at the SOM interface,
s at the SOE interface, c 0 at the cathode, a c V.
where a is anode potential, s the oxide surface potential depending on the local irregularities on the anodic oxide surface, c the cathode potential, V the voltage applied to the anode and cathode, I the ionic strength of electrolyte, the local electrical conductivity. Since there is not long-range order in the anodic oxide layer, the oxide local conductivity in the first approximation may be assumed isotropic and depended on the local electric field strength (E) [17]
0
sinh( )
( ) , ( , , , )
p E
E E E x y z t
p E
(2)
here
T k
ve p
B
, is the activation length [18].
The electrolyte ionic strength in all stages of electrolyte component dissociation of is given by
i i iz
C
I 2
2 1
where Ci is the molar concentrations of the ions, zi the ion charges. The concentration of each ion type is expressed by the molar concentration and the dissociation constant. A detailed derivation of the oxide surface potential is presented in [19]. The formula for s is
0 2 2 ) , ( , ] [ 2 z y x z h h h V E E s
(4)where h is the height of a point relative to the local average baseline of the tangent plane to the surface z0, E the double electric layer thickness (Fig. 2).
The authors [9] showed that the anode current density might be used to determine the reaction rate of the oxide dissolution on the oxide-electrolyte interface in a direction normal to the surface from the solid phase to the liquid. By using a suitable reaction rate the concentration change for the system components during the time may be presented in generlized form
i OM o i i i i OE d i i i OX E k C B E k C A t C expexp , (5)
where COX is the oxide molar concentration, kid and Ai the kinetic constants of oxide
dissolution reactions due to interaction of anions and neutral molecules with molar concentration Ci [7], EOE and EOM the electric field strengths on the SOE and SOM interfaces respectively, kio and Bi the
kinetic constants of oxide formation reactions during the metal oxidation on the SOM interface.
The metal oxidation rate on the SOM interface (normal to the surface and directed from a metal to oxide) depends on a concentration of ions involved in the metal oxidation reactions
i OM o i i i Me E k C B t Cexp (6) where CMe is the metal molar concentration.
The ions drift due to an electric field and their diffusion can be described by the Nernst-Plank equation
i B i i i i i C T k D q C D t C ) ( 2 (7)where Di is the diffusion coefficient in the electrolyte, qi the ionic charge (equal to zero for undissociated electrolyte components).
For simulation of aluminum anodizing process using equations (1), (3), (6, 7), the following boundary conditions are considered taking into account the presence of oxygen, hydrogen and hydroxyl ions
OE
O OH O OH O B
O C M k E
T k
e
C
2 2
2
2 exp
2
2
at the SOE interface,
pH OH
C
14
10 at the SOE interface,
0 0 2 t O
C at the SOM interface,
pH t
OH
C
14
where 2 O OH
M and
2
O OH
k are the kinetic constants of the decomposition reaction of hydroxyl ions on the SOE interface, pH the electrolyte acidity.
To simulate the anodizing titanium process in the electrolyte based on fluoric acid, the presence of acid undissociated ions and products incomplete dissociation (HF2, F and OH– hydroxyl ions) is taken into account. The boundary conditions are following
,
,
,
,
0 0 0 0 2 2
OH z OH F z F HF z HF HF z HFС
C
С
C
С
C
С
C
0
2
F OH
HF
HF
C
C
C
C
at the SOE interface,where CHF0 ,
0
2
HF
C
,C
F0 and0
OH
C are reactant equilibrium concentrations. According to [20], these concentrations without an electric field may be presented as follows
, 10 , 16 . 3 3 1 ] log[ ] log[ , 72 . 2 ] log[ 2 ] log[ 14 0 0 0 0 0 2 pH OH HF F HF HF С pH C C pH C C
here PH and CHF0 depend on an electrolyte composition.
Besides the pore formation in the anodic oxide layers, the process of separation into individual nanotubes is observed. In our opinion, this is due to the structure stress which affects the activation energy of the reactions. Alternative hypotheses of the interwalled space dissolution in porous oxide cells are proposed in [21-22]. In the proposed model, these processes are not taken into account. Main attention is given to the processes of pore nucleation and evolution which are presented in the equations.
Simulated part of the electrolyte volume and anode in the electrochemical reactor is described by a system of identical cells close-packed in hexahedral manner and oriented along the principal axes of the simulated volume. The component concentrations (for metal ions, fluorine, hydrogen and hydroxyl ions) in the system are matched each cell. This model presentation of the system allows to reproduce the interface complex geometry required accuracy that is determined by the unit cell volume. Moreover, such a presentation is convenient in terms of computational efficiency since it is well suited for calculations on parallel stream processors, where operations with bulk grids are hardware accelerated. For simulation, the volume of 2048 cells in three dimensions (a cell volume of 0.5 nm3 each) was used and the model time step was 0.05 ms, thus ensuring the stability of integrable equations and the simulation reasonable time.
basic axes. This feature is especially useful for a calculation of any variables in extreme cells of the modeled volume.
The equation describing the potential distribution in the oxide was solved by the iteration method. The equation describing the potential distribution in the electric double layer was solved as a system of linear algebraic equations with D-L-U decomposition and the subsequent upper relaxation. [23].
Heights of scanned pattern of the metal foils obtained by scanning probe microscopy in atomic force mode were used as initial data for the numerical simulation. The values of heights at each discrete point were converted into the original three-dimensional network of the simulated cells. In the model, the main parameters (unit cell size of the simulated volume, the time step and the number of iterations for each step) are kept constant in view of a model sensitivity selected due to the numerical scheme. Also, the geometric parameters of the porous structure, the morphology of which could not be reproduced for large amounts of cells, were natural limits of the unit cell volume. In describing the processes of diffusion and drift under an electric field, the mobility and diffusion coefficients were chosen constant due to the thermal stabilization of the reaction zone.
4. RESULTS AND DISCUSSION
a
b
c
d
[image:8.596.34.561.363.719.2]
Fig. 3 shows the results of numerical simulation of the self-organization process in the porous anodic metal oxides. It is seen from the presented data that the simulation results are in good agreement with experiment. According to experimental data, nanoporous oxide structures of a characteristic thickness of 0.7-0.8 m and a pore diameter of 50-70 nm are generated by the titanium and aluminum anodic oxidation under conditions mentioned above. In this paper, special cases of the self-organization of porous structures of titanium and aluminum oxides are shown in the Figures 1 and 3. However, the proposed approach allows to simulate this process in a wide range of electrophysical factors and the chemical activity of fluorine-containing electrolytes.
The physicochemical model of pore formation processes during anodic oxidation of aluminum and titanium presented in this paper enables to describe the evolution of complex surfaces. The electric field in the electrochemical cell is distributed in all directions. This imposes restrictions on the models presented in papers [8, 9] and [19] where the surfaces (x, y) and (x, z), respectively, are considered. Moreover, the concentrations of H+ and OH–, which determines pH of the electrolyte solution, are taken into account in the present model. As opposed to aluminum oxide, fluorine-containing ions are involved in the local electrochemical dissolution of titanium oxide that is also taken into account in our model. We believe that it will allow to simulate the pore formation processes during the oxidation of the other valve metals (Ta, Nb, Zr, etc.). Modeling the anodic oxidation of different metals (Al and Ti) was attempted in work [24], but there are no data on the surface evolution under electric fields.
Assuming the cell size used in the model corresponds to the lattice parameter of aluminum and titanium oxides, the model calculation shows a dependence of the geometric parameters (size and shape) on the physical and chemical process conditions. The developed model makes it possible to describe the lateral dimension dependence of the porous oxide nanostructures on the applied electric field and the electrolyte composition. It allows to qualitatively estimate the dynamics of pore nucleation and evolution despite a number of significant assumptions.
ACKNOWLEDGMENTS
This work was supported by the Russian Scientific Foundation (Grant N 15-19-00138). References
1. Z. Su, W. Zhou, Porous Anodic Metal Oxides // Science Foundation in China 16 (2008) 36-53 2. I.N. Frantsevich, Anodnye oksidnye pokrytiya na metallakh i anodnaya zashchita (Anodic Oxide
Coatings on Metals and Anodic Protection) / Kiev: Naukova Dumka, (1985) 280 p. (In Russian). 3. G.E. Thompson, G.C. Wood, Nature, 290 (1981) 230.
4. S. Ono, M. Saito, M. Ishiguro, H. Asoh, J. Electrochem. Soc., B151 (2004) 473–478.
5. H. Masuda, H. Yamada, M. Satoh, H. Asoh, M. Nako, T. Tamura, J. Electrochem. Soc., B153 (2006) 566.
6. V.A. Sokol, A.A. Kuraev, A.K. Synicin, and L.M. Grinis, Proc. of Nanomeeting (1999) 280. 7. V. P. Parkhutik, V.I. Shershulsky J. Phys., D25 (1992) 1258.
8. G.K. Singh, A.A. Golovin, I.S. Aranson, Phys. Rev., B 73 (2006) 205422 9. S.K. Thamida, H.C. Chang, Chaos, 12 (2002) 24045.
14.M. I. Vorobiev and A. N. Belov, Nanotech. in Rus.,10 (2015) 681.
15.A.N. Belov, M.I. Vorobiev, S.A. Gavrilov and V.I. Shevyakov, Proc. of SPIE 9440 (2014) 94400Z 16.The Collected Papers of Peter J. W. Debye. New York: Interscience Publishers, Inc. 1954 558 p. 17.L. Young Anodic Oxide Films, Academic Press, London 1961 377 p.
18.J.O’M.Bockris and A.K.N.Reddy, Modern Electrochemistry, Plenum Press, New York, 1970 19.H. Sakaguchi , J. Zhao, Phys. Rev., E 81 (2010) 31603.
20.A.N. Belov, I.M. Gavrilin, S.A. Gavrilov, A.A. Dronov, V.A. Labunov Semicond., 47 (2013) 1707 21.D.I. Petukhov, A.A. Eliseev, I.V. Kolesnik, K.S. Napolskii, A.V. Lukashin, Yu.D. Tretyakov, S.V.
Grigoriev, N.A. Grigorieva, H. Eckerlebe, Micropor. Mesopor. Mat., V114 (2008) 440
22.A. Valota, D.J. LeClere, P. Skeldon, M. Curioni, T. Hashimoto, S. Berger, J. Kunze, P. Schmuki, G.E. Thompson Electrochim. Acta, 54 (2009) 4321.
23.L.G. Stanton, A.A. Golovin, Effect of ion migration on the self-assembly of porous nanostructures in anodic oxides, Phys. Rev., B79 (2006) 035414
24.K.R. Hebert, S.P. Albu, I. Paramasivam, P. Schmuki Nature Mat., 11 (2011) 162