Stimulation of 3D osteogenesis by mesenchymal stem cells via a nanovibrational bioreactor.
P. Monica Tsimbouri1†, Peter G. Childs2†, Gabriel D. Pemberton1†, Jingli Yang1, Vineetha Jayawarna1, Wich Oripiriyakul1, Karl Burgess3, Cristina Gonzalez-Garcia4, Gavin Blackburn3, Dilip Thomas5, Catalina V. Giraldo5, Manus J.P. Biggs5, Adam S.G. Curtis1, Manuel Salmeron-Sanchez4, Stuart Reid2*#, Matthew J. Dalby1*
1Centre for Cell Engineering, Institute for Molecular, Cell and Systems Biology, College of Medical, Veterinary and Life Sciences, University of Glasgow, Glasgow G12 8QQ,
UK.
2SUPA, Institute of Thin Films, Sensors and Imaging, University of the West of Scotland, Paisley PA1 2BE, UK.
3Glasgow Polyomics facility, College of Medical, Veterinary and Life Sciences, University of Glasgow, Wolfson Wohl Cancer Research Centre, Garscube Campus,
Bearsden, G61 1QH, UK.
4Microenvironments for Medicine, Division of Biomedical Engineering, School of Engineering, College of Science and Engineering, University of Glasgow, Glasgow, G12
8QQ, UK.
5Centre for Research in Medical Devices (CÚRAM), National University of Ireland Galway, Ireland.
#Now at SUPA, Department of Biomedical Engineering, Wolfson Centre, Strathclyde University, Glasgow, G4 0NW, UK.
†these authors contributed equally to this work
*corresponding authors [email protected] and
Bone grafts are one of the most commonly transplanted tissues. However, autologous grafts are in short supply, and can be associated with pain and donor-site morbidity. The creation of tissue-engineered bone grafts could help to fulfil clinical demand and provide a crucial resource for drug screening. Here, we show that vibrations of nanoscale amplitude provided by a newly developed bioreactor can differentiate a potential autologous cell source, mesenchymal stem cells (MSCs), into mineralized tissue in 3D. We demonstrate that nanoscale mechanotransduction can stimulate osteogenesis independently of other environmental factors, such as matrix rigidity. We show this by generating mineralized matrix from MSCs seeded in collagen gels with stiffness an order of magnitude below those needed to induce bone formation in vitro. Our approach is scalable and can be compatible with 3D scaffolds.
With an aging population increasing the demand for musculoskeletal surgery, there is
a growing need to provide viable bone grafts for clinical use1. A wide range of surgeries require bone grafts2, whose supply is limited3. Also, they are associated with donor-site morbidity4. Allogeneic decellularized grafts or synthetic ceramic alternatives, although widely accepted as substitutes, suffer from being biologically inferior in vivo
relative to viable bone grafts1, 3.
The creation of appropriate 3D bone mimics would also support a fail-fast, fail-cheap
workflow for the pharmaceutical sector, allowing the rapid prioritization of the best
candidates for in vivo or on-chip testing of drug leads5 for bone-related disorders, such as osteoporosis. A scalable method that does not require soluble factors or
osteoinductive scaffolds to direct differentiation would be advantageous; it would
prevent the confounding effects that arise from the use of differing media
formulations or from the reliance on a limited selection of materials that are typically
highly engineered6-13.
Tissue engineering provides a route to bioengineering bone-like environments, in
which autologous cells with osteogenic potential, such as MSCs, are mineralized
cost-effective osteogenesis without the use of defined media or osteoinductive
scaffolds requires a bioreactor that itself drives osteogenesis14; such a bioreactor would have implications for the pharmaceutical sector and the clinic15.
The designs of currently available bioreactors are complex, often involving unfamiliar
and hard-to-use parts, such as rotary and perfusion chambers and associated tubing.
The creation and use of these parts present major sterility, upscale and cost issues16. It would therefore be advantageous for a new bioreactor to be able to sit in a standard
incubator, consist of a few parts, and to use off-the-shelf cell-culture containers that
are easy to move between the bioreactor and a laminar-flow cabinet.
We have previously used nanoscale vibrational displacements to stimulate
osteogenesis in MSCs cultured on tissue culture plastic in 2D17, 18. This work identified that mechanical stimulation of 1000 Hz frequency with 15-nm vertical displacement
promoted MSC differentiation18. The process was shown to be RhoA kinase (ROCK) dependent, consistent with known mechanisms of MSC osteogenesis in 2D cultures
via increased adhesion-driven cytoskeletal tension18-20.
Multi-sample nanovibrational bioreactor for 2D osteogenesis
In our previous 2D work18 only one sample could be stimulated at a time, and issues existed around vibration transmission, which meant that the nanovibrational setup
was complex and lacked scalability. In our nanovibrational bioreactor, we employed a
reverse piezo effect, where an applied voltage drives nanoscale displacements from
piezo ceramics. The bioreactor design incorporates a 13-piezo array, mounted onto
an aluminium base, directing expansion upwards (Figure 1a). Actuators can be wired
in series or in parallel, with parallel wiring allowing higher vibration amplitudes to be
produced. Mounted above the array is a top plate, which has a surface area capable
of accommodating two 6-well culture plates. This plate is dual-layered, using
aluminium bonded to magnetic stainless steel (Figure 1a). This design provides a
balance of weight, rigidity, and the ability to magnetically couple 6-well plates via
transferred to the 6-well plates, to provide extra rigidity to ensure the consistent
transfer of vibration amplitude across each well, and to facilitate the removal of the
plate when cells need to be fed.
When employing high-frequency vibration, it is important to consider the possibility
of deformation. Using ANSYS finite element analysis (FEA), harmonic response models
at 1000 Hz with 30 nm amplitude predicted: (1) that the bioreactor top plate would
provide rigidity, minimizing average deformation at the nanometre level to 5 nm or
17% (Figure 1b); and (2) that the magnetic attachment of 6-well plates maintains
amplitude accuracy across the growth surfaces (within 3.3 nm (11%) for frequencies
<3600 Hz) (Figure 1c).
Laser interferometry techniques developed for gravitational wave research21 were used to validate FEA simulations. When wired in series, piezo actuators, without a top
plate, gave an average vibration amplitude of 24.7 nm (8.3% accuracy between
actuators - 1000 Hz, 80 Vpk-pk). Across 25 set points (Figure 1d), amplitude
measurement of the top plate demonstrated the plate vibrated at 28.2 nm (11.2%
amplitude consistency). Measurements made with the 6-well plates magnetically
attached to the top plate (Figure 1d) revealed a slight reduction in displacement
amplitude. However, displacement amplitude across multiple wells was shown to be
consistent (21.2% accuracy in the range of 0-3000 Hz (Figure 1e)). Above 4000 Hz, the
amplitudes increased towards a resonant condition (Figure 1e – denoted by large
variance), as predicted by ANSYS (Figure 1c).
To confirm osteogenesis occurs in 2D, MSCs (from human bone marrow) were
stimulated at 1000 Hz (80 Vpk-pk giving a 22 nm vertical displacement)18. While 1000 Hz may seem fast relative to the stimulation parameters employed with traditional
mechanical bioreactors, it is noteworthy that for hydrated bone to be optimally
piezoactive, a kilohertz range (972 Hz) stimulus is required22. Furthermore, research into the effects of nanotopography indicates that feature sizes of 20 nm high are
osteogenic23, 24; this is very close to the 22 nm displacement we use here. After 7 days of MSC culture, quantitative (q)PCR was used to assess the expression of the
expression was observed following nanostimulation (Figure 1f). Furthermore, levels
of the proteins, alkaline phosphatase (ALP) at 14 days and osteopontin (OPN) at 21
days, were assessed in nanostimulated MSCs and compared to mature primary human
osteoblasts using in-cell western analysis. Both the bioreactor-stimulated MSCs and
the osteoblasts produced higher levels of these bone marker proteins relative to
unstimulated MSCs (Figure 1g). These time points were chosen as they map onto
classical osteodifferentiation progression models for transcription factors (osterix),
early stage markers (ALP) and later stage markers (OPN)25.
The 2D paradigm for osteogenesis19, 20, 26 indicates that adhesion-based signalling, including signalling via ROCK18, is important for nanovibration-induced MSC differentiation. However, in 3D systems, cellular mechanoreceptors might also play a
role in MSC osteogenesis. Transient receptor potential (TRP) channels function as
mechanosensors, and TRP channel activation occurs via cytoskeletal linkage27. Two recently discovered mechanosensitive cation channels, called Piezo1 and Piezo228, 29, affect cytoskeletal organization30, 31 when mechanically activated, and render cells mechanosensitive to cell adhesion and/or cytoskeletal strain32. In non-excitable (non-neural) cells, TRP and Piezo channels have been implicated in the transduction of
vibrational force, for example in the stereocillia that signal changes in fluid pressure
in the ear during hearing, indicating the sensitivity of these channels to high frequency
vibration33, 34. In addition, in a mouse model of osteoporosis, the depletion of the channel Trpv1 (TRP vallanoid sub-family 1)35 protected mice against ovariectomy-induced bone loss36.
A wide range of stimulus can activate TRP channels, including mechanical force, as
long as the energy transduction to the channel is sufficient for mechanical gating to
occur37. Thus, we hypothesised a role for these channels in the response of MSCs to nanovibrational stimulation. Currently available inhibitors of Piezo1 (GsMTX4)38 and of TRPV1 (QX314)39, designed for studies of action potential, act transiently. Thus, to measure their effect on nanovibration-induced MSC differentiation, a very early stage
marker of cell response was selected. Mitogen activated protein kinases, such as
extracellular signal-related kinase 1/2 (ERK 1/2), provide a likely marker for the switch
differentiation typified by growth repression through high levels of ERK 1/2 activation
(phosphorylation)41.
Using an MSC seeding protocol, which allows 1 hour for cell attachment in 10% serum,
cells were both stimulated and synchronised at G0 by applying nanovibrations and
serum starvation (1% serum) for 24 hours. After synchronising, cells were released
back into the cell cycle using 10% serum for 23 hours before the addition of GsMTX4
or of QX314 for a further 1 hour (24 hours total). Active, phosphorylated, pERK1/2 was
then assessed relative to total ERK1/2 protein levels using in-cell western analysis. The
inhibition of both the Piezo1 and TRPV1 channels repressed ERK1/2 phosphorylation
in the nanovibration-stimulated cells; no repression was seen in control cultures,
suggesting that these changes were mechanotransduction-driven via Piezo1 and
TRPV1 (Figure 1h). From these results, we hypothesised that channel-based
mechanosensors might be important for the nano-mechanostimulation of MSCs in 3D.
Nanovibration in 3D gel volumes.
The ability to mechanically stimulate cells at the nanoscale in 3D is challenging
because of the requirement to transmit nanoscale cues into 3D volumes. In order to
test this, a 3D biocompatible scaffold that in itself should not initiate osteogenesis was
used; collagen type I42. The gel was set at low elastic modulus as high-modulus gels can confer osteoinductive properties; 40 kPa (notably the stiffness of pre-calcified
bone matrix) has been shown to be osteoinductive to MSCs7, 26, 43-45. Here, we used gels with a bulk elastic moduli of 108 Pa without cells, and with a moduli of 73.5 Pa
at a loading density of 40,000 cells/ml of gel (Supplementary Table 1 and Figure 2a,
2b). Local elastic modulus (as a cell might sense it) was measured using AFM, and
found to be 59 Pa without cells and 62 Pa with cells at a loading density of 40,000
cells/ml (Supplementary Fig 1).
To start to understand if collagen could transmit the nanovibrations, FEA harmonic
response analysis was performed assuming that the 108 Pa collagen gel was within
under strain, the Poisson ratio describes the absolute ratio between transverse and
longitudinal strain. For this analysis, a Poisson ratio, ν, of less than 0.5 was chosen.
Several values for ν were tested for their replication of the interferometric result with
an asymptotic increase towards 0.5 improving the accuracy of the simulation (i.e. the
ability to transmit a full vibration amplitude of 20 nm). The value used also resulted in
a bulk modulus of the same magnitude as water (Supplementary Table 1). The bulk
modulus describes a material’s resistance to uniform compression; such materials
tend to have a high water content, as in the case of collagen gels. Modelling of the
polystyrene container showed it produced minimal deformation (Figure 2d).
Modelling of the gel (at 2.5 ml of gel per well), at 1000 Hz with 20 nm displacement,
predicted an average amplitude of 29 nm at the edge meniscus and 18 nm at the gel
centre (Figure 2e).
Using these same modelling parameters, shear stress and strain within the gel
produced peak values of 3.8 mPa and 1.1 x 10⁻⁴ m/m respectively at 1000 Hz (shear stress is shown in Figure 2f). These values fall within the linear region of the shear
stress-strain plot in Figure 2c (from rheological measurement). This supports the
validity of using a constant elastic modulus value for modelling nanovibration, at this
frequency, since the strains produced are within the linear elastic range of the
material. Hence, the viscoelastic properties of the collagen gel are predicted to allow
the transfer of high frequency vibrations to the cells seeded in 3D.
Interferometry was again used to confirm predictions. The bioreactor was set up with
a 6-well plate and with cells (40,000 MG63 cells/ml –note, MG63 cells were chosen as
they can be used on the interferometer outside of the cell culture laboratory) seeded
within 2.5 ml collagen gels. Measurements were carried out both at the centre and
outer edge of the gels. Amplitude calibration showed that for the frequencies
examined, gel vibration increased linearly with input voltage to the bioreactor (Figure
2h). In terms of frequency, the top surface of the gel was found to follow the surface
of the 6-well plate consistently, showing no dampening of the vibration up to 2000 Hz.
Gel samples that contained cells did not deviate in response from gels without cells
(Figure 2i). Up to 2000 Hz, amplitude appeared to be increased at the edge of the gel
amplitude seen at the edge of the gel was 35 nm compared to 24 nm at the centre for
1000 Hz (Figure 2i – inset).
Resonant frequencies were recorded in the region of 2500, 3500 and 5000 Hz and
were observed in both empty and gel-filled 6-well plates. We also observed an
increase in vibration amplitude at the outer edge of each well when compared to its
centre, together with a decrease in measurement accuracy (Figure 2i). If the gel
volume is doubled to 5 ml, the data indicate that a slight amplitude-dampening effect
occurs, although the gels act similarly in terms of where resonance occurs with
different voltage input, and with respect to middle/edge amplitude changes
(Supplementary Figure 2). Our results also indicate that cells within the 100 Pa gels
should receive predictable and reproducible nanoscale displacements. However, this
gel environment is dramatically different to the hard environment of the plastic cell
culture well (as used to generate Figure 1f & g) or to 40 kPa gels, which have previously
been used to stimulate osteogenesis7, 26, and this presents a significant challenge in terms of achieving osteogenesis.
Nanovibration driven 3D osteogenesis.
To test MSCs for osteogenesis in the 108 Pa collagen gels, a range of viability and
osteo-specific transcriptional, protein and mineralisation assays were performed. In
terms of viability, our analysis showed that MSCs embedded in these gels (referred to
hereafter as 3D) remain viable during nanostimulation (Supplementary Figure 3). To
assay for osteogenesis, qPCR at days 7, 14 and 21 of culture was performed, and
showed increased RUNX2, collagen I, ALP, OPN, osteocalcin (OCN) and bone
morphogenetic protein 2 (BMP2) expression in the nanostimulated MSCS in 3D,
compared to unstimulated MSCs (Figure 3a). In MSCs that were nanostimuled, four of
the six genes above were downregulated at day 21, as the osteogenic process was
transcriptionally completed (Figure 3a). OCN protein levels were also assayed at day
21 and found to be increased following nanostimulation demonstrating progression
To study in vitro mineralisation, we used a combination of von Kossa staining for
phosphate, Raman spectroscopy, and X-ray micro-computed tomography (µCT). Von
Kossa staining indicated that relatively little mineralisation had taken place within
control gels (Figure 3b – images are from 6 weeks of culture). However, following
nanostimulation at 15 nm displacement, significant mineralisation was detected in
MSCs cultured in 3D. Mineralisation levels were higher in these cells than in MSCs
after 4 weeks of culture in osteospecific media (OSM) (Figure 3b). In longer-term, 6
week, culture, MSCs cultured in 3D with OSM caught up and underwent a significant
increase in mineralisation compared to control cells (Figure 3b).
Within the Raman fingerprint region of 500 to 1500 cm-1 (Figure 3c,d,f and Supplementary Figure 5), bovine cortical bone showed a dominant phosphate (PO4
3-v1) peak at 960 cm-1 and a secondary peak at 1072 cm-1,characteristic of substituted carbonate (CO32-) and indicative of the mineral component of bone47, as well as of hydroxyapatite Ca10(PO4)6(OH)2, where CO32- can substitute for OH- and/or PO4 3-(Figure 3c). For MSCs cultured in control gels, a broad, merged peak from 1200 cm-1 was observed (likely due to the large amount of collagen present), and protein-related
contributions from amide I (1595-1720 cm-1) and III (1243 -1269 cm-1) and from CH 2 (1451 cm-1). Significantly, no bone mineral peaks were noted in these cells (Figure 3d) and µCT revealed no mineral deposits (Figure 3e). In nanostimulated MSCs in 3D, two
peaks at 960 cm-1 (PO
43- v1) and 1072 cm-1 (CO32-) were observed (Figure 3f), and µCT showed the accumulation of bone mineral (Figure 3g, Supplementary Table 2).
Together, these findings demonstrate that nanostimulation can drive osteogenesis
and mineralisation in MSCs in an otherwise non-osteogenic 3D environment.
3D nanovibrational stimulus of mechanosensitive channels.
We next tested ion channel sensitivity to 3D nanostimulation in order to relate ion
channel expression to cytoskeletal tension. Temporal qPCR was performed on MSCs
at days 3, 5, 7, 14 and 21 of culture to assay the expression of Piezo 1, Piezo 2, TRPV1
and of potassium channel subfamily K receptor 2 (KCNK2, which is stimulated by
all the channels tested, specifically a bi-phasic high to low expression pattern from day
3 to day 5, recovery to a higer level at days 7-14 to a lowered expression pattern at
day 21, with all channel transcripts significantly downregulated by day 21,
post-osteogenesis (Figure 4a). From our 2D data18 and from the literature on osteospecific differentiation on a range of 2D surfaces19, 20, it could be postulated that intracellular tension should increase during osteogenesis; thus, if the channels were involved in
osteogenesis in 3D, they might be sensitive to tension inhibitors, such as the ROCK
inhibitor (Y27632) and the myosin II inhibitor (blebbistatin).
To test this hypothesis, day 5 was selected as a representative time point for the
downregulation of Piezo 1, Piezo 2 and TRPV1 channel expression (Figure 4a) and, as
we were now investigating a single time point, MSCs from additional donors were
supplemented into the analysis. All three ion channels were downregulated by day 5,
with Piezo 2 being significantly down-regulated. The trend was noted in OSM-treated
cells, but was more pronounced in MSCs subjected to nanostimulation (Figure 4b-e).
Upon addition of Y27632 and blebbistatin, the down-regulation of Piezo 2 expression
was reversed, indicating a relationship exists between this receptor and cellular
tension. This trend was noted in both nanostimulated and OSM-treated cells, but was
more pronounced following nanostimulation (Figure 4c). TRPV1 also showed a
tension-dependant link, increasing in expression with nanostimulation and OSM
treatment following treatment with Y27632. Again, this was more pronounced for
nanostimulated cells, as blebbistatin treatment increased the expression of TRPV1
only in nanostimulated MSCs (Figure 4e).
The effect of actin and ROCK inhibition on early stage (to day 5) osteogenic transcripts
was next investigated in nanostimulated MSCs. BMP2 receptor (BMPR1a) was
differentially regulated in blebbistatin-inhibited MSCs (Figure 4f). The response to
BMP2 is a first step in osteogenesis and it stimulates transcription factors, such as
RUNX2 (the master osteogenic transcription factor, which peaks in expression at day
5-10)25. At this early time point, however, RUNX2 expression was not altered in response to either inhibitor (Figure 4g). ALP, a later stage marker of osteogenesis
14, blebbistatin treatment downregulated the expression of two later stage markers
of osteogenesis, osteonectin (ONN) and OPN (Supplementary Figure 6).
These data support the hypothesis that 3D osteogenesis via nanovibrational
stimulation is a mechanotransductive process that involves intracellular tension, with
mechanoreceptors, such as Piezo, TRP and KCNK, being involved in this process.
However, we note that our results are not as dramatic, in terms of response to
cytoskeletal inhibition, as seen in in 2D osteogenesis studies19, 20, 26.
Nanovibrational mechanotransductive signalling.
The receptor that appeared most mechanoresponsive to nanostimulation at this
timepoint (day 5) was TRPV1. It has been proposed that TRPV channels influence
osteogenesis through the -catenin (Wnt pathway) activation of RUNX250, 51. In this pathway, ion influx through the TRPV channels causes the activation of protein kinase
C (PKC) and of ERK, mediating -catenin activity50, 51.
To investigate the effects of nanovibrations on signalling processes in MSCs, we used
metabolomic analysis to predict canonical signalling events as this approach provides
an instant picture of phenotypic modulation. Principle component analysis showed
that 3D nanovibrated MSCs and control MSCs, had different metabolomes indicative
of different phenotypes (Supplementary Figure 7a). As expected during active
differentiation, energy based pathways52 were upregulated in nanostimulated MSCs, including lipid (Supplementary Figure 8) and carbohydrate (Supplementary Figure 9)
metabolic pathways, with lipids representing the largest group. Ingenuity pathway
analysis (IPA) fits metabolite input data to the literature in order to be able to predict
biochemical interactions. It was used here to build networks related to lipid
metabolism, that were merged and linked to canonical signalling pathways related to
adhesion, cytoskeletal tension, ERK 1/2 signalling, BMP2 signalling and calcium/Wnt
signalling19, 20, 26 (Supplementary Figure 7b).
To investigate if TRPV plays a role in the osteogenic process, western blot
nanovibrational culture. Specifically, pFAK, pMyosin, pERK, pSMAD1/5/8 and active
-catenin, with and without inhibition of PKC with enzastaurin, were considered. Only
-catenin was affected, becoming down-regulated as PKC was inhibited and the
normal functioning of TRPV channels was indirectly blocked (Figure 5a – no effect of
PKC inhibition was seen in 3D MSCs treated with OSM, Supplementary Figure 10).
We next investigated the effect of channel inhibitors on nanostimulated MSCs in 3D
by measuring total ERK 1/2 and total -catenin levels in the presence and absence of
PKC and TRPV channel inhibition. MSCs in 3D underwent nanostimulation (1000 Hz),
nanostimulation with PKC inhibition (1000 Hz-PKC), and nanostimulation with TRPV
inhibition (1000 Hz-TRPV); protein levels were assayed after 48 hours of stimulation
(Supplementary Figure 11). At the same time, a metabolomics/IPA analysis was
performed to investigate signalling networks linked to the -catenin/Wnt pathways.
Western blot analysis showed that nanostimulated MSCs treated with PKC and TRPV
inhibitors downregulated the expression of ERK 1/2 and -catenin but that only
-catenin was significantly down-regulated in the presence of both inhibitors (Figure
5b). The metabolomics analyses indicated that the Wnt/-catenin pathway was
upregulated following nanostimulation (Figure 6a), but was moderately
down-regulated in the 1000 PKC MSCs (Figure 6b) and largely suppressed in the 1000
Hz-TRPV cells (Figure 6c) (see Supplementary Figures 12-14 for more complete networks).
The metabolomics analysis also inferred that ERK signalling is downregulated in the
1000 Hz-PKC and 1000 Hz-TRPV MSCs (Figure 6a-c), which is in agreement with the
western blot data which show that total ERK protein levels are reduced (Figure 5b).
Together, these findings lead us to propose that TRPV1 activity contributes to
Wnt-mediated osteogenesis in nanovibrated MSCs in 3D. Potential mechanisms are shown
in Figure 6d with the TRPV/-catenin pathway highlighted in bold.
To test if inhibition of PKC and TRPV have direct effects on osteogenesis in 3D culture,
nanovibrational stimulation time was extended out to 5 days to allow for some
phenotypical development and the cultures were inhibited for PKC or TRPV for the
final 24 hours. QPCR was used to test transcript level changes; we looked at BMPR1a
as mid-stage osteogenic markers. For PKC inhibition, downregulation of BMP2 was
observed indicating a phenotypical response (Figure 7). However, with TRPV
inhibition, significant downregulation of BMP2, RUNX2, ALP and osteonectin was
observed showing an immediate and dramatic effect on progression of the osteogenic
phenotype. This data supports that TRPV channels are important to osteogenesis and
that PKC may also have effect (but indicating that it might not be an exclusive effect),
helping build the hypothesis presented in Figure 6d.
We have presented a new class of bioreactor and showed that 3D osteogenesis can
be produced without the use of chemicals and/or growth factors, or of bioactive
scaffolds, sophisticated culture ware, or dedicated incubators. The use of collagen in
this study provided mechanical integration with the 6-well plate because it attaches
to the dish sides. This allowed us to take advantage of its excellent mass-transfer
properties, which also permit large volumes to be used, avoiding the need to use
dense osteogenic scaffolds, such as calcium phosphates and other bioactive ceramics,
which have certain disadvantage and limitations. In fact, on a single bioreactor with 5
ml of gel fill per well, 60 ml of mineralising osteoblasts in an appropriate 3D matrix
can be generated from MSCs.
Summary.
In addition to the potential volumes of graft material that could be produced using
this bioreactor, it also fits well into a good-manufacturing-practice (GMP) workflow.
GMP-grade collagen, media and culture plates exist and have been used in human
trials53. In this approach, the nanovibrational bioreactor remains external to these components as it does not come into contact with cell-therapy products. This prevents
the need to, for example, meet FDA regulation for new scaffolds or induction
chemicals.
We propose that, because of the soft 3D nature of the collagen matrix used in our
approach, the magnitudes of the roles for adhesion and cytoskeletal tension were
mechanoresponsive channels, which we believe stimulate enhanced osteogenesis
through the activation of -catenin signalling.
Acknowledgements. This work was supported by grants to Reid and Dalby from BB/N012690/1, BB/P00220X/1, EP/N013905/1, EP/N012631/1, EP/P001114/1 from
BBSRC, BBSRC/SFI and EPSRC and a programme grant from Find a Better Way. We
thank Jim Hough, Habib Nikukar, Ivor Tifenbrun and Keith Robertson for their
discussion, Carol-Anne Smith for technical support, and Erin Manson for help with
metabolite analysis. Biggs is funded by SFI grant nos. 11/SIRG/B2135 and 13/RC/2073.
Author Contributions. PMT, PGC, GDP, JY, VJ, WO, CG-G, DT and CVG performed the laboratory experiments. PMT, PGC, GDP, WO, KB, GB, MJPB, MSS, SR and MJD analysed the data. PMT, PGC, GDP, MJPB, ASGC, MSS, SR and MJD devised experiments. SR and MJD supervised the research. PMT, PGC, GDP, MSS, SR and MJD wrote the manuscript. PMT, PGC, SR and MJD revised the manuscript.
Competing Interests. The authors declare no competing financial interests
Materials & Methods
To power the piezo array, a high voltage piezo driver (Model ENV 150, Piezosystem Jena, Jena, Germany) was used which is capable of providing 160 Vpk-pk. The sine wave modulation of the amplifier output was provided by a signal generator (Model 33210A, Agilent, Santa Clara, CA).
Finite element modelling (ANSYS). Simulated models of a Corning 6-well plate, the bioreactor top plate and the collagen gel were developed in ANSYS finite element software (ANSYS, Canonsburg, PA). Models were developed in ANSYS Workbench v14.0 with analysis involving use of the Harmonic Response package to provide values for deformation at user defined frequencies.
The culture plate component was modelled as a polystyrene plate bonded to six ferrite magnets via a 0.2 mm layer of epoxy. A similar method was used to model the top plate with materials bonded with a 0.1 mm epoxy bond. Epoxy bonds were also added at the attachment points of the piezo actuators. For this analysis, vibration frequencies of 0 to 10,000 Hz, with 30 nm amplitude, were applied to the models to compare amplitude consistency. Throughout all the analysis, mesh relevance was set at 0 giving a medium mesh density.
For studies of the collagen gel, the model incorporated the polystyrene culture ware (one well of a 6-well plate, and bonding to the vibration source through a 0.1 mm epoxy layer. Harmonic response analysis was used to study the frequency dependant effects of deformation of the gel construct including meniscus curvature at the edge (modelled using the linear shear moduli and assumption of incompressibility) along with estimates of the levels of shear stress within the construct. Vibration condition was set to 1000 Hz, 20 nm, to model the frequency used in experiment. Harmonic response analysis is strictly linear so accuracy would be limited to the linear elastic range of the material. However, the modelled values for shear stress fall within the linear elastic range measured through rheology suggesting this is an accurate modelling assumption for nanoscale vibration. Mesh sizing was set to coarse to reduce computational time. Connections between the gel and the culture ware were set to bonded (assuming that the gel adheres to the culture ware) and used multi point constraints (MPC) to ensure that the mesh was constrained to the container. The additional impact of gravity was incorporated through an inertial acceleration of 9.81 ms-1.
this noise the interferometric apparatus was sat on a rubber mat to provide a partial noise dampening.
Rheology. Assessment of the physio-elastic properties of the collagen matrix was performed by carrying out dynamic frequency sweep experimentation. These frequency sweeps were performed by using a strain-controlled rheometer (Kinexus rotational rheometer system, Malvern Instruments, Malvern, UK). The parallel-plate used to perform the frequency sweep had a 20 mm diameter with a 0.25 mm gap. An integrated thermostat mechanism was used to maintain the sample temperature at 25°C. In order to keep the sample hydrated and prevent drying out through evaporation the internal atmosphere was kept saturated through the use of a solvent trap. An amplitude sweep was carried out and this confirmed no variation in elastic modulus (G’) and viscous modulus (G”). The amplitude sweep was performed up to a strain of 1% and these measurements were taken in a linear viscoelastic regime. The collagen matrix dynamic shear modulus was measured as a frequency function with a frequency range from 1 to 100 Hz. To ensure reproducibility all measurements per sample were performed in triplicates.
Characterisation of collagen matrices by AFM. The fibrillar conformation of type I collagen gel matrices was assessed via AFM in AC mode (Nanowizard 3 Bioscience AFM, JPK Instruments AG, Berlin, Germany). Collagen gel (2 mg/ml) was gently dried with a nitrogen flow before evaluation in the AFM working in air. A pyramidal silicon nitride tip, with a cantilever spring constant of ∼3 N/m and a resonance frequency of 75 kHz (MPP-21120, Bruker), was used to scan the collagen matrix. Height and phase images were simultaneously recorded. The influence of cell seeding density in the local mechanical properties of the collagen gel matrices was evaluated via force spectroscopy. Silicon tipless cantilevers (Arrow TL1, Nanoworld) functionalised with 20 µm silicon beads were used to perform the measurements. Force-distance curves were obtained, after calibration of tip sensitivity and spring constant, with a set-point of 10 nN, a zeta length of 10 μm, a constant duration of 1 s, and at room temperature in liquid environment. Analysis was performed using the JPK processing software (v4.3.21), and force curves were fitted with a Hertz model.
All cell culture was performed in an incubator at 37oC with 5% CO
2. The basal culture media was removed and replenished every 2-3 days. For the osteospecific media positive control samples the DMEM basal media was also substituted with 100 µMol ascorbic acid and 50 nMol dexamethasone (Sigma) (OSM). The collagen matrix was prepared by addition of 10x modified eagle’s media (Sigma), FBS, basal media with the appropriate number of cells and 2.05 mg/mL rat tail Type I collagen (First Link UK, Wolverhampton, UK) in 0.16% acetic acid. The solution was homogeneously mixed by pipetting. Following this 0.1 M NaOH was added while on ice, until a permanent pink/red colour change (phenol red indicator) was observed, to form a gel. The samples were then quickly placed in a 37°C incubator avoiding agitation.
Alamar blue assay. 4 × 10⁴ MSCs/ml of gel (2.5 ml) were stimulated at 1000 Hz. The Alamar blue assay was performed after 1 and 2 weeks of stimulation and compared to non-stimulated controls. Cultured media was removed and hydrogels were washed 3x in warm 1xPBS. 10% (v/v) of AlamarBlue® resazurin (Bio-Rad, Watford, UK) diluted in phenol-red free media (D5030, Sigma) was added to each hydrogel. After further incubation for five hours at 37°C, 5% CO2, the culture supernatant was transferred into 96 well plates to measure the up-taken Alamar blue indicating cell metabolism. A microplate reader (Clariostar, BMG Labtech, Germany) was used to detect light absorbance at wavelengths of 570 nm and 600 nm. The percentage of Alamar blue reduction was calculated as following;
(O2 x A1) - (O1 x A2)
% of reduction of Alamar® blue= --- x100 (R1 x N1) - (R2 x N1)
O 1 = molar extinction coefficient of oxidized Alamar blue at wavelength 570 nm. O 2 = molar extinction coefficient of oxidized Alamar blue at wavelength 600 nm. R 1 = molar extinction coefficient of reduced Alamar blue at wavelength 570 nm. R 2 = molar extinction coefficient of reduced Alamar blue at wavelength 600 nm. A 1 = Observed absorbance reading for test wells at wavelength 570 nm.
A 2 = Observed absorbance reading for test wells at wavelength 600 nm.
N 1 = Observed absorbance reading for negative control wells at wavelength 570 nm. N 2 = Observed absorbance reading for negative control wells at wavelength 600 nm.
Cytoskeletal inhibition in 3D. MSCs were seeded at 4 × 10⁴ cells/ml of gel (2.5 ml) in stimulated and control culture for 5 days in the presence or absence of inhibitors of ROCK (Y27632, Sigma) at 10uM and myosin II (blebbistatin, Sigma cat: B0560) 50mM. Inhibitors were added fresh with all medium changes for the duration of the experiment.
Transient receptor potential (TRP) channel inhibition in 2D. 1x10⁴ MSC cells/well were cultured in 24 well plates for 1 hour with 10% serum for cell attachment and followed by serum starvation (1% serum) for 24 hours to synchronise the cells in G0. After synchronising, fresh basal media was added to cells to start the cell cycle and nanovibration stimulation was simultaneously applied for 23 hours (no stimulation in the control samples) before addition of inhibitors (GsMTX4 (for Piezo1, 4µM Tocris Bioscience cat: 4912,) and QX314 (Sigma cat: L1663) for TRPV1, 1% (v/v) of a 50 mg/ml stock) for the last 1 hour (24 hours total).
Transient receptor potential (TRP) channel inhibition in 3D. Serum starved MSCs seeded at 4×10⁴ cells/ml of gel (2.5 ml) in stimulated and control cultures were cultured for 2 or 5 days in basal medium. For the last 24 hours QX314 (Sigma cat: L1663) was added at 8-hour intervals at 1% (v/v) of a 50 mg/ml stock) concentration. Samples were then processed for either protein or gene expression according to the methods provided.
PCK inhibition in 3D. Method 1 for 5 day culture: MSCs seeded at 4×10⁴ cells/ml of gel (2.5 ml) in stimulated and control 6 well plates for 5 days in the presence of enzastaurin (Tocris Bioscience cat: 5994), a PKC inhibitor. The inhibitor was used at 1µM concentration for the duration of the experiment. Method 2 for 2 or 5 day culture alongside TRPV inhibition: serum starved MSCs seeded at 4×10⁴ cells/ml of gel (2.5 ml) in stimulated and control conditions were cultured for 2 or 5 days in basal medium. For the last 24 hours enzastaurin was added at 8-hour intervals at 1µM concentration. Samples were then processed for either protein expression, gene expression or metabolomics analysis according to the relevant methods.
diluted at a dilution of 1:5000 with a 680 nm infrared dye and GAPDH secondary antibody (donkey anti-rabbit) also had a dilution of 1:5000 with an 800 nm infrared dye. The secondary antibodies were incubated at ambient room temperature on a shaker for 1.5 hour, followed by 5x5min washes in PBS/0.2% Tween. The quantitative spectroscopic analysis was carried out using the LI-COR Odyssey Sa and all dyes and secondary antibodies were sourced from LI-COR corporation.
Quantitative Reverse Transcription polymerase chain reaction (QPCR). Following the required period of stimulation (3, 5, 7, 14, 21 days) within the bioreactor, the MSCs in collagen gels were assessed by qRT-PCR. Nanovibrated and control samples were extracted at the same time. The collagen matrix samples were removed from the 6 well plates and placed in a 15ml Falcon tube. Equal volumes of Trizol reagent (Life Technologies) was added to each sample, which were then vortexed and homogenised using a syringe with 20-G needles. 0.2ml of chloroform (Sigma) was added per ml of Trizol to each sample, mixed and centrifuged in order to separate the aqueous and organic phases. The aqueous phase was removed and the total RNA content was then extracted using the Qiagen RNeasy extraction kit (including a DNAse step) according to the manufacturers instructions (Qiagen, Hilden, Germany). The RNA concentration was quantified using Nanodrop, and normalized for each sample. cDNA was prepared by reverse transcription using the Qiagen Quantitect kit. 12 µL of the normalised dilutions for each RNA sample were added to a 0.2 mL (200 µL) reverse transcription PCR – Cup. To each of the samples 2 µL gDNA wipeout buffer was added. Following this each sample was run at 42ºC for 2 mins, on a thermal Cycler (PCR) system in order to remove any DNA present in the samples. Following the removal of the innate DNA, 6 µL of a stock solution (containing Qiagen reverse transcription buffer reagents) was then added to each reverse transcription cup, to give a total volume of 20 µL. The second program (Supplementary Table 3) was then initiated to reverse transcribe the RNA into cDNA which was subsequently used to perform PCR quantification using the relative comparablemethod. The Quantifast SYBR green qPCR kit (Qiagen) was used to perform amplification with specific primers (Eurofins Genomics, Ebersberg, Germany) related to osteogenesis as well as GAPDH, ACTIN and 18s which were used as a genetic internal controls, listed in (Supplementary Table 4). PCR was quantified using the 2-∆∆Ct method and amplification was carried out using an Applied Biosystems 7500 Real Time PCR system. Unstimulated samples also cultured in a 3D collagen matrix (samples not nanovibrated) were used as negative controls for comparison of osteogenic transcription expression.
concentration was determined using the Nanodrop. Protein samples were run on a pre-cast NOVEX gradient (4-12%) gel system (Invitrogen, Thermo Fisher) and the samples were then transferred onto nylon membrane (Imobilon F, Millipore suitable for use with the Li-COR Odyssey system) according to manufacturer’s protocol. For probing, the blots were incubated in 5% BSA TBS 0.1% (v/v) Tween 20 with the appropriate anti-sera dilution. Antibodies (1:1000 dilution in 5% BSA/0.1% TBST) used were directed to: phosphoERK (Cell Signaling, Cat:4797s) and total ERK (Cell Signaling, Cat:4696s), p-myosin (Cell Signaling, phospho Ser 19, no. 3675), total myosin (Cell Signaling, cat:3672s), beta catenin (anti-active β-catenin, clone 8E7, cat:05-665 and anti-β-catenin, clone7F7.2, cat:04-958, Millipore, Billerica, USA), phospho SMAD1/5/8 (S463/465, Cell Signaling,cat:6944s) and total SMADD1 (Cell Signaling), pFAK (Y925) (Cell signaling, cat:3284P) and total FAK (MBL Life Sciences, cat:D061-3, Aichi, Japan), and total TRPV1 (Abcam, cat:ab111973) were then prepared in a dilution of 1:200. The primary antibody incubation was carried out at 4oC overnight for the phosphorylated proteins and at room temperature for 1-2 hours for the total proteins, followed by 3x5min washes in 0.1% TBST on a shaker. For the Li-COR secondary antibodies (anti-rabbit, cat: 926-32211; anti-mouse, cat: 926-32210) were used at a dilution of 1:8000. The secondary antibodies were incubated at ambient room temperature on a shaker for 1hour, following 3 washes in 0.1% TBST, again with agitation for 5 minutes. Total protein was measured using the Revert total protein stain (Li-COR) solution and used as loading control to normalize the samples where necessary. The quantitative spectroscopic analysis was carried out using the LI-COR Odyssey Sa and all dyes and secondary antibodies were sourced from LI-COR corporate.
Raman Spectroscopy. The 3D collagen gel matrix samples were nanovibrated for 46 days, were partially dried and were directly assessed by Raman spectroscopy without further sample preparation. 4×10⁴ MSCs/ml of gel (2.5 ml) were seeded in each well. A Renishaw InVia Raman spectrometer with a 785 nm line focus laser was used to perform near IR spectroscopic scans. A reference standard of bovine cortical compact bone was used to assess the predominant finger print region spectrum for perfectly mineralised bone, and it was determined that 960 cm-1 and 1170 cm-1 were the predominant scattering wavenumbers. A light microscope (Leica, Wetzlar, Germany) x20 magnification was used to determine regions of interest and mineral deposition for assessment.
Von Kossa Staining. Nanovibrated 3D collagen matrix samples were stimulated for 4 or 6 weeks and were then fixed using 10% formaldehyde at 37ºC for 30 minutes. Each well was seeded with approximately 4×10⁴ cells/ml of gel (2.5 ml). The matrix samples were then submerged in 5 % silver nitrate and exposed to UV lamp for approximately 30 minutes. The samples were washed 5 times in deionized water and were then submerged in 5% sodium thiosulphate for 10 minutes so as to remove any excess silver nitrate. The samples were rinsed 5 times with agitation in deionized water, followed by 70% ethanol/30% water. The samples were then imaged without further preparation and the staining intensities were quantified using image J.
transferred into PBS and subsequently imaged using µCT. The scans were then compared against unstimulated controls. For this experiment, each well (of the 6 well plate) was seeded with 750,000 cells per 2.5 ml gel. In order to image the samples all the gels for both the test sample (stimulated at 1000 Hz) and controls were combined together in a separate cryo tube manufactured by Nunc A/S, with an internal diameter of 9.8 mm (± 0.1 mm). Within the cryo tube the polystyrene saturated with PBS was used to secure the gels in place. This ensured that the samples were unable to move during scanning. Polystyrene was utilized as it is radiolucent and allowed the gels to be imaged unobstructed. The µCT system which was used was a Skyscan 1172 (Orthopaedic engineering department, University of Edinburgh S/N=08F01110). The data was reconstructed using Skyscan reconstruction software and scanning was performed with a 360° rotation (resolution /pixel size = 2.9278 µm, Source Voltage = 58 kV, Source Current = 171 µA, Exposure = 1178 ms).
Metabolomics. MSCs were stimulated in 3D collagen gels (2mg/ml) at a density of 4×10⁴ cells/ml of gel (2.5 ml) for 5 days or 2 days for the transient ion channel and PKC inhibition studies. Non-stimulated samples were used as controls. The metabolites were extracted using a 1:3:1 chloroform/methanol/water extraction buffer and placed on a shaking platform for 1 h at 4°C. The sample supernatant was transferred into 1.5 ml tubes and centrifuged for 3 min at 13,000g at 4°C. The samples were used for hydrophilic interaction liquid chromatography‐mass spectrometry analysis (UltiMate 3000 RSLC, Thermo Fisher, with a 150 x 4.6 mm ZIC-pHILIC column running at 300 uL/min and Orbitrap Exactive, Thermo Fisher, respectively). After Nanodrop (Thermo Fisher) measurement, total protein content was found identical in all samples, thus no further standardization was necessary. A standard pipeline, consisting of XCMS54 (peak picking), MzMatch55 (filtering and grouping), and IDEOM56 (further filtering, post‐processing and identification) was used to process the raw mass spectrometry data. Identified core metabolites were validated against a panel of unambiguous standards by mass and retention time. Further putative identifications were allotted by mass and predicted retention time57. Means and standard errors of the mean were generated for every group of picked peaks and the resulting metabolomics data were uploaded to Ingenuity pathway analysis software for metabolite pathway analysis.
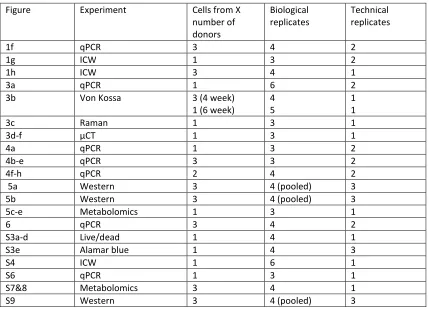
Statistics. Unless stated, one-way ANOVA and Kruskal Wallis with Dunn’s post-test was used to compare significance in qPCR, in cell western and Von Kossa stain experiments. Two tailed, unpaired U-Tests (Mann Whitney) were performed where a direct comparison was assessed between only two population groups. A sample population of between 3 and 6 replicates were always used. All results are quoted as mean ± standard deviation and the probability values have been quoted to an accuracy of 95%, 99% and 99.9% (*p < 0.05, **p < 0.01 and ***p ≤ 0.001 respectively). Supplementary Table 5 indicates samples numbers and replicates used in each figure presented.
The authors declare that all data supporting the findings of this study are available within the paper and its supplementary information. All raw data can be found at: http://dx.doi.org/10.5525/gla.researchdata.327
1. Giannoudis, P.V., Chris Arts, J.J., Schmidmaier, G. & Larsson, S. What should be the characteristics of the ideal bone graft substitute? Injury 42 Suppl 2, S1-2 (2011). 2. Myeroff, C. & Archdeacon, M. Autogenous bone graft: donor sites and techniques. J
Bone Joint Surg Am 93, 2227-2236 (2011).
3. Dimitriou, R., Mataliotakis, G.I., Angoules, A.G., Kanakaris, N.K. & Giannoudis, P.V. Complications following autologous bone graft harvesting from the iliac crest and using the RIA: a systematic review. Injury 42 Suppl 2, S3-15 (2011).
4. Garcia-Gareta, E., Coathup, M.J. & Blunn, G.W. Osteoinduction of bone grafting materials for bone repair and regeneration. Bone 81, 112-121 (2015).
5. Dove, A. Drug screening--beyond the bottleneck. Nat Biotechnol 17, 859-863 (1999). 6. Dalby, M.J. et al. The control of human mesenchymal cell differentiation using
nanoscale symmetry and disorder. Nat Mater 6, 997-1003 (2007).
7. Wen, J.H. et al. Interplay of matrix stiffness and protein tethering in stem cell differentiation. Nat Mater (2014).
8. Murphy, W.L., McDevitt, T.C. & Engler, A.J. Materials as stem cell regulators. Nat
Mater 13, 547-557 (2014).
9. Engler, A.J., Sweeney, H.L., Discher, D.E. & Schwarzbauer, J.E. Extracellular matrix elasticity directs stem cell differentiation. J Musculoskelet Neuronal Interact 7, 335 (2007).
10. Curran, J.M. et al. Introducing dip pen nanolithography as a tool for controlling stem cell behaviour: unlocking the potential of the next generation of smart materials in regenerative medicine. Lab Chip 10, 1662-1670 (2010).
11. Kloxin, A.M., Kasko, A.M., Salinas, C.N. & Anseth, K.S. Photodegradable hydrogels for dynamic tuning of physical and chemical properties. Science 324, 59-63 (2009). 12. Benoit, D.S., Schwartz, M.P., Durney, A.R. & Anseth, K.S. Small functional groups for
controlled differentiation of hydrogel-encapsulated human mesenchymal stem cells.
Nat Mater 7, 816-823 (2008).
13. Khetan, S. et al. Degradation-mediated cellular traction directs stem cell fate in covalently crosslinked three-dimensional hydrogels. Nat Mater 12, 458-465 (2013). 14. Rauh, J., Milan, F., Gunther, K.P. & Stiehler, M. Bioreactor systems for bone tissue
engineering. Tissue engineering. Part B, Reviews 17, 263-280 (2011).
15. Epstein, N.E. Complications due to the use of BMP/INFUSE in spine surgery: The evidence continues to mount. Surgical neurology international 4, S343-352 (2013). 16. Salter, E. et al. Bone tissue engineering bioreactors: a role in the clinic? Tissue
engineering 18, 62-75 (2012).
17. Pemberton, G.D. et al. Nanoscale stimulation of osteoblastogenesis from mesenchymal stem cells: nanotopography and nanokicking. Nanomedicine (Lond) 10, 547-560 (2015).
18. Nikukar, H. et al. Osteogenesis of mesenchymal stem cells by nanoscale mechanotransduction. ACS Nano 7, 2758-2767 (2013).
20. Kilian, K.A., Bugarija, B., Lahn, B.T. & Mrksich, M. Geometric cues for directing the differentiation of mesenchymal stem cells. Proc Natl Acad Sci U S A 107, 4872-4877 (2010).
21. Abbott, B.P. et al. Observation of Gravitational Waves from a Binary Black Hole Merger. Phys Rev Lett 116, 061102 (2016).
22. Hakansson, B., Brandt, A., Carlsson, P. & Tjellstrom, A. Resonance frequencies of the human skull in vivo. The Journal of the Acoustical Society of America 95, 1474-1481 (1994).
23. Dalby, M.J., Gadegaard, N. & Oreffo, R.O. Harnessing nanotopography and integrin-matrix interactions to influence stem cell fate. Nature materials 13, 558-569 (2014). 24. McNamara, L.E. et al. Skeletal stem cell physiology on functionally distinct titania
nanotopographies. Biomaterials 32, 7403-7410 (2011).
25. Yang, J. et al. Nanotopographical Induction of Osteogenesis through Adhesion, Bone Morphogenic Protein Cosignaling, and Regulation of MicroRNAs. ACS Nano 8, 9941-9953 (2014).
26. Engler, A.J., Sen, S., Sweeney, H.L. & Discher, D.E. Matrix elasticity directs stem cell lineage specification. Cell 126, 677-689 (2006).
27. Masuyama, R. et al. TRPV4-mediated calcium influx regulates terminal differentiation of osteoclasts. Cell metabolism 8, 257-265 (2008).
28. Coste, B. et al. Piezo proteins are pore-forming subunits of mechanically activated channels. Nature 483, 176-181 (2012).
29. Kim, S.E., Coste, B., Chadha, A., Cook, B. & Patapoutian, A. The role of Drosophila Piezo in mechanical nociception. Nature 483, 209-212 (2012).
30. Kuipers, A.J., Middelbeek, J. & van Leeuwen, F.N. Mechanoregulation of cytoskeletal dynamics by TRP channels. European journal of cell biology 91, 834-846 (2012). 31. Bando, Y., Hirano, T. & Tagawa, Y. Dysfunction of KCNK potassium channels impairs
neuronal migration in the developing mouse cerebral cortex. Cerebral cortex 24, 1017-1029 (2014).
32. Lee, W. et al. Synergy between Piezo1 and Piezo2 channels confers high-strain mechanosensitivity to articular cartilage. P Natl Acad Sci USA 111, E5114-E5122 (2014).
33. Zhang, W., Yan, Z., Jan, L.Y. & Jan, Y.N. Sound response mediated by the TRP channels NOMPC, NANCHUNG, and INACTIVE in chordotonal organs of Drosophila larvae. Proc
Natl Acad Sci U S A 110, 13612-13617 (2013).
34. Maksimovic, S. et al. Epidermal Merkel cells are mechanosensory cells that tune mammalian touch receptors. Nature 509, 617-621 (2014).
35. Lieben, L. & Carmeliet, G. The Involvement of TRP Channels in Bone Homeostasis.
Front Endocrinol (Lausanne) 3, 99 (2012).
36. Idris, A.I., Landao-Bassonga, E. & Ralston, S.H. The TRPV1 ion channel antagonist capsazepine inhibits osteoclast and osteoblast differentiation in vitro and ovariectomy induced bone loss in vivo. Bone 46, 1089-1099 (2010).
37. Clapham, D.E. TRP channels as cellular sensors. Nature 426, 517-524 (2003).
38. Bae, C., Sachs, F. & Gottlieb, P.A. The mechanosensitive ion channel Piezo1 is inhibited by the peptide GsMTx4. Biochemistry 50, 6295-6300 (2011).
39. Chen, J. et al. Selective blockade of TRPA1 channel attenuates pathological pain without altering noxious cold sensation or body temperature regulation. Pain 152, 1165-1172 (2011).
41. Ge, C. et al. Reciprocal Control of Osteogenic and Adipogenic Differentiation by ERK/MAP Kinase Phosphorylation of Runx2 and PPARgamma Transcription Factors. J
Cell Physiol 231, 587-596 (2016).
42. Cheema, U., Chuo, C.-P., Sarathchandra, P., Nazhat, S.N. & Brown, R.A. Engineering Functional Collagen Scaffolds: Cyclical loading Increases Material Strength and Fibril Aggregation. Advanced Functional Materials 17, 2426-2431 (2007).
43. Discher, D.E., Mooney, D.J. & Zandstra, P.W. Growth factors, matrices, and forces combine and control stem cells. Science 324, 1673-1677 (2009).
44. Swift, J. et al. Nuclear lamin-A scales with tissue stiffness and enhances matrix-directed differentiation. Science 341, 1240104 (2013).
45. Huebsch, N. et al. Harnessing traction-mediated manipulation of the cell/matrix interface to control stem-cell fate. Nat Mater 9, 518-526 (2010).
46. Lai, V.K., Lake, S.P., Frey, C.R., Tranquillo, R.T. & Barocas, V.H. Mechanical behavior of collagen-fibrin co-gels reflects transition from series to parallel interactions with increasing collagen content. Journal of biomechanical engineering 134, 011004 (2012).
47. Gentleman, E. et al. Comparative materials differences revealed in engineered bone as a function of cell-specific differentiation. Nat Mater (2009).
48. Vandorpe, D.H. & Morris, C.E. Stretch activation of the Aplysia S-channel. J Membr
Biol 127, 205-214 (1992).
49. Stein, G.S. & Lian, J.B. Molecular mechanisms mediating proliferation/differentiation interrelationships during progressive development of the osteoblast phenotype.
Endocr Rev 14, 424-442 (1993).
50. Liu, Y. et al. Hydrogen sulfide maintains mesenchymal stem cell function and bone homeostasis via regulation of Ca(2+) channel sulfhydration. Cell Stem Cell 15, 66-78 (2014).
51. Gaur, T. et al. Canonical WNT signaling promotes osteogenesis by directly stimulating Runx2 gene expression. J Biol Chem 280, 33132-33140 (2005).
52. Tsimbouri, P.M. et al. Using nanotopography and metabolomics to identify biochemical effectors of multipotency. ACS Nano 6, 10239-10249 (2012).
53. Agosti, J.K., Chandler, L.A., Anderton, C.M. & Clark, R.M. Serial sharp debridement and formulated collagen gel to treat pressure ulcers in elderly long-term care patients: a case study. Ostomy Wound Manage 59, 43-49 (2013).
54. Smith, C.A., Want, E.J., O'Maille, G., Abagyan, R. & Siuzdak, G. XCMS: processing mass spectrometry data for metabolite profiling using nonlinear peak alignment, matching, and identification. Anal Chem 78, 779-787 (2006).
55. Scheltema, R.A., Jankevics, A., Jansen, R.C., Swertz, M.A. & Breitling, R. PeakML/mzMatch: a file format, Java library, R library, and tool-chain for mass spectrometry data analysis. Anal Chem 83, 2786-2793 (2011).
56. Creek, D.J., Jankenevics, A., Burgess, K.V., Breitling, R. & Barrett, M.P. IDEOM: An excel interface for analysis of LC-MS based metabolomics data. BMC Bioinformatics In Press (2012).
57. Creek, D.J. et al. Toward global metabolomics analysis with hydrophilic interaction liquid chromatography-mass spectrometry: improved metabolite identification by retention time prediction. Anal Chem 83, 8703-8710 (2011).
(QX314) were added for 1 hour. pERK 1/2 levels were reduced only in MSCs undergoing nanovibrational stimulation when either channel was blocked. D=3, r=4, results = meanSD, stats by ANOVA and Kruskal Wallis test where **p<0.01 and***p<0.001.
seen at frequencies of 2500, 3500 and 5000 Hz with gel vibration consistently following the underlying substrate below 2000 Hz. The inset shows the specific variances, including increased edge amplitude (dashed lines), at the experimental frequency of 1000 Hz, replicating the modelled results in (d) and (e). Interferometric results show mean values ±SD (n=3).
Figure 3. Confirmation of bone mineralisation in 3D through nanovibrational stimulation. (a) Time course qPCR analysis of BMP2, RUNX2, ALP, OPN, OCN and collagen I transcripts, showing significantly higher expression in 3D nanovibrated MSCs compared to control 3D cultures at the same time point. Donors (d)=1, replicates per donor (r)= 6, technical replicates per replicate (t) = 2; results = meanSD, stats by Mann Whitney U-test where *p<0.05, **p<0.01 and ***p<0.001. Values are log scale. (b) Von Kossa staining and quantification. Staining performed after 6 weeks of nanovibrations at 1000 Hz in 3D. Gels shown (on left) were removed from a 6-well plate before processing. The intensity of von Kossa staining was measured against unstimulated controls and osteospecific media (OSM). A significantly increased level of staining was observed for the nanostimulated samples relative to the unstimulated controls after 4 weeks (d=3 (d=1 for OSM), r=4), and for nanostimulated samples and OSM-treated cells after 6 weeks (d=1, r=5). Results are mean±SD where *p<0.05, ** p<0.01 and ***p<0.001 by ANOVA and Kruskal Wallis test (individual data points are shown as dots). (c) Raman spectra for bovine cortical compact bone, this profile was used as a reference standard to characterise the Raman scattering (fingerprint identification region 500 cm-1 – 1500 cm-1) pattern of bone. Predominant peaks
observed at ~ 960 cm-1 (arrow) and ~ 1072 cm-1 (arrowhead) correspond to PO 43- v1
and CO32- bond stretching, respectively. (d) For the control sample, MSCs were cultured
were seeded at 40,000 cells/ml; for the µCT analysis, a higher cell concentration, 300,000 cells/ml, was used.
Figure 4. Testing for channel and phenotype sensitivity to cytoskeletal tension. (a) Temporal qPCR data for Piezo 1, Piezo2, TRPV1 and KCNK2 transcripts in MSCs after 3, 5, 7, 14 and 21 days of 3D nanovibrational stimulation compared to control cultures. A biphasic trend of high to low expression, recovery, and high to low expression was noted with significant downregulation of all the receptor transcripts seen at day 21. Donors (d)=1, replicates per donor (r)= 6 (3 for days 3 and 5), technical replicates per replicate (t) = 2; results = meanSEM, stats by Mann Whitney U-test where *p<0.05 and ***p<0.001. Values are log scale. (b-e) qPCR analysis for Piezo 1 (b), Piezo 2 (c), KCNK2 (d) and TRPV1 (e) expression in MSCs after 5 days of nanovibrational stimulation or of OSM stimulation, compared to control cultures, with addition of the ROCK inhibitor (Y27632) or the myosin II inhibitor (blebbistatin). Cytoskeletal tension dependencies were noted for Piezo 2 (c) and TRPV1 (e), with increased significance noted when osteogenesis was stimulated by nanovibration compared to stimulation by OSM. D=3, r=4, t=2; results = meanSEM, stats by ANOVA and Kruskal Wallis test where *p<0.05 and **p<0.01. Values are log scale. (f-h) qPCR analysis of BMPR1a (f), RUNX2 (g) and ALP (h) expression, in MSCs after 5 days of nanovibrational stimulation (1000Hz) compared to control cultures, with addition of Y27632 or blebbistatin. Cytoskeletal tension dependencies were noted for BMPR1a (f) at this time point. D=2, r=3, t=2; results = meanSEM, stats by ANOVA and Tukey test where *p<0.05 and ***p<0.001. Values are log scale.
= 3, replicated per donor (r) (pooled) = 4, results = meanSD, stats by Tukey test where *p<0.05. (b) Western-blot densitometry for total ERK/lane loading control and total -catenin/lane loading control with/without PKC (1000 PKC) and TRPV (1000
Hz-TRPV) inhibition. Total -catenin was significantly reduced with PKC and TRPV inhibition. Data is mean relative to unstimulated control for d = 3, r (pooled) = 4, results = meanSD, stats by Tukey test where *p<0.05.
Figure 6. Testing for TRPV and wnt involvement in nanovibration-stimulated osteogenic stimulation using metabolomics. (a-c) Metabolic networks, generated in IPA by uploading of metabolite data and use of predictive biochemical interactions, that link metabolite changes to signalling hubs, such as ERK and the canonical Wnt signalling pathway. (a) The network for 1000 Hz-stimulated cells, demonstrating the mainly predicted biochemical up-regulation of these pathways. (b) The network for 1000 Hz-PKC inhibition, showing a trend towards predicted down-regulation. (c) The network for 1000 Hz-TRPV regulation, showing broadly predicted down-regulations. See key for pathway information, data is mean relative to unstimulated control for d=3, r=4. (d) Schematic showing possible osteogenesis inducing mechanisms that were tested, with the TRP--catenin pathways highlighted as a pathway that we have proposed as being central to MSC nanovibrational osteogenesis.
Supplementary information for:
Stimulation of 3D osteogenesis by mesenchymal stem cells via a nanovibrational bioreactor.
P. Monica Tsimbouri, Peter G. Childs, Gabriel D. Pemberton, Jingli Yang, Vineetha Jayawarna, Wich
Table of contents.
Item Title Page
STable 1 Material properties of the collagen gels, with and without MG63 cells. 3
SFig 1 AFM stiffness measurements with increased cell loading. 3
SFig 2 Comparison of 2.5 mL and 5.0 mL collagen gel fill on the nanovibration effect.
4
SFig 3 Viability and metabolic activity of MSCs seeded into collagen gels with/without nanovibrational stimulation.
5
SFig 4 Osteogenic assessment of nanovibration on bone protein expression. 6
SFig 5 Further Raman Spectra. 6
STable 2 Quantitative results of Raman scattering. 7
SFig 6 Analysis of osteoblast genes at 14 days of culture after inhibition of intracellular tension.
7
SFig 7 Metabolomics links to canonical signalling pathways. 8
SFig 8 Heatmap of lipid metabolism. 9
SFig 9 Heatmap of carbohydrate metabolism. 10
SFig 10 Western blot analysis for 3D cultures. 11
SFig 11 Western blots corresponding to Figure 5b. 12
SFig 12 Metabolomics links to wnt signalling for nanovibrationally stimulated MSCs after 5 days of culture.
13
SFig 13 Metabolomics links to wnt signalling for NS-PKC stimulated MSCs after 5 days of culture.
14
SFig 14 Metabolomics links to wnt signalling for NS-TRPV stimulated MSCs after 5 days of culture.
15
STable 3 RT-PCR Reverse transcription thermal programme. 16
STable 4 Primers for genes used to perform qPCR. 17
STable 5 Information regarding biological experiment replicate numbers linked to the figures.
18
Supplementary table 1. Material properties of the collagen gels, with and without MG63 cells. Values for shear
moduli were taken from rheological measurement and used to calculate elastic and bulk moduli. Gels were seeded with 40,000 MG63 osteoblasts / ml). Results are mean ± SD, N=3. Note MG63 cells were used for interferometry as a model cell to prevent using primary human cells with equipment in a non-class II environment. Further note that modulus falls sharply when >100,000 cell/ml were seeded.
Shear Moduli, G (Pa)
Elastic Moduli, E (Pa)
Bulk Moduli, K
(MPa) Poisson Ratio, ν
Collagen 36 ± 7.4 108 ± 22.2 1800 ± 370 0.5
Collagen/cells 24.5 ± 2.3 73.5 ± 6.3 1225 ± 105 0.5
Supplementary Figure 1. AFM stiffness measurements with increased cell loading. Values for elastic moduli