Open Access
Research article
Modulations of cell cycle checkpoints during HCV associated
disease
Saira Sarfraz
1, Saeed Hamid
2, Syed Ali
1, Wasim Jafri
2and Anwar A Siddiqui*
1Address: 1Department of Biological and Biomedical Sciences, Aga Khan University, Karachi, Pakistan and 2Department of Medicine, Aga Khan University, Karachi, Pakistan
Email: Saira Sarfraz - [email protected]; Saeed Hamid - [email protected]; Syed Ali - [email protected]; Wasim Jafri - [email protected]; Anwar A Siddiqui* - [email protected]
* Corresponding author
Abstract
Background: Impaired proliferation of hepatocytes has been reported in chronic Hepatitis C virus infection. Considering the fundamental role played by cell cycle proteins in controlling cell proliferation, altered regulation of these proteins could significantly contribute to HCV disease progression and subsequent hepatocellular carcinoma (HCC). This study aimed to identify the alterations in cell cycle genes expression with respect to early and advanced disease of chronic HCV infection.
Methods: Using freshly frozen liver biopsies, mRNA levels of 84 cell cycle genes in pooled RNA samples from patients with early or advanced fibrosis of chronic HCV infection were studied. To associate mRNA levels with respective protein levels, four genes (p27, p15, KNTC1 and MAD2L1) with significant changes in mRNA levels (> 2-fold, p-value < 0.05) were selected, and their protein expressions were examined in the liver biopsies of 38 chronic hepatitis C patients.
Results: In the early fibrosis group, increased mRNA levels of cell proliferation genes as well as cell cycle inhibitor genes were observed. In the advanced fibrosis group, DNA damage response genes were up-regulated while those associated with chromosomal stability were down-regulated. Increased expression of CDK inhibitor protein p27 was consistent with its mRNA level detected in early group while the same was found to be negatively associated with liver fibrosis. CDK inhibitor protein p15 was highly expressed in both early and advanced group, but showed no correlation with fibrosis. Among the mitotic checkpoint regulators, expression of KNTC1 was significantly reduced in advanced group while MAD2L1 showed a non-significant decrease.
Conclusion: Collectively these results are suggestive of a disrupted cell cycle regulation in HCV-infected liver. The information presented here highlights the potential of identified proteins as predictive factors to identify patients with high risk of cell transformation and HCC development.
Background
Infection with HCV accounts for a vast majority of viral hepatitis cases. A recent report suggests its prevalence in geographically diverse areas, affecting around 130 million
people worldwide [1]. In Pakistan, the frequency of HCV infection is estimated to be around 6% in general popula-tion [2]. These figures are alarming, as patients currently asymptomatic with relatively mild disease may eventually Published: 10 August 2009
BMC Infectious Diseases 2009, 9:125 doi:10.1186/1471-2334-9-125
Received: 19 January 2009 Accepted: 10 August 2009
This article is available from: http://www.biomedcentral.com/1471-2334/9/125
© 2009 Sarfraz et al; licensee BioMed Central Ltd.
progress to complications of chronic liver disease like, cir-rhosis, end-stage liver disease and hepatocellular carci-noma (HCC). According to a recent review published by Raza et al., 45% cases of HCC in Pakistan were found to be positive for HCV antibody [3]. Epidemiological and clinical studies have also demonstrated a causative role of HCV infection in the development of HCC [4], albeit the underlying mechanism is not fully known.
Liver injury is generally believed to be initiated by the death of infected cells afflicting problems of inflamma-tion, regenerative hepatocyte proliferation and fibrosis in the surroundings [5]. In chronic HCV infection, rounds of hepatic cell destruction and regeneration along with fibro-sis occur as a result of perfibro-sistent inflammation. This phe-nomenon provides the pathogenic basis of HCV associated liver disease. Together, these events keep the dividing hepatocytes susceptible to cellular insult and hence putting them at a greater risk of acquiring muta-tions.
The molecular events during proliferation are tightly con-trolled by the cell cycle regulators. During the cell cycle, flawless DNA replication and chromosome segregation are achieved by means of quality control checkpoints that are active at each of the four phases of cell cycle namely Gap1 (G1), DNA synthesis (S), Gap2 (G2) and Mitosis (M). Progression through the phases of cell cycle is driven by temporal activation of specific protein kinase com-plexes consisting of cyclins and cyclin dependent kinases (CDKs) [6]. In response to cellular insults, such as DNA damage and oxidative stress, inhibitory checkpoint regu-lators are activated at G1, S and G2 phases and stall the progression of cell cycle [7]. These regulators include DNA damage response genes (RAD1, HUS1, RAD9, ATM, ATR and p53) [8] and members of CDK inhibitor family, p16 (CDKN2A), p15 (CDKN2B), p21 (CDKN1A) and p27 (CDKN1B) [9]. In the subsequent M phase, mitotic check-point proteins of MAD and BUB families are responsible for a proper chromosomal segregation during cell division [10].
Studies performed on hepatic biopsies from chronic hep-atitis C patients have shown an imbalance at G1/S check-point of cell cycle [11,12]. In fact, the report from Marshal et al showed a G1 arrest in hepatocytes characterized by over expression of CDK inhibitor p21. In our previous work [13] this arrest was further described by showing altered expression of tumor suppressor p53 and apoptotic proteins Caspase-3 and Bcl-2. Although these reports sug-gest modulations of cell cycle events in hepatocytes dur-ing the course of HCV-mediated disease progression, a detailed analysis of cell cycle regulators involved at other checkpoints still needs to be performed.
In order to determine the contribution of cell cycle genes in HCV-induced disease progression, we have studied the altered expression of cell cycle genes in HCV infected liver biopsy tissues. This might be considered as an initial step towards the prevention of chronic HCV disease progres-sion into HCC. The mRNA expresprogres-sion of eighty four cell cycle genes were first examined in pooled RNA samples from patients with early or advanced HCV disease, and in normal liver RNA of an uninfected individual. This analy-sis identifies a list of differentially expressed genes involved at cell cycle checkpoints. The translational levels of four differentially expressed genes (p15, p27, KNTC1 and MAD2L1) were further examined. These genes were selected on the basis of their crucial roles at G1/S and mitotic checkpoints, in 38 chronic HCV infected tissues using immunohistochemistry or western blotting. The results showed significant association of p27 and KNTC1 with the progression of liver fibrosis.
Methods
Tissue Samples
After obtaining approval from the ethical review commit-tee at the Aga Khan University, and informed consent from the patients, liver biopsy specimens were collected from thirty eight untreated chronic hepatitis C patients and six non-viral hepatitis patients. Each sample was apportioned into two pieces; one was frozen at -80°C and other was fixed in formalin. An experienced liver patholo-gist performed the histopathological grading and staging on formalin-fixed paraffin embedded tissue samples, employing Batts and Ludwig scoring system [14]. Fibrosis stage was F0, F1, F2, F3 and F4 in 5, 9, 6, 10 and 8 patients, respectively. Paraffin embedded tissues from individuals who had normal liver histology (n = 4) as determined by light microscopy, were also included as controls in the immunohistochemistry experiments.
Sample Preparation and Quantitative RT-PCR
For transcriptional studies eight liver specimens were selected; four with F0-1, designated as early HCV disease and four with F3-4, designated as advanced HCV disease (Table 1a). Total RNA from frozen liver tissues was extracted in TRIzol reagent (Invitrogen, MD, USA). The extract was made DNA free by digestion with RNase-free DNase (Invitrogen, MD, USA) using 0.2 U/1 μg RNA and incubation at 37°C for 10 to 30 minutes followed by DNase inactivation at 75°C for 5 minutes. For PCR array experiments, human cell cycle RT2 profiler PCR array
have described RNA pooling as an appropriate initial screening approach [15]. Given the limited availability of liver biopsies from normal liver patients, total RNA of normal, non-diseased liver purchased from Ambion (Palo Alto, CA) was used as a reference standard in these exper-iments. Reverse transcription was performed at 37°C for 1 hour with ReactionReady first strand cDNA Synthesis Kit (SuperArray Biosciences, MD) using 1 μg of total RNA. The synthesized cDNA was subjected to PCR amplifica-tion using RT2 profiler PCR arrays according to
manufac-turers' instructions. The PCR conditions used were as follows; 95°C for 10 minutes followed by 40 cycles at 95°C for 30 seconds and 60°C for one minute. Each experiment was performed in duplicate or triplicate on iCycler iQ Real Time PCR system (BioRad Laboratories). Of the 5 housekeeping genes, GAPDH was used for nor-malization. Fold change in expression of different groups was calculated using ΔΔCt method [16]. A p-value of ≤
0.05 and a fold change of ≥ 2 in gene expression was taken as significant.
Antibodies
The following antibodies were used for immunohisto-chemistry at the dilutions given in parentheses; Mouse monoclonal antibodies to p27 (DCS-72.F6, 1:50) and p15 (15P06, 1:25) were purchased from Abcam (Cam-bridge, UK). For western blotting monoclonal antibodies against MAD2L1 (17D10, 1:500) and KNTC1 (10H4, 1:1000) were purchased from Abcam (Cambridge, UK) and AbNova (Taiwan), respectively.
Immunohistochemistry
For immunohistochemistry 4-micron thin sections of par-affin-embedded liver tissues (Table 1b) were deparaffin-ized and rehydrated using a xylene-alcohol sequential
wash. The sections were then subjected to antigen retrieval by heating in 0.01 M citrate buffer (pH 6.0) using a pres-sure-cooker. EnVision Kit (Dako, Hamburg, Germany) was used for immunostaining essentially following the manufacturer's protocol. Briefly, endogenous peroxidase was blocked for 5 min in 0.03% H2O2. Sections washed in Tris-buffered saline with Tween 20 (TBST; 0.05 mol/l Tris and 0.15 mol/l NaCl, pH 7.6, 0.1% Tween20) were incu-bated with primary antibodies for 1 hour at room temper-ature. Thereafter, a horseradish peroxidase (HRP)-labelled polymer conjugated with a secondary antibody was applied. The staining was visualized with 3, 3'-diami-nobenzidine tetrahydrochloride (DAB). Finally, the slides were counterstained with haematoxylin and mounted in DPEX for examination. The immunostained sections were examined using Nikon Eclipse E8000 and image analysis system, (Nikon, Japan). Quantification of positive hepa-tocytes was undertaken by two independent observers counting approximately 1000 hepatocytes at magnifica-tion 400× in five randomly selected fields. The positive hepatocytes were expressed as a percentage of the total cells counted in each case and values for subsequent anal-ysis were obtained from the mean of the two independent observations.
Protein Extraction and Western Blotting
Proteins were isolated from the organic phase of TRIzol extraction as described in manufacturer's protocol. Iso-lated proteins were heat denatured in electrophoresis sample buffer (62 mM Tris-Cl, pH 6.8, 0.2% glycerol, 2% SDS, 0.04% β-mercaptoethanol, 0.04% bromophenol blue) and loaded onto 12% SDS-polyacrylamide gel. After electrophoresis on the gel, separated protein bands were transferred onto a PVDF membrane (Amersham, Ger-many). Membranes were blocked with 5% Blotting Grade
Table 1: Demographic features of the study patients
Mean Age (years) Gender (male/female) Virus infection *Stage of Fibrosis *Grade of Inflammation
a) Patients included in PCR array experiments
Early HCV (n = 4)
40 ± 6.2 2/2 HCV 0–1 0–1
Advanced HCV (n = 4)
53 ± 4.9 2/2 HCV 3–4 3–4
b) Patients included in Immunohistochemistry experiments
Chronic HCV (n = 38)
42+9.3 18/20 HCV 0–4 1–4
Non-viral hepatitis (n = 6) 49 ± 2.1 2/4 None 1–4 1–3
Normal (n = 4)
26 ± 4.0 2/2 None -
Blocker non-fat dry milk powder overnight at 4°C. The membrane was incubated with primary antibody diluted in 1× TBST (Tris-buffered saline, 0.1% Tween 20) on an orbital shaker, followed by three washings in TBST for 10 mins. After washing, the membrane was incubated with horse radish peroxidase-labelled anti-mouse IgG (1:10,000) for 1 h on an orbital shaker at room tempera-ture. Membrane was washed with 1× TBST three times for 10 min on a shaker. The blot was developed with ECL Plus reagent (Amersham, Germany) according to manufac-turer's instructions. Actin was included as internal loading control and detected by Anti-actin (Santa Cruz). Band intensities were measured using Image J software (NIH, USA).
Statistical Analysis
Significant fold change in mRNA levels of each gene between the groups was tested using t-test as indicated by the manufacturer (SuperArray, MD). Analyses of immu-nostaining data were performed using the Statistical Pack-age for Social Sciences (SPSS, 14.0). Association between the expression of p27, p15, KNTC1 and MAD2L1with his-tological feature fibrosis was analyzed using Johnkhere Terpestra test or Mann Whitney U-test. Correlations among the groups were evaluated by Spearman's rank cor-relation coefficient. A p-value of less than 0.05 was con-sidered significant.
Results
Transcriptional Profile of Cell Cycle Pathway Genes
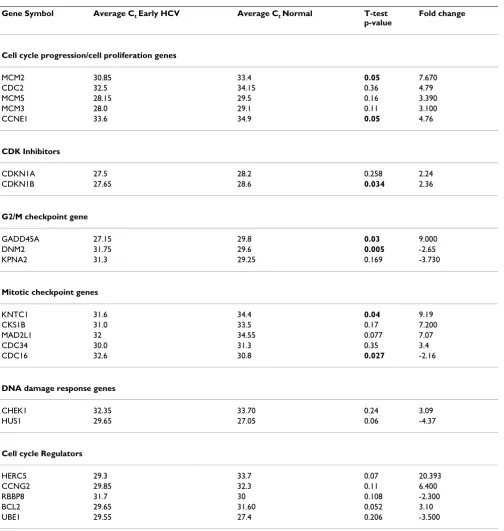
In order to assess the extent of modulation in cell cycle gene expression during chronic infection, PCR arrays of 84 cell cycle genes were performed in RNA samples sepa-rately pooled from early HCV, advanced HCV and com-mercial preparation of human normal liver RNA. The mean GAPDH threshold cycle (Ct) values for early HCV, advanced HCV and normal liver were 22.45 ± 0.5, 22.95 ± 0.42 and 22.0 ± 0.21 respectively. Comparisons of mRNA expressions of cell cycle genes, made between, 1) normal liver to early HCV and 2) early HCV to advanced HCV, revealed that fifteen (18%) of the 84 cell cycle genes were not detectable in any of the comparative groups, when Ct value greater than 35 was applied as a cutoff for significant expression.
The mRNA expression of 22 (31%) of the remaining 69 genes showed more than 2-fold change in early HCV ver-sus normal liver (Table 2). Seven (32%) of these showed significant increase which include proliferation genes
Mcm-2 and cyclin E1, DNA repair gene GADD45α
(Growth arrest and DNA damage 45α), CDK inhibitor CDKN1B/p27 and G2-M phase regulatory genes KNTC1, DNM2 and CDC16 (see additional file 1).
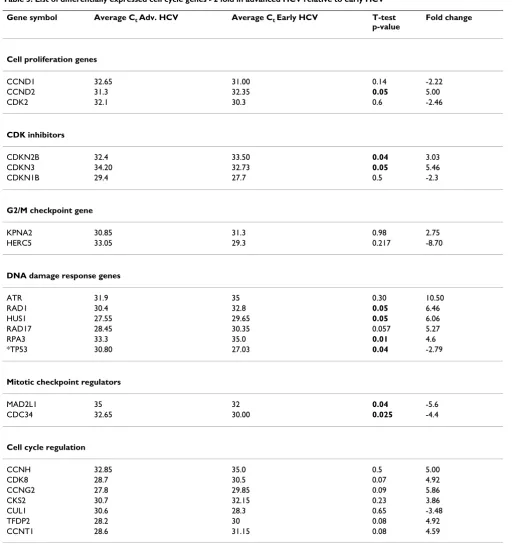
In early versus advanced HCV comparison, 23 (33%) of the 69 genes showed more than 2-fold change (Table 3). Nine (29%) of these genes were significantly differentially expressed which include DNA damage response genes RPA3, RAD1, HUS1 and CDK inhibitors CDKN2B/p15, CDKN3 that were found up-regulated whereas tumor sup-pressor protein p53 and mitotic checkpoint protein MAD2L1 were found down regulated (see additional file 1).
Protein Expression of CDK Inhibitors
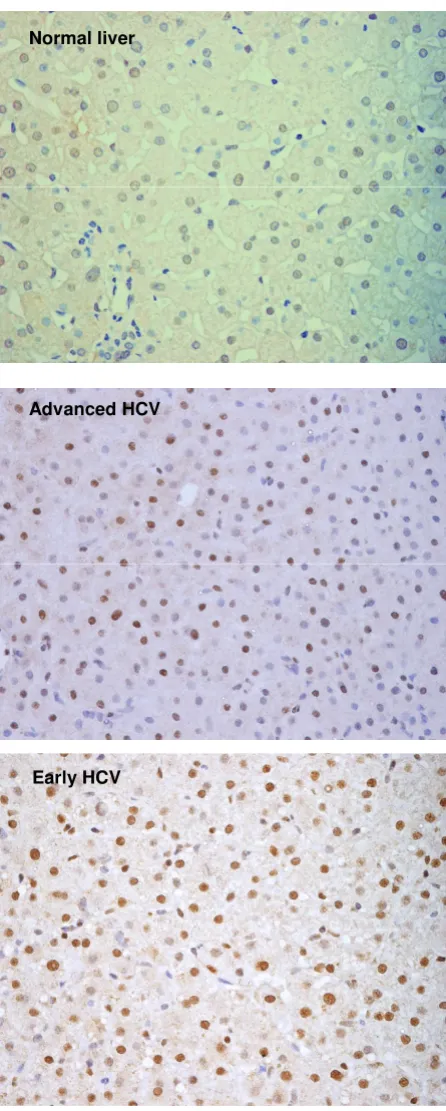
Experiments performed to evaluate the differential expres-sion of cell cycle genes showed significant change in the expression of CDK inhibitors p27 and p15. Further inves-tigation focusing on the expression of their corresponding proteins in paraffin embedded sections from 38 chronic hepatitis C patients (14 cases with F0 or F1, 6 cases with F2 and 18 cases with F3 or F4) resulted in varied profile. The p27 protein was found up-regulated in normal to early HCV while the p15 levels appeared to remain unal-tered in early to advanced HCV. The immunostaining of each protein was localized in the nucleus of hepatocytes (Figure 1 &2) with few cases showing positivity in portal vein area as well. Expression of p27 was detected in the liver of 30/38 (78.9%) patients with chronic HCV infec-tion. The percentage of p27 positive hepatocytes in early HCV (median = 22.6%, range = 4.3 – 37.4) was signifi-cantly higher as compared to normal liver (median = 4%, range = 1.3 – 6.3) (Mann-Whitney U test, p = 0.001) which was similar to the observations at transcriptional level. In advanced HCV the median and range of p27 expression were 17.3% and 3.0 – 32.0, respectively. The association of p27 expression with HCV-related F0 to F4 showed a significant decrease in p27 expression with the progression of fibrosis (Johnkhere Terpestra Test, p = 0.04, Figure 3). In non-viral hepatitis, p27 expression was rarely detected (see additional file 2).
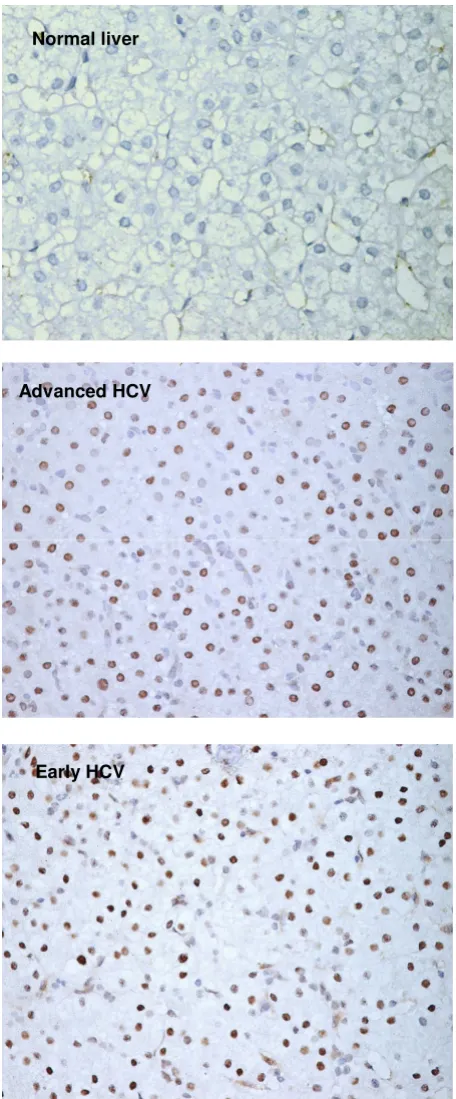
Immunostaining of p15 was not evident in normal liver and non-viral hepatitis except in 1 case see additional file 2). p15 expression was nonetheless observed in 27/38 (71%) chronic HCV infected liver tissues. In contrast to what was observed at mRNA level a non-significant decrease in p15 expression was observed in early to advanced HCV comparison (median = 25%, range = 0–39 versus 21%, range = 13–37). Likewise, no significant asso-ciation was found with the progression of fibrosis.
Protein Expression of Mitotic Checkpoint Regulators
hepa-Table 2: List of differentially expressed cell cycle genes >2 fold in early HCV relative to normal liver.
Gene Symbol Average Ct Early HCV Average Ct Normal T-test
p-value
Fold change
Cell cycle progression/cell proliferation genes
MCM2 30.85 33.4 0.05 7.670
CDC2 32.5 34.15 0.36 4.79
MCM5 28.15 29.5 0.16 3.390
MCM3 28.0 29.1 0.11 3.100
CCNE1 33.6 34.9 0.05 4.76
CDK Inhibitors
CDKN1A 27.5 28.2 0.258 2.24
CDKN1B 27.65 28.6 0.034 2.36
G2/M checkpoint gene
GADD45A 27.15 29.8 0.03 9.000
DNM2 31.75 29.6 0.005 -2.65
KPNA2 31.3 29.25 0.169 -3.730
Mitotic checkpoint genes
KNTC1 31.6 34.4 0.04 9.19
CKS1B 31.0 33.5 0.17 7.200
MAD2L1 32 34.55 0.077 7.07
CDC34 30.0 31.3 0.35 3.4
CDC16 32.6 30.8 0.027 -2.16
DNA damage response genes
CHEK1 32.35 33.70 0.24 3.09
HUS1 29.65 27.05 0.06 -4.37
Cell cycle Regulators
HERC5 29.3 33.7 0.07 20.393
CCNG2 29.85 32.3 0.11 6.400
RBBP8 31.7 30 0.108 -2.300
BCL2 29.65 31.60 0.052 3.10
UBE1 29.55 27.4 0.206 -3.500
[image:5.612.57.561.95.626.2]Table 3: List of differentially expressed cell cycle genes >2 fold in advanced HCV relative to early HCV
Gene symbol Average Ct Adv. HCV Average Ct Early HCV T-test
p-value
Fold change
Cell proliferation genes
CCND1 32.65 31.00 0.14 -2.22
CCND2 31.3 32.35 0.05 5.00
CDK2 32.1 30.3 0.6 -2.46
CDK inhibitors
CDKN2B 32.4 33.50 0.04 3.03
CDKN3 34.20 32.73 0.05 5.46
CDKN1B 29.4 27.7 0.5 -2.3
G2/M checkpoint gene
KPNA2 30.85 31.3 0.98 2.75
HERC5 33.05 29.3 0.217 -8.70
DNA damage response genes
ATR 31.9 35 0.30 10.50
RAD1 30.4 32.8 0.05 6.46
HUS1 27.55 29.65 0.05 6.06
RAD17 28.45 30.35 0.057 5.27
RPA3 33.3 35.0 0.01 4.6
*TP53 30.80 27.03 0.04 -2.79
Mitotic checkpoint regulators
MAD2L1 35 32 0.04 -5.6
CDC34 32.65 30.00 0.025 -4.4
Cell cycle regulation
CCNH 32.85 35.0 0.5 5.00
CDK8 28.7 30.5 0.07 4.92
CCNG2 27.8 29.85 0.09 5.86
CKS2 30.7 32.15 0.23 3.86
CUL1 30.6 28.3 0.65 -3.48
TFDP2 28.2 30 0.08 4.92
CCNT1 28.6 31.15 0.08 4.59
The values present average Ct values without normalization and fold differences observed in Real time PCR and p-values of T-test (values ≤ 0.05 are
Expression of CDK inhibitor p27
Figure 1
Expression of CDK inhibitor p27. Immunohistochemistry of p27 in normal liver and chronic HCV-infected liver with Early and Advanced HCV. Nuclear expression of the protein was observed in hepatocytes. Positive hepatocytes are stained brown (Mayer hematoxylin, magnification 400×).
Advanced HCV
Expression of CDK inhibitor p15
Figure 2
Expression of CDK inhibitor p15. Immunohistochemistry of p15 in normal liver and chronic HCV-infected liver with Early and Advanced HCV. Nuclear expression of the protein was observed in hepatocytes. Positive hepatocytes are stained brown (Mayer hematoxylin, magnification 400×).
Advanced HCV Normal liver
titis patients. Western blot analysis of KNTC1 detected its band in 20/25 chronic HCV patients and in 2/4 non-viral hepatitis patients (Figure 4a). A significant reduction (>2 fold, p < 0.01) in total KNTC1 levels was observed in advanced HCV as compared to early HCV (Figure 4b). The band of MAD2L1 was also detectable in 17/25 patients while in non-viral hepatitis it was not detectable (Figure 4c). Consistent with the observations at mRNA levels a slight decrease in its expression in advanced HCV group was observed but that was not found statistically signifi-cant (Figure 4d).
Discussion
[image:9.612.77.534.95.476.2]In the present study, an unbiased PCR array approach containing 84 cell cycle genes was applied on pooled RNA samples, to identify altered gene expression in HCV-asso-ciated liver disease. This analysis led to the identification of differentially expressed genes involved at cell cycle checkpoints, which may play a role in disease pathogene-sis. Further investigation at protein level of four differen-tially expressed genes, selected on the basis of their crucial role in cell cycle regulation confirms the modulations in the expression of CDK inhibitor p27 and mitotic check-point genes MAD2L1 and KNTC1. It is important to note that these cell cycle proteins have not been implicated pre-viously in chronic liver disease. Moreover, the association Negative Association of p27 with fibrosis
Figure 3
Negative Association of p27 with fibrosis. Box-plot graphic display of p27 expression in hepatocytes of chronic HCV patients grouped according to fibrosis stage. The horizontal bar in middle of the box represents the median, the box stretches between the 25th and 75th percentile, and the upper and lower lines extend to the range of the data. (Jonckeere-Terpstra test p
= 0.04).
4 3
2 1
0
Fibrosis stage
40.00
30.00
20.00
10.00
0.00
p
27 Ex
pressi
on
(%
of p27 and KNTC1 expression with liver fibrosis suggests a role of these markers in the progression of liver disease.
Persistent inflammation and cell destruction during HCV infection has been suggested to induce proliferation of normally quiescent hepatocytes [17-19], which helps in restoring liver mass and maintaining hepatic function. Moreover, previous reports including our own have shown an arrested cell cycle in hepatocytes, during HCV infection [12,13]. Consistent with these data we found more than 3 fold increase in the mRNA levels of prolifer-ation related genes Mcm-2, -3, -5, CDC2 and cyclin in early HCV group while the mRNA levels of cell cycle inhibitors p27, GADD45A, MAD2L1 and KNTC1 were also found to be significantly increased (Table 2). These
transcriptional changes suggest a mixed population of cells in the infected livers of chronic hepatitis C some of which are in proliferating state while others in an arrested state. In advanced HCV, cell cycle inhibitors p27 and MAD2L1 were found down-regulated while p15/ CDKN2B and CDKN3 were up-regulated. More than four fold increase was also observed in the mRNA levels of DNA damage response genes ATR, HUS1, RAD1, RPA3 and RAD17 (Table 3) suggesting increased DNA damage. These alterations were also accompanied by the down-reg-ulation of tumor suppressor p53. Taken together these results are suggestive of deregulated cell cycle in chronic HCV infection that is considered as a consistent event in HCC [20,21].
Reduced expression of mitotic checkpoint genes in chronic HCV patients
Figure 4
Reduced expression of mitotic checkpoint genes in chronic HCV patients. a & c) Western blotting for MAD2L1 and KNTC1 was done in total protein extracts prepared from biopsy specimens of chronic hepatitis C or Non-viral hepatitis patients (NVH). Following SDS-PAGE (12% gel) and transfer, the nitrocellulose membranes were probed with monoclonal antibodies to MAD2L1, which recognizes both phosphorylated and de-phosphorylated forms and KNTC1. b & d) Densitome-try analysis of total MAD2L1 or KNTC1 expression normalized to their respective loading controls (β-actin) was done using Image J software. The number of samples analyzed in each group (n) is indicated below each column. The p-values at the top of the column compare early HCV to advanced HCV. Represented are mean ± S.D.
a)
Stage: F0 F1 F1 F1 F2 NVH F3 F3 F4
KNTC1
Actin
b)
0.000 0.200 0.400 0.600 0.800 1.000 1.200
Kn
tc
1
/
ȕ
-a
c
tin
F0-1
F3-4
n=10 n=9 p=0.004
Stage: F0 F1 NVH F3 F3
MAD2L1
Actin c)
d)
0.00 0.10 0.20 0.30 0.40 0.50 0.60 0.70 0.80 0.90
M
A
D
2L1
/
ȕ
-a
c
ti
n
F0-1
F3-4
Association of CDK inhibitor p21 with impaired liver regeneration and progressive liver fibrosis has been reported earlier [22]. In the current study, analysis at pro-tein level by immunohistochemistry in HCV-infected hepatic biopsies showed a significant increase in the expression of p27 protein (Figure 1) that belongs to the same KIP family as p21. This protein is involved in inhib-iting cell cycle progression at both G1 and S phases and is also defined as a tumor suppressor protein [23]. Interest-ingly, an inverse relationship between p27 protein expres-sion and progresexpres-sion of liver fibrosis from F0 to F4 was found (Figure 3). It would be pertinent to mention here that mouse models of chronic injury induced-liver tumor-genesis have shown that loss of p27 in advanced stages of disease promotes tumor cell proliferation [24]. These observations signify the potential of p27 as a marker for prognostic implications in chronic HCV disease.
In contrast to p27, immunohistochemical evaluation of G1 phase inhibitor p15 revealed no significant difference in advanced HCV as compared to early HCV that conflicts with the changes observed at mRNA level. This inconsist-ency might have been due to decreased stability of p15 protein in advanced disease stages that increased the tran-scription through a regulatory feedback mechanism to maintain its levels. Another explanation for this inconsist-ency could be the use of pooled samples of whole liver lysates for mRNA expression while immunohistochemis-try was done on individual formalin fixed paraffin embed-ded biopsies. Together, the expression of p27 and p15 in non-dividing hepatocytes might represent the population of cells which are arrested in cell cycle and not participat-ing much in liver compensation, but are more active met-abolically.
Defects in chromosomal segregation are a common fea-ture of liver tumor cells suggesting a possible role of mito-sis deregulation in the pathogenemito-sis of HCC [25]. While examining the alterations of cell cycle genes in early and advanced HCV, we found altered expression of mitotic checkpoint genes, MAD2L1, KNTC1, CDC16 and CDC34. KNTC1, also known as "rough deal protein" (ROD) is part of a complex involved in elaborating an inhibitory signal due to improper chromosomal alignment during cell divi-sion [26], while member of Mad2 family, MAD2L1, par-ticipates in inhibiting Anaphase promoting complex (APC) [27] from ubiquitinating securin, whose degrada-tion is a prerequisite for sister chromatid separadegrada-tion and mitosis. Considering the crucial roles of KNTC1 and MAD2L1 in chromosomal segregation, we analyzed their respective proteins by western blotting. Results showed increased levels of both of these proteins in early HCV that is suggestive of mitotic checkpoint activation or mitotic arrest in the liver cells. This is consistent with the down-regulation of CDC16, which is a component of APC and
promote chromosomal segregation. Importantly, KNTC1 expression significantly decreases in advanced stages of HCV group as compared to early HCV while the expres-sion of MAD2L1 showed a modest reduction in advanced HCV group (Figure 4). However, a possibility of error in assessing these changes could come about due to the fact that the expression of reference gene, β-actin also increases with the progression of liver fibrosis.
The role of KNTC1 in human cancers is not well docu-mented, however, a single report describes mutation in this gene in colorectal carcinoma [28]. On the other hand, depletion or reduced expression of MAD2 gene has been reported in mammalian cells with loss of mitotic check-point and subsequent chromosomal instability [29,30]. Thus, low expression of these mitotic checkpoint regula-tors in advanced HCV might reflect loss of mitotic check-point control that could render cells to chromosomal instability. This hypothesis is also supported by a previous study which showed presence of near-aneuploidy DNA content in liver specimens from chronic hepatitis C patients [11].
The altered expression of cell cycle regulators observed in present study might be specific to hepatitis C as it was rarely observed in non-viral hepatitis patients. Neverthe-less, the low number of control liver samples, hold back in achieving statistically significant differences between the two groups, with varying degrees of fibrosis.
Conclusion
The analysis of cell cycle regulators showed altered expres-sion of G1/S and M phase inhibitors in chronic HCV infection which either arrest or delays the progression through G1 and S phase as well as M phase, latter being not reported earlier in chronic hepatitis C patients. These cell cycle perturbations might be a consequence of increased DNA damage or persistent inflammation during viral infection that in turn could increase genetic instabil-ity and cell transformation. The information presented here laid down the basis for future studies to evaluate the activation of the identified cell cycle genes in chronic hep-atitis C patients as well as HCC patients infected with HCV. These studies would be helpful to identify patients with high risk of cell transformation and HCC develop-ment.
Competing interests
The authors declare that they have no competing interests.
Authors' contributions
the manuscript. SA was involved in the analysis and inter-pretation of the data and was involved in drafting the manuscript. WJ was involved in the supervision of the study and acquisition of study samples. AS helped in the conception and design of the study and revised the man-uscript critically for important intellectual content. All authors read and approved the final version of the manu-script.
Additional material
Acknowledgements
This work was supported by a grant awarded to SS by the University Research Council, Aga Khan University, Karachi, Pakistan. We thank all the patients and the staff of Department of Radiology and Histopathology, Aga Khan University, Pakistan for their cooperation in sample collection.
References
1. Alter MJ: Epidemiology of hepatitis C virus infection. World J Gastroenterol 2007, 13(17):2436-2441.
2. Hamid S, Umar M, Alam A, Siddiqui A, Qureshi H, Butt J: PSG con-sensus statement on management of hepatitis C virus infec-tion – 2003. Jpma 2004, 54(3):146-150.
3. Raza SA, Clifford GM, Franceschi S: Worldwide variation in the relative importance of hepatitis B and hepatitis C viruses in hepatocellular carcinoma: a systematic review. British journal of cancer 2007, 96(7):1127-1134.
4. Liang TJ, Heller T: Pathogenesis of hepatitis C-associated hepa-tocellular carcinoma. Gastroenterology 2004, 127(5 Suppl 1):S62-71.
5. Tillmann HL, Manns MP, Rudolph KL: Merging models of hepatitis C virus pathogenesis. Semin Liver Dis 2005, 25(1):84-92. 6. Morgan DO: Principles of CDK regulation. Nature 1995,
374(6518):131-134.
7. Sherr CJ: Cancer cell cycles. Science 1996, 274(5293):1672-1677. 8. Houtgraaf JH, Versmissen J, Giessen WJ van der: A concise review of DNA damage checkpoints and repair in mammalian cells. Cardiovasc Revasc Med 2006, 7(3):165-172.
9. Sherr CJ, Roberts JM: CDK inhibitors: positive and negative regulators of G1-phase progression. Genes Dev 1999, 13(12):1501-1512.
10. Molinari M: Cell cycle checkpoints and their inactivation in human cancer. Cell Prolif 2000, 33(5):261-274.
11. Werling K, Szentirmay Z, Szepesi A, Schaff Z, Szalay F, Szabo Z, Tel-egdy L, David K, Stotz G, Tulassay Z: Hepatocyte proliferation and cell cycle phase fractions in chronic viral hepatitis C by image analysis method. Eur J Gastroenterol Hepatol 2001, 13(5):489-493.
12. Marshall A, Rushbrook S, Davies SE, Morris LS, Scott IS, Vowler SL, Coleman N, Alexander G: Relation between hepatocyte G1 arrest, impaired hepatic regeneration, and fibrosis in chronic hepatitis C virus infection. Gastroenterology 2005, 128(1):33-42. 13. Sarfraz S, Hamid S, Siddiqui A, Hussain S, Pervez S, Alexander G:
Altered expression of cell cycle and apoptotic proteins in chronic hepatitis C virus infection. BMC microbiology 2008, 8:133.
14. Batts KP, Ludwig J: Chronic hepatitis. An update on terminol-ogy and reporting. The American journal of surgical pathology 1995, 19(12):1409-1417.
15. Asselah T, Bieche I, Laurendeau I, Paradis V, Vidaud D, Degott C, Mar-tinot M, Bedossa P, Valla D, Vidaud M, et al.: Liver gene expression signature of mild fibrosis in patients with chronic hepatitis C. Gastroenterology 2005, 129(6):2064-2075.
16. Livak KJ, Schmittgen TD: Analysis of relative gene expression data using real-time quantitative PCR and the 2(-Delta Delta C(T)) Method. Methods (San Diego, Calif) 2001, 25(4):402-408. 17. Farinati F, Cardin R, D'Errico A, De Maria N, Naccarato R, Cecchetto
A, Grigioni W: Hepatocyte proliferative activity in chronic liver damage as assessed by the monoclonal antibody MIB1 Ki67 in archival material: the role of etiology, disease activ-ity, iron, and lipid peroxidation. Hepatology 1996, 23(6):1468-1475.
18. Freeman A, Hamid S, Morris L, Vowler S, Rushbrook S, Wight DG, Coleman N, Alexander GJ: Improved detection of hepatocyte proliferation using antibody to the pre-replication complex: an association with hepatic fibrosis and viral replication in chronic hepatitis C virus infection. J Viral Hepat 2003, 10(5):345-350.
19. Lake-Bakaar G, Mazzoccoli V, Ruffini L: Digital image analysis of the distribution of proliferating cell nuclear antigen in hepa-titis C virus-related chronic hepahepa-titis, cirrhosis, and hepato-cellular carcinoma. Dig Dis Sci 2002, 47(7):1644-1648.
20. Okada T, Iizuka N, Yamada-Okabe H, Mori N, Tamesa T, Takemoto N, Tangoku A, Hamada K, Nakayama H, Miyamoto T, et al.: Gene expression profile linked to p53 status in hepatitis C virus-related hepatocellular carcinoma. FEBS Lett 2003, 555(3):583-590.
21. Wurmbach E, Chen YB, Khitrov G, Zhang W, Roayaie S, Schwartz M, Fiel I, Thung S, Mazzaferro V, Bruix J, et al.: Genome-wide molec-ular profiles of HCV-induced dysplasia and hepatocellmolec-ular carcinoma. Hepatology 2007, 45(4):938-947.
22. Lunz JG 3rd, Tsuji H, Nozaki I, Murase N, Demetris AJ: An inhibitor of cyclin-dependent kinase, stress-induced p21Waf-1/Cip-1, mediates hepatocyte mito-inhibition during the evolution of cirrhosis. Hepatology (Baltimore, Md) 2005, 41(6):1262-1271. 23. Blain SW, Massague J: Breast cancer banishes p27 from nucleus.
Nat Med 2002, 8(10):1076-1078.
24. Sun D, Ren H, Oertel M, Sellers RS, Zhu L: Loss of p27Kip1 enhances tumor progression in chronic hepatocyte injury-induced liver tumorigenesis with widely ranging effects on Cdk2 or Cdc2 activation. Carcinogenesis 2007, 28(9):1859-1866. 25. Farazi PA, DePinho RA: Hepatocellular carcinoma
pathogene-sis: from genes to environment. Nat Rev Cancer 2006, 6(9):674-687.
26. Chan GK, Jablonski SA, Starr DA, Goldberg ML, Yen TJ: Human Zw10 and ROD are mitotic checkpoint proteins that bind to kinetochores. Nat Cell Biol 2000, 2(12):944-947.
27. Fang G, Yu H, Kirschner MW: The checkpoint protein MAD2 and the mitotic regulator CDC20 form a ternary complex with the anaphase-promoting complex to control anaphase initiation. Genes & development 1998, 12(12):1871-1883. 28. Wang Z, Cummins JM, Shen D, Cahill DP, Jallepalli PV, Wang TL,
Par-sons DW, Traverso G, Awad M, Silliman N, et al.: Three classes of genes mutated in colorectal cancers with chromosomal instability. Cancer research 2004, 64(9):2998-3001.
29. Michel LS, Liberal V, Chatterjee A, Kirchwegger R, Pasche B, Gerald W, Dobles M, Sorger PK, Murty VV, Benezra R: MAD2 haplo-insuf-ficiency causes premature anaphase and chromosome insta-bility in mammalian cells. Nature 2001, 409(6818):355-359.
Additional file 1
Bar graph of differentially expressed cell cycle genes in early and
advanced HCV. Human Cell cycle RT-PCR-Array of pooled RNA samples
from HCV infected liver specimens (early and advanced HCV) and nor-mal liver RNA sample were performed. Bars represent fold differences in mRNA levels (> 2 fold, p < 0.05) of a particular gene when comparing a) Normal liver to Early HCV and b) Early HCV to Advanced HCV. Positive fold change values indicate that the transcript is up regulated, while neg-ative values indicate that the transcript is down regulated.
Click here for file
[http://www.biomedcentral.com/content/supplementary/1471-2334-9-125-S1.ppt]
Additional file 2
Expression of CDK inhibitors in liver tissues with non-viral hepatitis.
Click here for file
Publish with BioMed Central and every scientist can read your work free of charge "BioMed Central will be the most significant development for disseminating the results of biomedical researc h in our lifetime."
Sir Paul Nurse, Cancer Research UK
Your research papers will be:
available free of charge to the entire biomedical community
peer reviewed and published immediately upon acceptance
cited in PubMed and archived on PubMed Central
yours — you keep the copyright
Submit your manuscript here:
http://www.biomedcentral.com/info/publishing_adv.asp
BioMedcentral
30. Wang X, Jin DY, Ng RW, Feng H, Wong YC, Cheung AL, Tsao SW: Significance of MAD2 expression to mitotic checkpoint con-trol in ovarian cancer cells. Cancer research 2002, 62(6):1662-1668.
Pre-publication history
The pre-publication history for this paper can be accessed here: