138 | P a g e
ECG BEAT CLASSIFICATION USING
CROSS-WAVELET AND LVQ
Priyadarshiny Dhar
1, Dr. Saibal Dutta
2, Dr.Prithwiraj Das
3,
Dr. Vivekananda Mukherjee
4, Abhijit Dhar
51
Applied Electronics & Instrumentation Engineering, Netaji Subhash Engineering College,
Panchpota,Garia, Kolkata-700152
,
West Bengal, (India)
2
Electrical Engineering, Heritage Institute of Technology,Chowbaga Road, Anandapur,
PO:East Kolkata Township, Kolkata 700 107, West Bengal, (India)
3
Associate Professor, Govt. College of Engineering and Textile Technology,
Berhampore, 742101,West Bengal, (India
)
4
Department of Electrical Engineering, Indian School of Mines,
Dhanbad - 826 004, Jharkhand, (India)
5
Consultant, BI & Data Analytics Architect, Tata Consultancy Services Ltd. West Bengal, (India)
ABSTRACT
This paper describes an automatic classification system based on combination of cross-wavelet and Learning Vector Quantization (LVQ) for the purpose of automatic heartbeat detection. The feature extractor is based on cross-wavelet approach, using the time frequency information. The ANN classifier uses a Learning Vector Quantization (LVQ) method which classifies the ECG beats into two categories: normal beats and abnormal beats. The ECG (electrocardiogram) signals in the MIT-BIH arrhythmia database are adopted as reference data. Total 98530 heart beats are used for testing the above classifier. The total classification accuracy (TCA) was about 91.66%.
Keywords: Cross-Wavelet Spectrum, Cross-Wavelet Coherence Spectrum , LVQ
I INTRODUCTION
The electrocardiogram (ECG) is the recording of the electrical property of the heartbeats, and has become one of the
most important tools in the diagnosis of heart diseases. Due to the high death rate of heart diseases, early detection
and precise discrimination of ECG arrhythmia is essential for the treatment of patients. This requisite contributes to
intensive studies in recent years for high-precision computer-aided diagnosis (CAD) systems for ECG. An effective
139 | P a g e
important, yet usually hidden, information from the raw data. Even more important is the mixing of suitable featureextractor and pattern classifier such that they can operate in coordination to make an effective and efficient CAD
system. Statistical features [2], time-domain features [3, 4] and cross-correlation based frequency–domain features
[5, 6] were used by different researchers for features extraction. In [7, 8], wavelet transform were used for features
extraction, and the authors of [9] used Lyapunov exponents for the same purpose. For classification purpose
different classifier [2 ,3, 5, 6] were used by the researchers. 21 features vector are extracted from cross-wavelet and
cross-wavelet coherence spectrum. In this paper ,LVQ classifier is used for classify normal and abnormal beats.
A brief of the topics on which the different sections are concerned is given as follows. In section 2 information about
ECG datasets used in our work is given. Section 3 gives an idea of cross-wavelet transform of two time domain
signals. Section 4 deals with the idea of Learning Vector Quantization and how it works. Performance of the
classifier scheme is shown in section 5. Section 6 describes the results obtained in this work and future research
scope using EEG signal.
II THE ACQUISITION OF ECG SIGNALS
For the analysis of cardiovascular disorders, freely available benchmark ECG signals from the MIT/BIH arrhythmia
database [1] have been utilized. This database enables researchers all over the world, to test the performance of their
arrhythmia analysis algorithms against other competing algorithms, utilizing identical benchmark signals. The
database contains 48 numbers of half-hour excerpts of two channel ambulatory ECG recording files, obtained from
47 different patients. Out of these 48 files, 23 recordings were randomly chosen and the remaining 25 files included
less common but clinically significant and threatening arrhythmic heartbeat samples. The recordings were digitized
with a sampling frequency of 360 Hz and acquired with 11-bit resolution over 10 mV ranges. Two or more
cardiologists annotated each record of MIT/BIH arrhythmia database independently, with respect to both timing
information and beat classification. The proposed algorithm has used the annotation to locate beats in ECG signals
for the classification of heart beats. This work has not been directed towards beat detection because several highly
accurate beat detection algorithms are already available in the literature. In the proposed algorithm, each ECG beat
was extracted by selecting a window of -300 ms to 400 ms around the R-wave as found in the database annotation.
Each such one dimensional signal vector comprises 252 samples. For beat extraction, first and last beat of each file
is not considered in this work because 252 samples around the R-wave may not be present in first and last beat of
each file [11].
A 6th order Butterworth band pass filter with pass band frequencies between 0.4 to 0.7 Hz is used to remove baseline wander from ECG signals. Fig.1 shows the ECG signal before and after removing the
140 | P a g e
0 50 100 150 200 250
-1 -0.5 0 0.5 1
A
m
p
li
tu
d
e
(
m
V
)
No. of Sample = 252
NORMAL HEART BEAT WITH BASELINE WANDER
0 50 100 150 200 250
-0.5 0 0.5 1 1.5
A
m
p
li
tu
d
e
(
m
V
)
No. of Sample = 252
NORMAL HEART BEAT WITHOUT BASELINE WANDER
Fig.1 ECG signals with and without baseline wander
III OVERVIEWS OF WAVELET TRANSFORM
CWT is a common tool for analyzing localized intermittent oscillations in a time series; it is very often desirable to
examine two time series together that may be expected to be linked in some way. In particular, to examine whether
regions in time frequency space with large common power have a consistent phase relationship and therefore are
suggestive of causality between the time series. Many ECG (time series) signal are not normally distributed and we
suggest methods of applying the CWT to such time series. From two CWTs we construct the Cross Wavelet
Transform (XWT) which will expose their common power and relative phase in time-frequency space. We will
further define a measure of Wavelet Coherence (WTC) between two CWT, which can find significant coherence
even though the common power is low, and show how confidence levels against red noise backgrounds are
calculated.
3.1. Cross-wavelet and wavelet coherence
The cross-wavelet transform of two time series and is defined as = , where * denote complex
conjugate . is the cross-wavelet power. The complex argument arg ( can be interpreted as the local
relative phase between and in time frequency space. The theoretical distribution of the cross wavelet power of
two time series with background power spectra is given in Torrence and Compo (1998) [10].
Another useful measure is how coherent the cross wavelet transform is in time frequency space. Following
Torrence and Webster (1998) we define the wavelet coherence of two time series as
141 | P a g e
where S is a smoothing
operator. Sample = 252
S
c
a
le
Wavelet cross spectrum of Normal & Abnormal Beat
50 100 150 200 250
4
8
16
32
64
1/32 1/16 1/8 1/4 1/2 1 2 4 8 16 32
Fig.2 Wavelet cross spectrum of Normal and Abnormal beat
Sample = 252
S
ca
le
Squared wavelet coherence between Normal & Abnormal Beat
50 100 150 200 250
4
8
16
32
64
0 0.2 0.4 0.6 0.8 1
Fig.3 Squared wavelet coherence between Normal & Abnormal Beat Fig. 2 and Fig. 3 show the Wavelet
cross-spectrum and squared cross-wavelet coherence. These are used for cross examination single normal with
arrhythmia beat. These figures also show the distinguishing regions where two signal are locally similar in time &
frequency space. It is evident from the gray-shed plots that there exist distinct variations in the spectral and
coherence components. By inspecting the plots, it has been found that most prominent variation observed in the
range of 4 to 64scales of the wavelet coefficients [11].
After applying cross-wavelet transform we have taken 21 features. These features are sufficient for the classification
142 | P a g e
IV LEARNING VECTOR QUANTIZATION
Learning Vector Quantization (LVQ) has been introduced by T. Kohonen [12] as a simple, universal and efficient
classification algorithm and has since found many applications and extensions [13].The presented work employs
Learning Vector Quantization (LVQ) algorithms for the purpose of classification of ECG beats. LVQ is a supervised
version of vector quantization that can be used when we have labelled input data. This learning technique uses the
class information to reposition the Voronoi vectors slightly, so as to improve the quality of the classifier decision
regions. It is a two stage process – a SOM followed by LVQ. LVQ is a local classification algorithm, where the
classification boundaries are approximated locally. The difference is that instead of using all the points in the
training dataset, LVQ uses only a set of appropriately chosen prototype vectors. This way the classification method
is much more efficient, because the number of vectors that should be stored and compared with is significantly
reduced. In addition, a carefully chosen prototype set can greatly increase classification accuracy on noisy problems.
There are several different LVQ algorithms that deal with the updates of the prototypes in different
ways.
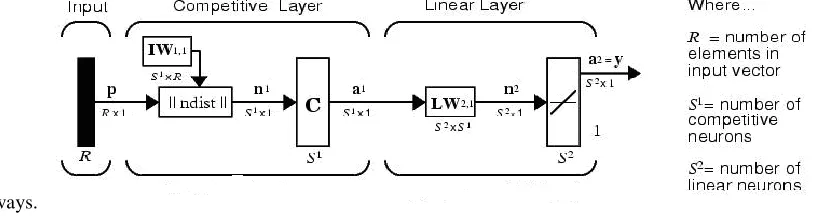
Fig. 4 Architecture of LVQ classifier
In our proposed approach, the optimized learning rate LVQ1 and LVQ2.1 algorithms have been used for training
and fine-tuning purposes respectively [14,15].
LVQ network has a first competitive layer and a second linear layer. The linear layer transforms the competitive
layer’s classes into target classifications defined by the user. Both the competitive and linear layers have one neuron
per (sub or target) class. Thus, the competitive layer can learn up to S1 subclasses. These, in turn, are combined by the linear layer to form S2 target classes. (S1 is always larger than S2.) In Fig.4 P is input vector with R elements and IW1,1 is the weights matrix of neurons in competitive layer . Each row in this matrix is the weights of one neuron.
||ndist|| block computes the distance of input vector P from weight vectors of each neuron. Thus if the number of
competitive layer neurons were S1, then IW1,1 is S1 by R matrix. In this case the ||ndist|| output, that determined by
n1 in figure, is an s1 element vector that each element is the distance of input to one neuron. The C block is a
competitive function that its output (a1) is a vector with one element equal 1 and others equal 0. The element that
equals 1, determines the input subclass. In linear layer, the target class is determined. The neurons number in linear
143 | P a g e
in linear layer. This layer determines the subclasses of each target class. In LVQ1, for a given M-dimensionalinputvector p, an M-dimensional code word wk is found such that
(2)
The code word is then updated as follows:
(3)
Where s(t)=+1 if p and are in same class and s(t)=-1, otherwise; is the time varying learning rate. The other
code words in the code book remain unchanged. LVQ2.1 applied after first applying LVQ1. It can improve the
result of the first learning. In LVQ2.1 algorithm, two vectors of layer 1 that are closest to the input vector can be
updated, provided that one belongs to the correct class and one belongs to a wrong class, and further provided that
the input falls into a "window" near the midplane of the two vectors. The window is defined by
where di and dj are the Euclidean distances of p from wi and . Here each M-dimensional p and wk vectors can be
denoted as: p = {p1, p2, ..., pm, ..., pM} and wk = {wk1, wk2, ..., wkm, ..., wkM}.
In this work LVQ classifier is used to classify normal and abnormal beats of ECG signal. Usually the classification
results obtained with LVQ2.1 algorithm are more robust than with LVQ1 algorithm. The usual practice is to employ
the LVQ2.1 algorithm after the LVQ1 algorithm has been implemented.
V PERFORMANCE EVALUATIONS
The training dataset contains 815 normal beats and 815 arrhythmia beats. Total 98530 heart beats are tested from 43
files. Less than 2% of total heart beats
are used for train the classifier. Heart beat in file #100_19 is taken as reference normal heart beat. The total accuracy
of the classifier for each record is determined using the following formula:
TCA =
=
Where (true positive) denote the total number of heart beats that are correctly classified (normal as well as
arrhythmia), and represent the total number of heart beats present in each record.
144 | P a g e
The total accuracy obtained with 14 features vector is 91.66%. Using the same features vector, classified normalbeat accuracy and classified arrhythmia beat accuracy are found to be 94.72% and 84.05% respectively.
Classification result as shown in table.2
Table.1 Maximum classified normal and
Arrhythmia beat based on different feature sets
Feature set Total classification Accuracy (TCA)% % of Classified Normal Beat
% of Classified Arrhythmia
Beat
89.399 91.9 83.68
14 91.65 94.72 84.05
18 88.29 88.44 87.89
21 96.66 90.24 87.23
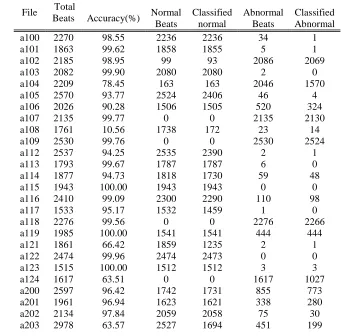
Table. 2: Classified normal and abnormal beats using
14 feature vectors
File Total
Beats Accuracy(%) Normal Beats Classified normal Abnormal Beats Classified Abnormal
a100 2270 98.55 2236 2236 34 1
a101 1863 99.62 1858 1855 5 1
a102 2185 98.95 99 93 2086 2069
a103 2082 99.90 2080 2080 2 0
a104 2209 78.45 163 163 2046 1570
a105 2570 93.77 2524 2406 46 4
a106 2026 90.28 1506 1505 520 324
a107 2135 99.77 0 0 2135 2130
a108 1761 10.56 1738 172 23 14
a109 2530 99.76 0 0 2530 2524
a112 2537 94.25 2535 2390 2 1
a113 1793 99.67 1787 1787 6 0
a114 1877 94.73 1818 1730 59 48
a115 1943 100.00 1943 1943 0 0
a116 2410 99.09 2300 2290 110 98
a117 1533 95.17 1532 1459 1 0
a118 2276 99.56 0 0 2276 2266
a119 1985 100.00 1541 1541 444 444
a121 1861 66.42 1859 1235 2 1
a122 2474 99.96 2474 2473 0 0
a123 1515 100.00 1512 1512 3 3
a124 1617 63.51 0 0 1617 1027
a200 2597 96.42 1742 1731 855 773
a201 1961 96.94 1623 1621 338 280
a202 2134 97.84 2059 2058 75 30
145 | P a g e
a205 2654 98.94 2569 2569 85 57
a207 1858 94.73 0 0 1858 1760
a208 2951 90.34 1585 1567 1366 1099
a209 3003 87.21 2619 2618 384 1
a210 2638 95.30 2421 2412 217 102
a213 2897 98.55 2639 2638 258 217
a215 3361 95.03 3193 3136 168 58
a217 2206 92.57 244 243 1962 1799
a219 2152 99.07 2080 2077 72 55
a220 2046 95.41 1952 1952 94 0
a221 2425 99.34 2029 2029 396 380
a222 2481 76.10 2060 1886 421 2
a223 2603 89.86 2027 2009 576 330
a228 2051 98.78 1686 1679 365 347
a230 2254 99.91 2253 2251 1 1
a233 3077 95.22 2229 2110 848 820
a234 2751 98.18 2698 2698 53 3
Total
Beat 98530 73740 69848 24790 20838
Accuracy: 91.65% Classified Normal beats: 94.722%
Classified Abnormal beats:
84.05%
VI CONCLUSION
In this paper, the LVQ neural network and the cross-wavelet Transform have been used to distinguish normal and
arrhythmia beats. The performance of the proposed scheme has been tested using benchmark signals available in
MIT/BIH arrhythmia database, where a small sized training file and large-sized testing file was used to demonstrate
the generalization capability of the system, when presented with unknown inputs. An overall classification accuracy
of 91.66% was achieved over the 43 files of the database. Future work can be done by classifying all the beats in the
manner recommended by Association for the Advancement of Medical Instrumentation (AAMI) of the dataset
instead of binary classification.
REFERENCES
1. Mark R, Moody G. MIT-BIH arrhythmia database; 1997 [Online] Available:
http://www.physionet.org/physiobank/database/mitdb .
2. M. Wiggins, A. Saad ,B.Litt and G. Vachtsevanos, “Evolving a Bayesian classifier for ECG-based age
classification in medical applications,” Applied Soft Computing 8 (2008) 599–608.
3. Yun-Chi Yeh, Che Wun Chiou, Hong-Jhih Lin, “Analyzing ECG for cardiac arrhythmia using cluster
analysis,” Expert Systems with Applications 39 (2012) 1000–1010.
4. Berat Do˘gan , Mehmet Korurek, “A new ECG beat clustering method based on kernelized fuzzy c-means
and hybrid ant colony optimization for continuous domains,” Applied Soft Computing 12
146 | P a g e
6. Saibal Dutta, Amitava Chatterjee and Sugata Munshi, “Correlation technique and least square supportvector machine combine for frequency domain based ECG beat classification,” Medical Engineering &
Physics 32 (2010) 1161–1169.
7. Saibal Dutta, Amitava Chatterjee and Sugata Munshi, “Identification of ECG beats from cross-spectrum
information aided learning vector quantization,” Measurement 44 (2011) 2020–2027.
8. Hari Mohan Rai , Anurag Trivedi, Shailja Shukla , “ ECG signal processing for abnormalities detection
using multi-resolution wavelet transform and Artificial Neural Network classifier,” Measurement 46
(2013) 3238–3246.
9. Swati Banerjee, and Madhuchhanda Mitra, “Application of Cross Wavelet Transform for ECG Pattern
Analysis and Classification,” IEEE Transactions on Instrumentation and Measurement, Vol.63,No.2 Feb
2014.
10.Elif Derya Übeyli, “Adaptive neuro-fuzzy inference system for classification of ECG signals using
Lyapunov exponents,” computer methods and programs in biomedicine 93 (2009 ) 313–321.
11. Torrence, C. and Compo, G. P.: A practical guide to wavelet analysis, Bull. Am. Meteorol. Soc., 79, 61–78,
1998.
12. Priyadarshiny Dhar, Dr. Saibal Dutta, Dr. Prithwiraj Das & Dr. Vivekananda Mukherjee “Cross-wavelet
Aided ECG Beat Classification using LIBSVM” Computer Methods in Biomechanics and Biomedical
Engineering :Imaging & Visualization (Accepted for publication).
13. T. Kohonen, The Self-organizing Map, Proceedings of the IEEE , pp. 1464-1480, 1990
14. Neural Networks Research Centre Helsinki Univ. of Tech., Bibliography on the Self-Organizing Map
(SOM) and Learning Vector Quantization (LVQ),
http://liinwww.ira.uka.de/bibliography/Neural /SOM.LVQ.html, 2002.
15. S. Haykin, Neural Networks: A Comprehensive Foundation, seconded., Pearson Education, New York,
1999
16. L. Fausett, Fundamentals of Neural Networks, Pearson Education,