R E S E A R C H A R T I C L E
Open Access
Early and late effects of objecthood and spatial
frequency on event-related potentials and
gamma band activity
Matt Craddock
1,2, Jasna Martinovic
3and Matthias M Müller
1*Abstract
Background:The visual system may process spatial frequency information in a low-to-high, coarse-to-fine sequence. In particular, low and high spatial frequency information may be processed via different pathways during object recognition, with LSF information projected rapidly to frontal areas and HSF processed later in visual ventral areas. In an electroencephalographic study, we examined the time course of information processing for images filtered to contain different ranges of spatial frequencies. Participants viewed either high spatial frequency (HSF), low spatial frequency (LSF), or unfiltered, broadband (BB) images of objects or non-object textures, classifying them as showing either man-made or natural objects, or non-objects. Event-related potentials (ERPs) and evoked and total gamma band activity (eGBA and tGBA) recorded using the electroencephalogram were compared for object and non-object images across the different spatial frequency ranges.
Results:The visual P1 showed independent modulations by object and spatial frequency, while for the N1 these factors interacted. The P1 showed more positive amplitudes for objects than non-objects, and more positive amplitudes for BB than for HSF images, which in turn evoked more positive amplitudes than LSF images. The peak-to-peak N1 showed that the N1 was much reduced for BB non-objects relative to all other images, while HSF and LSF non-objects still elicited as negative an N1 as objects. In contrast, eGBA was influenced by spatial frequency and not objecthood, while tGBA showed a stronger response to objects than non-objects.
Conclusions:Different pathways are involved in the processing of low and high spatial frequencies during object recognition, as reflected in interactions between objecthood and spatial frequency in the visual N1 component. Total gamma band seems to be related to a late, probably high-level representational process.
Keywords:Electroencephalography (EEG), Oscillations, Gamma band, Object recognition
Background
The visual system parses an enormous amount of infor-mation in order to make sense of the world. Several models of the visual system describe a coarto-fine se-quence of parsing of visual information imposed by differ-ential processing of spatial frequencies [1-3]; specifically, low spatial frequencies (LSF) are privileged at early pro-cessing stages whereas high spatial frequencies (HSF) are privileged at later processing stages. Early, rapid process-ing of LSF via the magnocellular visual pathway and orbito-frontal cortex may have a critical role in object
recognition: LSF provide information at a coarse scale, and since they vary slowly across space, they provide rela-tively clear information and a stable estimate of the global shape of an object or scene. LSF provide sufficient coarse information to allow a reasonable guess at the identity of an object and guide subsequent processing of HSF in ven-tral visual cortices [4]. The global precedence effect, in which the global shape of a hierarchical form is recognized faster than the local shapes which constitute it, may be underpinned by speeded processing of LSFs [5-7]. HSF vary much more rapidly across space, providing noisier, less stable information which is nevertheless more specific to the exact object or scene which is seen [8]. Thus, HSFs support finer analysis, such as the identification of the * Correspondence:[email protected]
1Institute of Psychology, University of Leipzig, 04109 Leipzig, Germany
Full list of author information is available at the end of the article
local shapes, or discriminations between subordinate object categories [9].
Event-related potentials (ERPs) are a valuable tool for examining the temporal evolution of neural activity, and thus provide a window into early interactions between objecthood and spatial frequency. Previous ERP experi-ments have examined the effects of differing spatial fre-quency bands in face and object recognition on the early perceptual P1 and N1 components, with somewhat mixed results. For example, Pourtois, Dan, Grandjean, Sander and Vuilleumier [10] found the P1 was enhanced for unfil-tered faces relative to either high or low frequency filunfil-tered faces, and that the N170 was almost abolished for filtered faces. In contrast, Nakashima et al. [11] found a greater positivity in the P1 to LSF faces and a greater negativity in N170 to HSF faces. However, we also previously found a greater positivity in the P1 and greater negativity in the N1 for HSF relative to LSF objects using a categorization task [12]. However, we did not directly contrast responses to objects with responses to non-objects, and thus it is not clear whether the differences in responses reflect an object-specific method of processing stimuli or a more general property of the visual system.
Additionally, there are obvious parallels between early and late processing stages in models such as Bar et al.’s [4] and patterns of oscillatory activity in the gamma (>30 Hz) frequency band [13] typically observed during object recognition. Gamma band activity (GBA) may fulfil several critical roles in visual perception (see [14] for a recent review), and in the context of object recog-nition may reflect synchronization of disparate neural populations representing individual features of an ob-ject, and their binding into a unified percept. An early, evoked (time- and phase-locked) GBA (eGBA) signal is typically observed 50–150 ms after stimulus onset as a clear peak in the lower gamma frequency range (30–40 Hz). eGBA is highly sensitive to low-level stimulus properties such as complexity [15] and size [16], but generally does not differ between familiar and unfamiliar objects [15,17-20]. Fründ, Busch, Körner, Schadow, and Herrman [21] found a stronger early (60–120 ms) eGBA response and greater phase-locking to low frequency sine- or square-wave gratings (1 cycle per degree; cpd) than to high frequency gratings (10 cpd), and speculated that eGBA predominantly re-flects magnocellular pathway excitation.
In contrast,induced–neither time- nor phase-locked– GBA (iGBA) is increased for familiar relative to unfamiliar objects in a window approximately 200–400 ms after stimulus onset ([15], [17], [19], e.g. [22]). Although iGBA findings might be compromised by a muscle artefact arising from miniature eye movements [23], correction methods for such artefacts now exist [24,25] and allow once again the examination of gamma band activity.
Unlike eGBA, iGBA is relatively insensitive to low-level stimulus properties such as complexity [15]. Neverthe-less, it may be sensitive to spatial frequency: Adjamian et al. [26] found that iGBA recorded using MEG peaked in response to stimuli with a spatial frequency between 2– 4 cpd. Hadjipapas et al. [27] found much greater increases in iGBA for 3.5 or 6 cpd gratings than for 0.5 cpd gratings. However, the stimuli in both of these studies were sine- or square-wave gratings, and the suggested neural sources were in early visual cortices. It is not clear whether these findings would extend to GBA in relation to more com-plex stimuli or originating in higher-order visual cortices. The hypothesized representational role of the iGBA and its relatively late latency would suggest that it should be relatively unaffected by low-level factors such as spatial frequency.
unwanted frequencies into the supposedly “induced” response [29].
Methods Participants
We recruited fifteen participants (ages 19 – 32, mean = 24 years) from the participant database of the University of Leipzig EEG-Laboratory. Thirteen were right-handed, 2 left-handed. Three were male, 12 female. The study con-formed to the Code of Ethics of the World Medical Asso-ciation and was approved by the local ethics committee of the University of Leipzig. Individual written informed con-sent was obtained. Subjects either received class credit or a small honorarium for participating.
Stimuli and apparatus
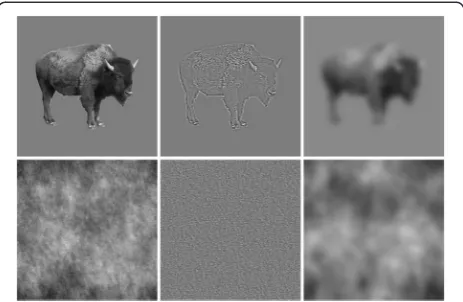
Two-hundred and forty grayscale photographs depicting a single object against a neutral grey background were drawn from a commercial image database (Hemera Photo Objects). One-hundred and twenty of these photographs were of man-made objects, such as items of furniture; the other 120 were of natural objects, such as animals or fruit. Each stimulus (including the surrounding grey back-ground) was 400 × 400 pixels. To create HSF and LSF ver-sions of each object, we first converted each broadband image to the frequency domain using the fast Fourier transform. We then multiplied the amplitude of the fre-quency spectrum with a Gaussian low-pass filter with a cut-off at ~4.7 cycles per degree for HSF images or high-pass filter with a cut-off at ~0.9 cpd for LSF images. To produce non-object noise textures corresponding to the HSF, BB, and LSF images, we randomized the phase of the frequency spectrum of each unfiltered and filtered image. Thus, each noise texture had the identical amplitude spectrum and spatial frequency content as the image from which it was derived. We also matched the mean (global luminance) and standard deviation (RMS con-trast) of every image to the mean global luminance and RMS contrast of the full set of BB images. Partici-pants viewed the stimuli on a 17″ monitor (refresh rate 85 Hz) at a screen resolution of 1024 × 768 pixels from a distance of 80 cm. At this distance, the stimuli subtended approximately 10 degrees of visual angle in each direction (Figure 1).
Design
We manipulated two factors: Object (object or non-object noise texture) × Spatial Frequency (HSF, BB, LSF). There were 480 trials in total, with 80 trials per condition. In object conditions, half of the trials showed natural objects, while half showed man-made objects. The objects pre-sented in each condition were counterbalanced across par-ticipants, such that each object was presented an equal number of times in every condition once data from all
participants was collected. The order of presentation of the stimuli was randomized for each participant. Trials were split into six blocks of 80, to allow brief rest periods for participants during the EEG recording.
Trials began with a white fixation cross on a black background presented for a randomly varying period of 500–800 ms. The fixation cross was then removed and a stimulus image presented for 500 ms, after which the image disappeared and was replaced with a fixation cross for 1000 ms. The screen was then blank for a variable period of 900–1200 ms. Participants were encouraged to use this time to blink, and avoid making eye movements or blinks while a stimulus or fixation cross was visible on screen. To respond, participants pressed different buttons to indicate whether each image showed a natural object, a man-made object, or a non-object texture. For analysis, we collapsed responses across man-made and natural ob-jects, since our primary interest was in the contrast be-tween objects and non-objects. Participants were given a practice block of 54 trials, in which we presented images created in the same way as those used in the actual experi-ment but drawn from a different set of objects. The Cogent toolbox for Matlab (Cogent, www.vislab.ucl.ac.uk/ Cogent/; The Mathworks, Inc, Natick, Massachusetts) controlled the presentation of the stimuli.
Behavioural data analysis
[image:3.595.306.538.89.240.2]object as a non-object, and any non-object as an ob-ject. Additionally, trials on which responses were not made were also counted as errors. Where necessary, Greenhouse-Geisser correction was used in cases of violations of sphericity, and significant effects were examined using post-hoc t-tests with Bonferroni-Holm correction for multiple comparisons. Generalized eta-squared is reported as a measure of effect size [30].
EEG recording and analysis
We recorded continuous EEG from 64 locations at a sampling rate of 512 Hz using active Ag-AgCl electrodes connected to a BioSemi Active-Two amplifier system (BioSemi, Amsterdam, The Netherlands). Whereas many EEG amplifiers have a separate,“ground”electrode, the Bio-Semi system has two active electrodes placed close to elec-trode POz of the international 10–20 system [31]: Common Mode Sense (CMS) acts as a recording reference and Driven Right Leg (DRL) serves as ground [32,33]. We also used four electrooculograms (EOG)–above and below the right eye and outer canthi of each eye–in order to exclude arte-facts related to blinks and eye movements. Initial EEG data processing was performed using the EEGLAB [34] toolbox with in-house procedures running under the Matlab environment (The Mathworks, Inc, Natick, Massachusetts). The Fully Automated Statistical Thresh-olding for EEG Artifact Rejection (FASTER) EEGLAB plug-in was used to reject artefacts and plug-interpolation of globally and locally artefact contaminated channels [35]. We corrected for miniature saccade artefacts following Keren et al.’s [25] approach, using the microDetect EEGLAB plug-in (https://github.com/craddm/microDetect).
ERP analysis
A 40 Hz low-pass Butterworth filter was applied to the data before conducting event-related potential (ERP) analyses. We assessed the P1 (85–130 ms) and N1 (145–220 ms) at two lateral occipital electrode pairs (P7/PO7 and P8/PO8) at which effects of object category are often displayed, typic-ally with enhanced negativity for individual categories such as faces ([36], the N170, e.g. [37]) or cars [38]. We defined the clusters of electrodes and appropriate time windows for ERP analyses on the basis of visual inspection of grand mean plots. Note that since the studied components are well established, with typical time-windows and topograph-ies, circularity in this selection is minimal [39]. We used the ERPLAB (http://erpinfo.org) plug-in for EEGLAB to calcu-late the mean amplitude and local peak calcu-latency for each component after subtracting the mean amplitude of a base-line window from 200 ms prior to stimulus onset until stimulus onset from each time point. To detect local peak latency, ERPLAB searched over the time periods specified above for the most positive (for the P1) or most negative (N1) amplitude which was not surpassed within ±9.8 ms
(5 sampling points). This helps to prevent the detection al-gorithm from selecting values from the rising edge of a slope at the extremes of the time window. For example, if both the peak of the P1 and the beginning of the transition to a P2 are within the selected time range, then the peak of the P1 should be selected rather than the rising P2 slope. The absolute peak was taken if no local peak was found. The detected peaks were visually inspected for each partici-pant to ensure that the appropriate peaks were captured. The P1 and N1 were analysed using a repeated-measures ANOVA with the factors Object (Object, Non-Object), Spatial Frequency (HSF, BB, and LSF) and Hemisphere (Left, Right). All trials were included in the analyses, includ-ing response errors; thus, as recommended by VanRullen [40], the data were not conditioned on participant’s be-havioural performance. Where necessary, Greenhouse-Geisser correction was used in cases of violations of sphericity, and significant effects were examined using post-hoc t-tests with Bonferroni-Holm correction for mul-tiple comparisons. Generalized eta-squared is reported as a measure of effect size [30].
Time-frequency analysis
with the factors Object (Object or Non-Object) and Spatial Frequency (HSF, BB, or LSF).
For tGBA, we examined two bilaterally symmetric pos-terior clusters, which correspond to areas where tGBA is typically found after correction for miniature saccade arte-facts [12,24,25]. We chose individual peak frequencies on the basis of grand mean activity averaged across all condi-tions for each individual participant, and analysed tGBA from 200 ms after stimulus onset until stimulus offset (500 ms), averaging across both the peak frequency and one frequency bin on each side of that frequency (i.e. for a peak frequency of 62 Hz, we averaged across the fre-quency range 58–66 Hz). tGBA was examined using a re-peated measures ANOVA with the factors Object (Object or Non-Object) and Spatial Frequency (HSF, BB, or LSF).
Results
Behavioural data
Participants responded slower [F(1,14) = 80.38, p< .001,
ƞ2
g. = .28] and made more errors [F(1,14) = 62.27,p< .001,
ƞ2
g. = .53] when responding to objects (648 ms; 7% errors, of which 5% were incorrectly categorizing an object, 1% categorization of an object as a non-object, and 1% missed responses) than to non-objects (541 ms; 1%).
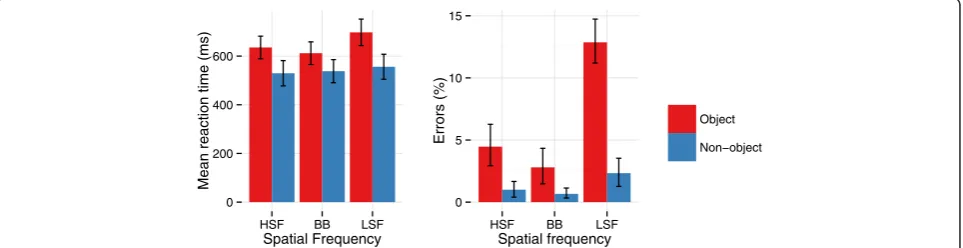
There were significant main effects of Frequency for RTs [F(2,28) = 92.08, p< .001,ƞ2g. = .06] and errors [F(2,28) = 68.59,p< .001,ƞ2g. = .5]. Participants responded fastest and most accurately to BB (575 ms, 2% errors) images, with slower but as accurate responses to HSF images (582 ms; 3%), and the slowest and least accurate responses to LSF images (627 ms, 8%).
There was a significant interaction between Object and Frequency for RTs [F(2,28) = 40.72,p< .001,ƞ2g. = .03] and errors [F(2,28) = 44.90, p< .001, ƞ2g. = .34], see Figure 2. Post-hoc tests indicated that RTs were significantly slower when an object was present than when there was no ob-ject on LSF (p< .001) and HSF trials (p= .02), while there were no significant differences between objects and non-objects on BB trials (p= .2). Additionally, responses to ob-jects on LSF trials were slower than responses to both BB and HSF non-objects (bothps < .001), while responses on
HSF object trials were slower than responses on BB (p= .04) non-object trials. There were significantly more er-rors committed for LSF objects than in any other condition (allps < .001). There were also significantly more errors for HSF objects than for BB (p= .002) and HSF (p= .005) non-objects. There were no significant differences in errors be-tween BB objects and non-objects (p= .2) or HSF objects and non-objects (ps = .4). Errors did not significantly differ across frequency for any non-objects (ps > .4).
Event-related potentials
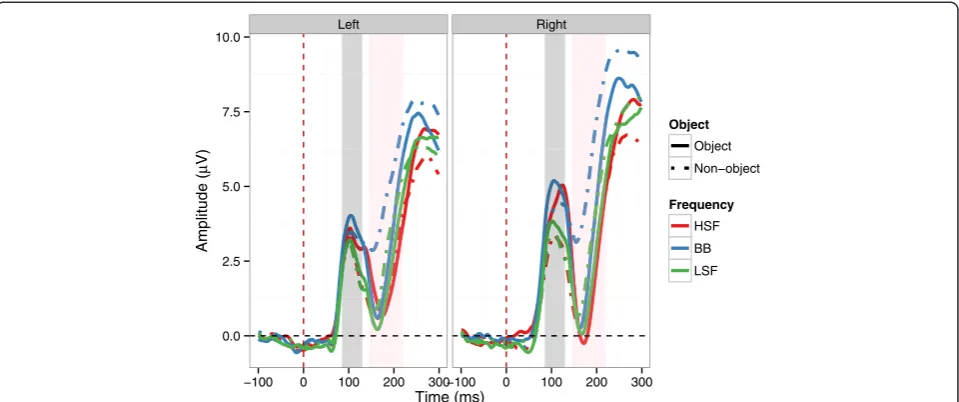
In our analysis of P1 mean amplitudes, there was a sig-nificant main effect of Object [F(1,14) = 14.59, p= .002,
ƞ2
g. = .02], with more positive amplitudes on object (3.67 μV) relative to non-object (3.05 μV) trials. Fur-thermore, there was a significant main effect of Spatial Frequency [F(2,28) = 17.95,p< .001,ƞ2g. = .04]. Pairwise comparisons between each level of Spatial Frequency re-vealed that amplitudes were more positive for BB images (3.91μV) than for HSF (3.26μV;p< .001) and LSF images (2.93 μV; p< .001). Responses to HSF images were also significantly higher than to LSF images, despite the notice-ably smaller difference (p= .01). Finally, there was a sig-nificant main effect of Hemisphere [F(1,14) = 6.54,p= .02,
ƞ2
g. = .04], with significantly more positive amplitudes in the right hemisphere (3.80 μV) than the left hemisphere (2.93 μV). No interactions were significant (all ps > .08). See Figures 3 and 4 for an overview. For P1 peak latency, no effects were significant (allps > .08).
In our analysis of N1 mean amplitudes, there was a significant main effect of Object [F(1,14) = 5.07, p= .04,
ƞ2
g. = .03], with a more negative N1 amplitude for objects (2.1μV) than for non-objects (3.22 μV). There was also a significant main effect of Spatial Frequency [F(2,28) = 33.71, p< .001ƞ2g. = .08], with more a negative N1 amplitude for HSF images (1.70μV) than for BB (3.91μV;p< .001) and LSF (2.36μV;p= .01) images. LSF images were also more negative than BB images (p< .001). However, there was a significant interaction between Object and Spatial Fre-quency [F(2,28) = 6.08,p< .001,ƞ2g. = .02], see Figures 3 and 5. The N1 was significantly more negative for BB objects
0 200 400 600
HSF BB LSF
Spatial Frequency
Mean reaction time (ms)
0 5 10 15
HSF BB LSF
Spatial frequency
Errors (%)
Object
[image:5.595.58.540.591.715.2]Non−object
than for BB non-objects (p< .001), and more negative for LSF objects than for LSF non-objects (p= .03). However, there was no significant difference between HSF objects and HSF non-objects (p= 1). Thus, the N1 was sensitive to objecthood for BB and LSF but not HSF images. The N1 was also significantly more negative for HSF (p= .003) and LSF objects (p= .02) than for BB objects. Indeed, BB non-objects elicited significantly more positive amplitudes than any other combination of object and spatial frequency (all ps < .001). Neither the main effect of Hemsiphere nor any of the interactions involving Hemisphere were significant (allps > .2).
For N1 latencies, there were significantly longer peak latencies [F(1,14) = 8.56, p= .01, ƞ2g. = .04] for objects (173 ms) than for non-objects (165 ms). There was also
a significant main effect of Spatial Frequency [F(2,28) = 6.48, p= .005, ƞ2g. = .02], with significantly longer peak latencies for HSF images (173 ms) than for LSF images (166 ms). Peak latencies to BB images (168 ms) did not significantly differ from those for HSF or LSF images.
Peak-to-peak analysis
In order to rule out the possibility that effects we observed in the N1 amplitude were carry-over effects from the P1, we also tested peak-to-peak amplitudes. We extracted the peak amplitude of each condition for the P1 and N1 and subtracted the N1 amplitude from the P1 amplitude, allowing us to quantify the N1 effects independently from the P1. We analysed peak-to-peak amplitudes with a re-peated measures ANOVA with the factors Object (Object,
Left Right
0.0 2.5 5.0 7.5 10.0
−100 0 100 200 300−100 0 100 200 300
Time (ms)
Amplitude (
V)
Object Object Non−object
[image:6.595.59.539.89.290.2]Frequency HSF BB LSF
Figure 3ERP time course at the left and right parieto-occipital clusters. Solid lines show responses to objects, dashed lines responses to non-objects.Red lines indicate responses to HSF images; blue lines indicate responses to BB images; green lines indicate responses to LSF images. Shaded grey area indicates P1 time window; shaded pink area indicates N1 time window.
[image:6.595.58.540.569.704.2]Non-Object), Spatial Frequency (HSF, BB, LSF), and Hemisphere (Left, Right).
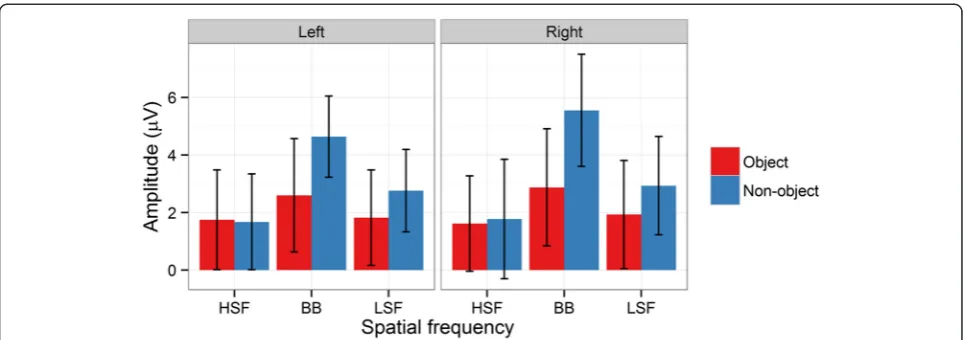
There were significantly greater N1 amplitudes (i.e. a greater negative going deflection) for objects relative to non-objects [F(1,14) = 7.40,p= .02,ƞ2g. = .04]. There were no significant main effects of Spatial Frequency [F(2,28) = 2.33, p= .1, ƞ2g. = .003] or Hemisphere [F(1,14) = 1.81, p= .2,ƞ2g. = .02]. However, there were significant interac-tions between Object and Spatial Frequency [F(2,28) = 5.82, p= .003, ƞ2g. = .02] and Object, Spatial Frequency, and Hemisphere [F(2,28) = 3.68, p= .04, ƞ2g. = .003], see Figures 3 and 6. Significant two-way interactions should be considered cautiously when a three-way interaction is present. Nevertheless, in post-hoc tests the two-way inter-action was driven by a significantly less negative N1 for BB non-objects than for BB (p= .005), LSF (p= .02) and HSF (p= .02) objects. Furthermore, it was less negative for BB non-objects than for LSF non-objects (p= .002), with marginal differences from HSF non-objects (p= .05). Other comparisons were not significant (ps > .2).
For the three-way interaction, no comparisons were sig-nificant (all ps > .07), rendering statistical decomposition of the interaction difficult. Inspection of Figures 3 and 6 suggests that the interaction is due to two small differ-ences in the pattern across hemispheres. The difference between BB objects and non-objects is present in both left and right hemispheres. However, the smaller difference between HSF objects and non-objects present in the right hemisphere is absent from the left hemisphere. Similarly, a small difference between LSF objects and non-objects is apparent in the left hemisphere but absent from the right hemisphere.
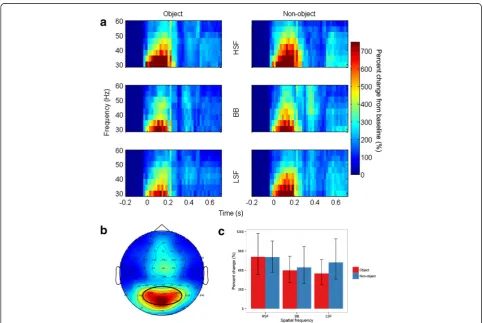
Evoked gamma band
[image:7.595.57.540.88.258.2] [image:7.595.58.540.570.704.2]As predicted, there was no effect of Object [F(1,14) = 1.30, p= .3,ƞ2g. = .005] on evoked gamma band activity. How-ever, there was a significant effect of Spatial Frequency [F(2,28) = 5.29, p= .01, ƞ2g. = .02]. The change in evoked gamma band activity was significantly greater for HSF (805%) than BB (619%; p= .04) images. The difference Figure 5N1 mean amplitudes for the interaction between object and spatial frequency at left and right hemisphere electrode clusters. Error bars depict bootstrapped 95% confidence intervals.
between HSF and LSF images (634%) was marginal (p= .06), while the difference between LSF and BB images was clearly not significant (p= .8). Finally, the interaction between Object and Spatial Frequency was not significant [F(2,28) = 0.53,p= .6,ƞ2g. = .005], see Figure 7.
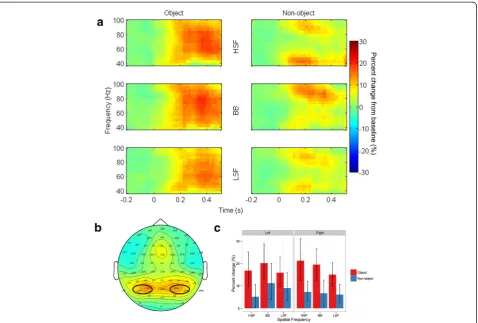
Total gamma band
Total gamma band activity showed a significantly greater increase [F(1,14) = 28.3, p< .001, ƞ2g. = .14] relative to baseline for objects (18.1%) than for non-objects (7.6%). Neither the main effects of Spatial Frequency [F(2,28) = 2.44, p= .1, ƞ2g. = .008] nor Hemisphere [F(1,14) = .03, p= .9,ƞ2g. < .001] were significant. Importantly, the two-way interaction between Object and Spatial Frequency was not significant [F(2,28) = 1.36,p= .3,ƞ2g. = .008], see Figure 8. However, there was a significant interaction be-tween Spatial Frequency and Hemisphere [F(2,28) = 5.86, p= .007, ƞ2g. = .01]. Although no comparisons were sig-nificant in post-hoc follow-up tests (all ps > .1), this interaction was likely driven by smaller gamma band re-sponses to HSF images in the left hemisphere than the right hemisphere. Note that, although Figure 8 shows
the three-way interaction between Object, Spatial Fre-quency, and Hemisphere, this interaction was not sig-nificant [F(2,28) = 0.17, p= .8, ƞ2g. < .001]. No other interactions were significant (allps>.3).
Discussion
[image:8.595.56.540.361.684.2]We presented high spatial frequency (HSF), low spatial frequency (LSF), and broadband (BB) images of objects and non-objects and asked participants to categorize each image as depicting a living or non-living object, or as a non-object. Models of visual object processing in which processing of LSF precedes processing of HSF, or in which different ranges of spatial frequencies are proc-essed via different pathways [4], would predict early dif-ferences in spatial frequency processing. As predicted, we found that the P1 was sensitive to spatial frequency; unexpectedly, we found that objects also provoked a higher amplitude response than non-objects in the P1. However, these factors did not interact. We also found effects of spatial frequency and objecthood in the N1, but, in contrast to the P1, we found that they interacted. Our peak-to-peak analysis suggests the N1 was partially
moderated by the P1 since it yielded different results to our analysis N1 mean amplitudes. It revealed slight differ-ences across hemispheres which were otherwise not ap-parent, but, more importantly, a clear interaction between objecthood and spatial frequency. As predicted, we found an effect of spatial frequency on evoked gamma band ac-tivity (eGBA) but no effect of objecthood. And while the overall difference between objects and non-objects in total gamma band activity (tGBA) was substantial, tGBA was not modulated by spatial frequency overall. These results are broadly consistent with a model in which different spatial frequencies are processed by different routes.
Event-related potentials
Schendan and Lucia [43] suggested that object sensitivity in the P1 and N1 time windows largely reflects figure-ground segregation. We found that the P1 exhibited object-selective enhancement, with more positive amplitudes for objects than non-objects. Salient local contrast edges strongly con-tribute to figure-ground segregation. Given that they are present in object images but are largely reduced or absent in
non-objects, this may drive early differences between these classes of image. A possible alternative explanation for is that these differences reflect a task difference between ob-jects and non-obob-jects. For non-obob-jects, the task was fin-ished once the decision had been made that the stimulus was a non-object, whereas further processing would have been required to establish whether objects were living or non-living. Thus, it is possible that the level of attention paid to objects was higher than to non-objects, since the task was harder for objects.
[image:9.595.61.540.88.411.2]objects than for any other category of image. In fact, the N1 was almost absent for BB non-objects. HSF and LSF images, on the other hand, produced similar negativities for objects and non-objects. An attention account thus seems unlikely to fully account for this pattern, since it would predict overall less negative N1 amplitudes for non-objects, rather than only for BB non-objects.
As noted earlier, task differences may alter spatial fre-quency processing in the N170 to faces [44]. Previously, we did not find evidence for such task-related differences in the N1 to objects [12]. In that experiment, participants switched between a basic-level, grammatical gender classification task and a superordinate, living/non-living categorization task. The visual N1 may index fine-grained discrimination pro-cesses [45], which would still be ongoing for most stimuli. For all objects, participants would likely still be determining whether the object was living or non-living. It is possible that for BB non-objects sufficient processing had been com-pleted for little further processing to be required. BB object categorization was as fast as categorizing a BB non-object as a non-object, which was not true for LSF or HSF object categorization, suggesting an overall processing advantage for BB images. To relate the N1 findings to models such as Bar et al.’s [4], in which LSF are processed fastest and used to guide subsequent HSF processing, the BB images are the only images which provide both HSF and LSF information, and thus that have viable information to process early and inform subsequent processing. Thus, BB images should show different patterns to HSF and LSF only images, since both the initial LSF guess and subsequent HSF confirma-tion can proceed as usual.
In addition, the P1 was independently influenced by spatial frequency, with higher amplitudes for BB images than for HSF images, and higher amplitudes for HSF im-ages than LSF imim-ages. Our spatial frequency effect is con-sistent with our previous study on object categorization at different levels of specificity [12], in which we found higher P1 amplitudes for HSF relative to LSF objects. That the P1 was greater for images containing HSF (since BB images also contain HSF) than LSF only images might suggest that the P1 largely reflects the HSF pathway. However, this would not necessarily predict that the BB images would drive a larger P1 than HSF images. One possibility is that total spectral power may have driven this difference [46]. Although we matched the images for luminance and con-trast, filtering necessarily removes large regions of spectral power from an image, and thus a BB image will necessarily have higher spectral power across a broad range of frequen-cies than a HSF image. This may drive a stronger response than a stimulus targeted a particular range of frequencies.
Gamma band activity
As predicted, we found an effect of spatial frequency but not of objecthood in eGBA. In a previous report, there
was higher eGBA in response to low frequency stimuli compared to high frequency stimuli [21], whereas here, we found higher eGBA in response to high frequency stimuli. Fründ et al.’s difference was between responses to 1 cycle per degree (cpd) and 10 cpd stimuli; there was no significant difference between 1 cpd and 5.5 cpd stimuli, which are approximately the cut-offs used for our stimuli (~0.9 cpd and ~4.7 cpd). Note also that our stimuli are complex, and contain information at different spatial fre-quencies, whereas the sine-wave gratings used by Fründ et al. do not. Thus there are a number of differences in the stimuli across the studies which may make the two difficult to directly compare. Nevertheless, this does indi-cate that spatial frequency may interact with other factors in driving eGBA. Furthermore, that eGBA did not signifi-cantly differ for objects and non-objects, in keeping with many previous findings [15,18,19], does not support the suggestion that evoked GBA reflects the matching of a stimulus to a stored representation [47].
In contrast to the lack of an effect of objecthood on eGBA, the overall difference between objects and non-objects in tGBA was substantial, with a relatively large effect size (ƞ2
g. = .14). This effect was not modulated by spatial frequency, in keeping with our suggestion that it should reflect predominantly high-level stimulus charac-teristics, and specifically, objecthood. There was a small but significant interaction between spatial frequency and hemisphere, which was driven by slightly lower tGBA in response to HSF stimuli in the left hemisphere. However, the pattern of previous results regarding hemispheric spatial frequency specialization is diverse and given that the effect was weak we do not make strong further pretations [48-53]. We would suggest that this inter-action indicates that ongoing, artefact-corrected tGBA may not reflect only the accessing of high-level, abstract object representation, though the data here were consist-ent with that being its primary role.
Conclusions
Overall, we found that the visual event-related P1 compo-nent showed independent modulations by objecthood and spatial frequency, while the N1 showed varying amplitudes based on a combination of both spatial frequency and objecthood. We would speculate that rather than early sen-sitivity to objecthood in the P1 reflecting early high-level processing, it may be related to figure-ground organization. The reduction in the N1 response to BB non-objects may reflect relatively easy categorization of these stim-uli as non-objects, given that they had both high and low spatial frequency information. Thus, little further visual dis-crimination was necessary for such stimuli. Additionally, artefact-corrected tGBA is relatively insensitive to spatial-frequency, suggesting that it may be the activation of a high-level, relatively abstract object representation. The ele-vated gamma relative to baseline for non-objects is consist-ent with the late gamma response to some extconsist-ent reflecting ongoing perceptual processing, possibly supplemented by high-level representational analysis. Thus, our ERP and gamma band results are consistent with different, low and high spatial frequency ranges being processed by different pathways at different speeds during object recognition.
Competing interests
The authors declare that they have no competing interests.
Authors’contributions
MC performed the experiment and its statistical analysis. All authors (MC, JM, MMM) participated in the conception, design, and interpretation of the experiment and its drafting for publication. All authors (MC, JM, MMM) read and approved the final manuscript.
Acknowledgements
The project was funded by the Deutsche Forschungsgemeinschaft (DFG). The funders had no role in the design, collection, analysis and interpretation of data, in the writing of the manuscript, or in the decision to submit the manuscript for publication. The authors also acknowledge support from both the Deutsche Forschungsgemeinschaft (DFG) and Universität Leipzig within the program of Open Access Publishing. The authors thank Renate Zahn and Karolin Meiß for assistance conducting the EEG recordings, and Valerie Goffaux for kindly providing a script for luminance and contrast matching.
Author details
1
Institute of Psychology, University of Leipzig, 04109 Leipzig, Germany. 2School of Psychology, University of Leeds, Leeds LS9 2JT, UK.3School of
Psychology, University of Aberdeen, Aberdeen AB24 3FX, UK.
Received: 13 October 2014 Accepted: 11 February 2015
References
1. Bar M. A cortical mechanism for triggering top-down facilitation in visual object recognition. J Cogn Neurosci. 2003;15:600–9.
2. Bullier J. Integrated model of visual processing. Brain Res Rev. 2001;36:96–107. 3. Hegdé J. Time course of visual perception: coarse-to-fine processing and
beyond. Prog Neurobiol. 2008;84:405–39.
4. Bar M, Kassam KS, Ghuman AS, Boshyan J, Schmid AM, Dale AM, et al. Top-down facilitation of visual recognition. Proc Natl Acad Sci. 2006;103:449–54.
5. Badcock JC, Whitworth FA, Badcock DR, Lovegrove WJ. Low-frequency filtering and the processing of local - global stimuli. Perception. 1990;19:617–29. 6. Hughes HC, Fendrich R, Reuter-Lorenz PA. Global versus local processing in
the absence of low spatial frequencies. J Cogn Neurosci. 1990;2:272–82.
7. Navon D. Forest before trees: the precedence of global features in visual perception. Cogn Psychol. 1977;9:353–83.
8. Marr D. Vision: a computational investigation into the human representation and processing of visual information. San Francisco: W.H. Freeman and Company; 1982.
9. Collin CA, McMullen PA. Subordinate-level categorization relies on high spatial frequencies to a greater degree than basic-level categorization. Percept Psychophys. 2005;67:354–64.
10. Pourtois G, Dan ES, Grandjean D, Sander D, Vuilleumier P. Enhanced extrastriate visual response to bandpass spatial frequency filtered fearful faces: time course and topographic evoked-potentials mapping. Hum Brain Mapp. 2005;26:65–79.
11. Nakashima T, Kaneko K, Goto Y, Abe T, Mitsudo T, Ogata K, et al. Early ERP components differentially extract facial features: evidence for spatial frequency-and-contrast detectors. Neurosci Res. 2008;62:225–35. 12. Craddock M, Martinovic J, Müller MM. Task and spatial frequency
modulations of object processing: an EEG study. PLoS One. 2013;8:e70293. 13. Tallon-Baudry C, Bertrand O. Oscillatory gamma activity in humans and its
role in object representation. Trends Cogn Sci. 1999;3:151–62.
14. Martinovic J, Busch NA. High frequency oscillations as a correlate of visual perception. Int J Psychophysiol. 2011;79:32–8.
15. Martinovic J, Gruber T, Müller MM. Coding of visual object features and feature conjunctions in the human brain. PLoS One. 2008;3:e3781. 16. Busch NA, Debener S, Kranczioch C, Engel AK, Herrmann CS. Size matters:
effects of stimulus size, duration and eccentricity on the visual gamma-band response. Clin Neurophysiol. 2004;115:1810–20.
17. Gruber T, Müller MM. Effects of picture repetition on induced gamma band responses, evoked potentials, and phase synchrony in the human EEG. Cogn Brain Res. 2002;13:377–92.
18. Gruber T, Müller MM. Oscillatory brain activity dissociates between associative stimulus content in a repetition priming task in the human EEG. Cereb Cortex. 2005;15:109–16.
19. Martinovic J, Gruber T, Müller MM. Induced gamma band responses predict recognition delays during object identification. J Cogn Neurosci. 2007;19:921–34. 20. Martinovic J, Gruber T, Ohla K, Müller MM. Induced gamma-band activity
elicited by visual representation of unattended objects. J Cogn Neurosci. 2009;21:42–57.
21. Fründ I, Busch NA, Körner U, Schadow J, Herrmann CS. EEG oscillations in the gamma and alpha range respond differently to spatial frequency. Vision Res. 2007;47:2086–98.
22. Busch NA, Herrmann CS, Müller MM, Lenz D, Gruber T. A cross-laboratory study of event-related gamma activity in a standard object recognition paradigm. Neuroimage. 2006;33:1169–77.
23. Yuval-Greenberg S, Tomer O, Keren AS, Nelken I, Deouell LY. Transient induced gamma-band response in EEG as a manifestation of miniature saccades. Neuron. 2008;58:429–41.
24. Hassler U, Barreto NT, Gruber T. Induced gamma band responses in human EEG after the control of miniature saccadic artifacts. Neuroimage. 2011;57:1411–21.
25. Keren AS, Yuval-Greenberg S, Deouell LY. Saccadic spike potentials in gamma-band EEG: characterization, detection and suppression. Neuroimage. 2010;49:2248–63.
26. Adjamian P, Holliday IE, Barnes GR, Hillebrand A, Hadjipapas A, Singh KD. Induced visual illusions and gamma oscillations in human primary visual cortex. Eur J Neurosci. 2004;20:587–92.
27. Hadjipapas A, Adjamian P, Swettenham JB, Holliday IE, Barnes GR. Stimuli of varying spatial scale induce gamma activity with distinct temporal characteristics in human visual cortex. Neuroimage. 2007;35:518–30. 28. Fintzi AR, Mahon BZ. A bimodal tuning curve for spatial frequency across
left and right human orbital frontal cortex during object recognition. Cereb Cortex. 2013;24(5):1311–8.
29. Truccolo WA, Ding M, Knuth KH, Nakamura R, Bressler SL. Trial-to-trial variability of cortical evoked responses: implications for the analysis of functional connectivity. Clin Neurophysiol. 2002;113:206–26.
30. Olejnik S, Algina J. Generalized eta and omega squared statistics: measures of effect size for some common research designs. Psychol Methods. 2003;8:434–47.
31. Jasper H. The ten twenty electrode system of the international federation. Electroencephalogr Clin Neurophysiol. 1958;10:371–5.
33. MettingvanRijn A, Peper A, Grimbergen C. High-quality recording of bioelectric events. Med Biol Eng Comput. 1991;29:433–40.
34. Delorme A, Makeig S. EEGLAB: an open source toolbox for analysis of single-trial EEG dynamics including independent component analysis. J Neurosci Methods. 2004;134:9–21.
35. Nolan H, Whelan R, Reilly RB. FASTER: fully automated statistical
thresholding for EEG artifact rejection. J Neurosci Methods. 2010;192:152–62. 36. Goffaux V, Gauthier I, Rossion B. Spatial scale contribution to early visual
differences between face and object processing. Cogn Brain Res. 2003;16:416–24.
37. Itier RJ, Taylor MJ. N170 or N1? Spatiotemporal differences between object and face processing using ERPs. Cereb Cortex. 2004;14:132–42.
38. Rossion B, Joyce CA, Cottrell GW, Tarr MJ. Early lateralization and orientation tuning for face, word, and object processing in the visual cortex. Neuroimage. 2003;20:1609–24.
39. Rousselet GA, Pernet CR. Quantifying the time course of visual object processing using ERPs: it’s time to up the game. Front Psychol. 2011;2:107. 40. Vanrullen R. Four common conceptual fallacies in mapping the time course
of recognition. Front Psychol. 2011;2:365.
41. Oostenveld R, Fries P, Maris E, Schoffelen J-M. FieldTrip: open source software for advanced analysis of MEG, EEG, and invasive electrophysiological data. Intell Neurosci. 2011;2011:1:1–9.
42. Mitra PP, Pesaran B. Analysis of dynamic brain imaging data. Biophys J. 1999;76:691–708.
43. Schendan HE, Lucia LC. Object-sensitive activity reflects earlier perceptual and later cognitive processing of visual objects between 95 and 500 ms. Brain Res. 2010;1329:124–41.
44. De Cesarei A, Mastria S, Codispoti M. Early spatial frequency processing of natural images: an ERP study. PLoS One. 2013;8:e65103.
45. Goffaux V, Jemel B, Jacques C, Rossion B, Schyns P. ERP evidence for task modulations on face perceptual processing at different spatial scales. Cognit Sci. 2003;27:313–25.
46. Vogel EK, Luck SJ. The visual N1 component as an index of a discrimination process. Psychophysiology. 2000;37:190–203.
47. Herrmann CS, Munk MHJ, Engel AK. Cognitive functions of gamma-band activity: memory match and utilization. Trends Cogn Sci. 2004;8:347–55. 48. Hübner R. The effect of spatial frequency on global precedence and
hemispheric differences. Percept Psychophys. 1997;59:187–201. 49. Kauffmann L, Ramanoel S, Peyrin C. The neural bases of spatial frequency
processing during scene perception. Front Integr Neurosci 2014;8. 50. Kitterle FL, Hellige JB, Christman S. Visual hemispheric asymmetries depend
on which spatial frequencies are task relevant. Brain Cogn. 1992;20:308–14. 51. Peyrin C, Chauvin A, Chokron S, Marendaz C. Hemispheric specialization for
spatial frequency processing in the analysis of natural scenes. Brain Cogn. 2003;53:278–82.
52. Peyrin C, Mermillod M, Chokron S, Marendaz C. Effect of temporal constraints on hemispheric asymmetries during spatial frequency processing. Brain Cogn. 2006;62:214–20.
53. Rebaï M, Bernard C, Lannou J, Jouen F. Spatial frequency and right hemisphere: an electrophysiological investigation. Brain Cogn. 1998;36:21–9.
Submit your next manuscript to BioMed Central and take full advantage of:
• Convenient online submission
• Thorough peer review
• No space constraints or color figure charges
• Immediate publication on acceptance
• Inclusion in PubMed, CAS, Scopus and Google Scholar
• Research which is freely available for redistribution