White Rose Research Online URL for this paper: http://eprints.whiterose.ac.uk/123944/
Version: Accepted Version
Proceedings Paper:
Biga, V., Alves Coelho, O.M., Gokhale, P.J. et al. (4 more authors) (2017) Statistical texture-based mapping of cell differentiation under microfluidic flow. In: Bracciali , A., Caravagna, G., Gilbert, D. and Tagliaferri, R., (eds.) CIBB 2016: Computational Intelligence Methods for Bioinformatics and Biostatistics. International Meeting on
Computational Intelligence Methods for Bioinformatics and Biostatistics, 01-03 Sep 2016, Stirling, United Kingdom. Lecture Notes in Computer Science (vol 10477). Springer International Publishing , pp. 93-106. ISBN 9783319678337
https://doi.org/10.1007/978-3-319-67834-4_8
[email protected] https://eprints.whiterose.ac.uk/ Reuse
Unless indicated otherwise, fulltext items are protected by copyright with all rights reserved. The copyright exception in section 29 of the Copyright, Designs and Patents Act 1988 allows the making of a single copy solely for the purpose of non-commercial research or private study within the limits of fair dealing. The publisher or other rights-holder may allow further reproduction and re-use of this version - refer to the White Rose Research Online record for this item. Where records identify the publisher as the copyright holder, users can verify any specific terms of use on the publisher’s website.
Takedown
If you consider content in White Rose Research Online to be in breach of UK law, please notify us by
STATISTICAL TEXTURE-BASED MAPPING OF CELL
DIFFERENTIATION UNDER MICROFLUIDIC FLOW
Veronica Biga(1,4∗), Olivia M A Coelho(2∗), Paul J Gokhale(3), Eduardo Mendes(2),
Peter W Andrews(3), Daniel Coca(4)
(1)The University of Manchester, Faculty of Life Sciences, Oxford Rd M13 9PT UK,
[email protected]; (2)The Federal University of Minas Gerais, Antonio
Carlos 6627 Belo Horizonte Brazil,[email protected],[email protected]; (3)The University of Sheffield, Centre for Stem Cell Biology, Western Bank S10 2TN
UK,[email protected],[email protected]; (4)The University of
Sheffield, Automatic Control and Systems Engineering Department, Mappin Street S1 3JD UK,[email protected]; *authors contributed equally to this work.
Keywords: principal component analysis, texture features, Gabor energy, fate mapping.
Abstract.
Timelapse microscopy imaging allows for long term monitoring of biological pro-cesses however a major bottleneck in assesing experimental outcome is the need for an automated analysis framework to extract essential statistics. In this study, we use Gabor texture descriptors to generate a high dimensional feature space which is analysed with PCA to provide unsupervised characterisation of texture differences between pairs of images. We apply this technique to differentiation of carcinoma cells in the presence of retinoic acid (RA) and show that differentiation outcome can be predicted directly from texture information. A microfluidic environment is used to accurately control the timing of RA signal over five days in culture. Results provide insight into the dynamics of cell response to differentiation signals over time.
1 Scientific Background
Embryonic stem cells have the ability to generate all cells in the adult body through differentiation, a process by which cells acquire highly specialised function and mor-phology. In the developing embryo, cell differentiation undergoes a complex spatial patterning with very precise timings difficult to replicate in vitro. As a result, differen-tiation of cells in culture is inefficient and not well understood. Recent studies indicate that cell response to external factors can be amplified by pulsing of signals as opposed to constant exposure [1, 2]. Two main technologies can be used to enable control of input signal properties, fast solution switching in microfluidic environment [1] and photo-activatable systems [2]. Microfluidics have the advantage of delivering multiple inputs and controlling other culture parameters such as shear stress [3]. We investigated the differentiation of NTERA2 human embryonic carcinoma cells in controlled microflu-idic flow. When exposed to retinoic acid, NTERA2 are known to differentiate towards a non-neural fate identified by surface marker ME311 and neural cells detected after 3-4 weeks [4] , however expression at early stages in differentiation is not fully under-stood. In this study, we combine timelapse imaging and unsupervised characterisation of texture to describe the timeline of early differentiation.
2 Materials and Methods
kernel convolution with a Gaussian kernelg:
gλ,σ,γ,θ,ϕ(x, y) = e−
x′2+γ2y′2
2σ2 cos
2πx′
λ +ϕ
;rλ,σ,γ,θ,ϕ =I∗g (1)
wherex′ = (x−x0) cosθ+ (y−y0) sinθ;y′ = −(x−x0) sinθ+ (y−y0) cosθ and
(x0, y0)represent the center of the kernel;θ∈[0π),λandϕ∈(−π π]represent angle, frequency and phase respectively. The Gaussian envelope is characterised by ellipticity
γ and size σ and relate to bandwidth by: σλ = 1
π
q ln 2
2 2b+1
2b
−1. The Gabor energy filter is
defined by:
fλ,σ,γ,θ(x, y) =
q
r2
λ,σ,γ,θ,0(x, y) +rλ,σ,γ,θ,2 −π2(x, y) . (2) Multiple filter outputs were combined into a texture feature set using parameters: λ = [1/15; 1/30; 1/60; 1/120; 1/240];θ = [0;π/4;π/2;π/2; 3π/4;π; 5π/4; 6π/4; 7π/4];σ = [0.0375; 0.0187; 0.0094; 0.0047; 0.0023];γ = [0.001; 0.005; 0.010; 0.015]andb = 1.
PCA-based analysis using random window sampling. Statistical analysis of the feature set was implemented with Principal Component Analysis (PCA) [6]. Random window sampling was used to reduce computational complexity by collecting informa-tion from windows found at random locainforma-tions in the image. For each sampling windowi
and a given parameter combinationjtexture was analysed with filters (2) and integrated to produce a texture set:Z(i, j) = R R
fn,k(x, y)dxdy. The Matlab functionprincomp.m
was used to obtain the projection W = ATZ and data was visualised in the principal
component space ( Figure 1). Where indicated, multiple images and timepoints were analysed in the same principal component space and labelled accordingly.
Texture
Set 1
a b
c
d
[image:3.595.64.319.405.646.2]Texture Set 2
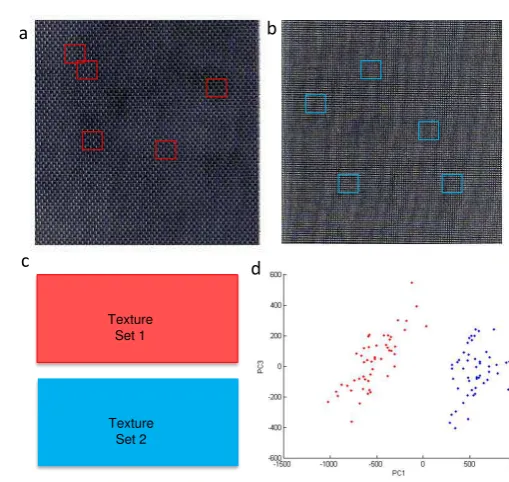
Figure 1: Texture feature extraction and comparison tech-nique. (a) Sampling from Texture 1 at locations in red; (b) sampling from Texture 2 at locations in blue; (c) Com-bined feature dataset organised by window number vs fil-ter number; (d) PCA representation of Texture Set 1 (red) and Texture Set 2 (blue).
Cross-validation of linear dis-criminant classifier. A linear discriminant classification technique was used to separate texture charac-teristics from different images. This was implemented in Matlab using
classify.m. The classifier was
op-timised using n-fold cross valida-tion: (i)data was divided un into four groups; (ii) the linear discrim-inant was trained on one group and tested on the remaining groups; (iii) classifier with overall best rate was chosen. As expected, the classifi-cation results were highly depedent on window number and size. To optimise window parameters, global classifiers that produced>95% clas-sification rates at the smallest% cov-erage of an image were chosen. On average, high classification rates (> 95%) could be obtained from 10%
coverage of images highlighting in-herent redundancy found in data. Differentiation assay using microfluidic perfusion system. Cell differentiation assays were carried out experimentally by exposing NTERA2 to a low concentration of retinoic acid (RA) at1 : 10−7 dilution (RA-7) for a period of five days. Cells were
grown in culture media containing DMEM F-12 with20%FBS supplemented with RA-7 and incubated at 37◦ and 5%CO
A1 A2
A1 A2 a
B1 B2
[image:4.595.93.471.70.363.2]B1 B2 b
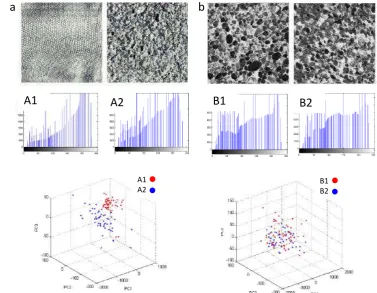
Figure 2: PCA-based detection applied to textured images from Brodatz dataset. (a) Set of two different textured images, corresponding histograms and PCA analysis indicating a separation boundary with min-imal overlap (bottom); (b) Set of two highly similar textured images, corresponding histograms and PCA analysis showing complete overlap.
and the frequency at which RA was added to the culture was manipulated using the microfluidic platform Cellasic ONIX [7]. Pulses of signal were created by flowing RA-7 solution for 5 min followed by flowing of media. Continuous conditions indicate that RA-7 was always present in the media. At the end of the incubation period, cell cultures were differentiated and appeared morphologically different compared to cells grown in media without RA (data not shown). The efficiency of differentiation was assessed by in situ staining with an antibody detecting surface marker ME311 and nuclei were detected with Hoechst33342.
3 Results
3.1 Unsupervised texture discrimination applied to Brodatz images
Images can be distinguished by texture in PCA projection. PCA-based identi-fication of distinct textures was tested on a number of representative images from the Brodatz1 dataset (Figure 1). The technique involved: (i) sampling at random locations
from two images (Figure 1a, 1b); (ii) generating a feature matrix containing Gabor en-ergy cumulative features from both images (Figure 1c); (iii) using PCA to visualise the separation between observations from the two textured images (Figure 1d). In this representative example, the clear separation between observations from the two sets demonstrate that PCA can correctly discriminate between distinct images without any prior knowledge of the data.
Texture discrimination is more accurate than grayscale intensity. One commonly used feature to describe an image is the intensity histogram which does not contain spa-tial information. However, distinct images can show similarity in grayscale histogram. We investigated the ability to use multi-dimensional texture features to discriminate
be-1
tween images with similar histogram (Figure 2a). Indeed, the PCA-based approach in-dicates separation between observations sampled from distict images (Figure 2a). Only few observations are overlapping and a separation boundary can be found.
In assessing similarity it is critical to be able to determine when images are identi-cal in texture. To test this, separate images acquired from the same real material were analysed (Figure 2b). As expected, the two textured images showed high similarity in their histogram. In this case, the PCA-based approach indicated complete overlap between observations from the two images (Figure 2b). Taken together, these results demonstrate that the PCA-based approach for analysing texture can provide a qualita-tive measure of similarity between images. This technique was coupled with a linear discriminant classification method and used to describe the timeline of differentiation in human embryonic carcinoma cells under microfluidic flow.
3.2 PCA-based analysis of cell culture differentiation from timelapse videos Microfluidic frequency control of Retinoic Acid (RA-7) ellicits differential re-sponse in cell fate. Cells maintained in media containing RA-7 exhibited varying levels of differentiation over five days in culture (Figure 3a). Although cells in all conditions proliferated and became confluent, the frequency of RA-7 greatly affected the propor-tion of cells expressing the surface marker ME311 (Figure 3b).
1
Day 0 Day 3 Day 4 Day 5 Day 5
1h/3p
3hp
1hp
1hc
a
1
[image:5.595.91.309.332.576.2]b
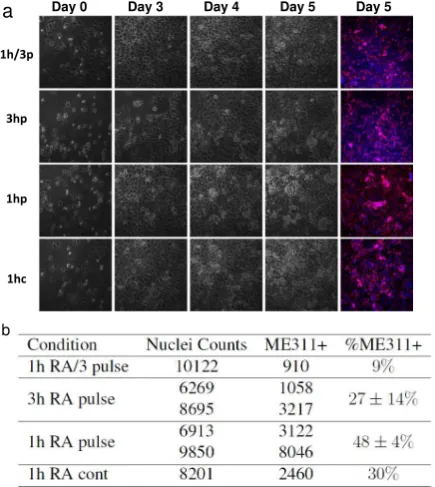
Figure 3: Microfluidic cell differentiation. (a) Repre-sentative images from experiments carried out at set fre-quencies of RA-7, every 1h pulse of RA-7/3 (1h/3p); every 3h pulse (3hp); every 1h pulse (1hp); every 1h continuous (1hc); Left panels show staining of cells ex-pressing surface marker ME311 (red) and nuclear marker Hoechst33342 (blue); (b) Overall quantification of total cell numbers and ME311 expression.
Adding RA at low concentration every 1h (Figure 3: 1hRA3p) as a pulse caused only9% of cells to ex-press ME311. However, when the same overall concentration of RA was added as a single pulse every 3h (Figure 3: 3hRAp), the proportion of ME311+ cells increased to27±14%. This indicats that cell response to RA is not integrated over time and differ-entiation is triggered at high concen-trations.
follow-1
•
1h RA
•
3h RA
a
[image:6.595.92.413.59.367.2]b
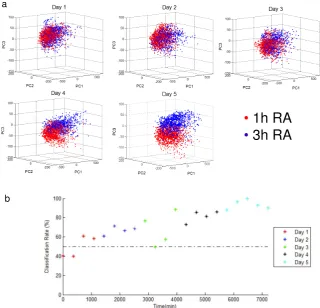
Figure 4: Texture analysis of differentiation experiments. (a) Texture characteristics extracted from two culture conditions 1hRA (red) pulse and 3h RA pulse (blue) are visualised in the first principal component space; (b) Classification rates for linear discriminant trained on the last timepoint describe the divergence between the two clusters at every 6h.
ing, the texture-based analysis strategy is used to describe differentiation potential from video data acquired over five days differentiation experiments.
Texture characteristics reveal the onset of differentiation. Conditions 1h RA pulse and 3hRA pulse ellicited the largest fate shift as evidenced by surface marker expression (Figure 3b). Images from these conditions acquired with a timelapse micro-scope were sampled for texture and the first principal components were used to visu-alise the appearance of cell cultures at Days1 to 5 (Figure 4a). As expected, the cultures appear very similar in the first 48h post-plating (Day 1 to 2). The first detectable dif-ferences in texture characteristics appear in Day 3 and continue to amplify in Days 4 to 5. Specifically, compared to the location of clusters representing 1hRA and 3hRA at Day1, at later incubation times the two conditions appear to move in opposite directions in terms of texture characteristics leading to best separation at Day 5. The gradual shift observed in Days 3 to 5 indicate that after the onset of differentiation at approx 72h post-plating, the cells in the two flow conditions continue to differentiate.
Timeline of differenentiation is mapped by linear discriminant. Differences in texture characteristics over time were quantified using a linear discriminant determined from images in the two conditions at end (Day 5) thus the classification rate shows high separation at the final timpoint. By applying the same linear discriminant throughout the dataset, a quantitative measure of differentiation is obtained (Figure 4b). At the initial timepoints, classification rates are approx. 50%, therefore the two conditions are very similar consistent with no differentiation. At Day 3 the first points registering75%
surface marker expression levels (Figure 3b).
4 Conclusion
In this study, we discuss extracting texture information from imaging data using Ga-bor energy and analysing differences between distinct images with conventional PCA. We show that this framework can successfully discriminate between distinct Brodatz images and at the same time it can show similarity in identical textures. By coupling PCA analysis of texture with a linear discriminant, an unsupervised technique for mea-suring textural differences in a set of images is constructed. We apply this technique to data showing differentiation of human embryonic carcinoma cells.
By using a microfluidic environment we designed controlled variations in media con-ditions over five days. Differentiation potential was monitored only at the end of the ex-periment using the non-neural surface marker ME311. Exex-perimental results showed that frequency patterns ellicit quantifiable differences in the amount of differentiated cells expressing ME311 most evident between 1h and 3h pulsed conditions. Cell response was highly nonlinear with concentration and frequency. Remarkably, the behaviour of cells exposed continuously to RA diverged greatly from cells exposed to 5 min pulses indicating saturation occurs when the trigger molecule is always present inthe media.
To investigate the timeline of differentiation, we analysed texture differences in im-ages collected over the entire incubation period. The results showed that a shift in differentiation outcome can be predicted directly from texture information. The trajec-tory of clusters containing observations from the two conditions was indicative of a fate shift away from the appearance at 48h post-plating (undifferentiated) and also diverging from each other. Since ME311 was favoured in the 1h RA condition, a potential mech-anism by which cells in the 3hRA undergo a fate shift is by expressing higher levels of a neuronal marker, for example A2B5.
The classification rates are consistent with the surface marker expression levels and in addition, provide a quantitative description of the timeline of differentiation which is unsupervised and label free. By combining statistical analysis and knowledge of the biological processes involved, this technique could greatly benefit experimentalists in statistically assessing the efficiency of differentiation protocols directly from images.
Acknowledgments
This work was funded by a Human Frontier Science Program grant. OC was funded by Conselho Nacional de Desenvolvimento Cient´ıfico e Tecnol´ogico, Brazil. VB kindly thanks James E Mason from Centre for Stem Cell Biology for contributing to the design of cell culture protocols and in situ staining for the M04S microfluidic plate.
References
[1] B. Sorre, A. Warmflash, A. H. Brivanlou, E. D. Siggia. ” Encoding of temporal signals by the TGF-β
pathways and implications for embryonic patterning”,Dev Cell, vol. 30, pp. 334-342, 2014. [2] C. Sokolik, Y. Liu, D. Bauer, J. McPherson, M. Broeker, G. Heimberg, L. S. Qi, D. A. Sivak, M.
Thomson. ”Transcription factor competition allows embryonic stem cells to distinguish authentic signals from noise”,Cell Syst, vol. 1, pp. 117-129, 2015.
[3] M. Mehling, Savas Tay. ”Microfluidic Cell Culture”. Current Curr Opin Biotechnol, vol. 25, pp. 95-102, 2014.
[4] S. L. Ackerman, B. B. Knowles, Peter W. Andrews. ” Gene regulation during neuronal and non-neuronal differentiation of NTERA2 human teratocarcinoma-derived stem cells”.Molec Brain Res, vol. 25, pp. 157-162, 1994.
[5] N. Petkov, P. Kruizinga. ”Computational models of visual neurons specialised in the detection of periodic and aperiodic visual stimuli: Bar and grating cells”.Biol Cybern, vol.76, no. 2, pp. 83-96, 1997.
[6] I.T. Jolliffe. ”Principal Component Analysis”. Springer, 2nd ed, 2002 .