Abstract: Water is the most essential need of all life forms. This essential need can also create hazards to us which comes in the form of water hazards (flood and drought). Catastrophic events, for example, flood is respected to be brought about by outrageous climate conditions just as changes in worldwide and territorial atmosphere. If precautions are not taken beforehand it becomes more and more difficult to control when it occurs. This study aimed to forecast both flood and drought using Machine Learning (ML). So as to have a clear and precise forecast of flood and drought hazard is fundamental to play out a specific and multivariate analysis among the various kinds of data sets. Multi variate Analysis means that all measurable strategies will concurrently analyses manifold variables. Among multi variate investigation, ML will give expanding levels of exactness, accuracy, and productivity by finding designs in enormous and variegated data sets. Basically, ML methods naturally acquires proficiency data from dataset. This is finished by the way toward learning, by which the calculation can sum up past the models given via preparing information in info. AI is intriguing for forecasts since it adjusts the goal methodologies to the highlights of the data set. This uniqueness can be utilized to foresee outrageous from high factor information, as on account of the risks. This paper proposes systems and contextual analysis on the application on ML calculations on water hazard occurrence forecast. Especially the examination will concentrate on the utilization of Support Vector Machines and Artificial Neural Networks on a multivariate arrangement of information identified with water level of lakes in and around Chennai and measurement of rainfall in the lakes.
Keywords : Machine Learning, Artificial Neural Network, Support Vector Machine, Flood, Drought, Prediction.
I. INTRODUCTION
O
verwhelming regular downpours cause the lakes in and around the city to flood and flood the surroundings zones. The floods devastate houses, harvests, streets, and essential framework, bringing about the dislodging of individuals. Dry spells are drawn out precipitation-insufficient periods, bringing about deficient water accessibility and unfriendly repercussions to yields, creatures and people.Revised Manuscript Received on November 05, 2019.
D. Dakshin, student currently perusing Computer Science and Engineering in SRM Institute Of Science And Technology located in Chennai, Tamil Nadu, India.
V. R. Rupesh, student currently perusing Computer Science and Engineering in SRM Institute Of Science And Technology located in Chennai, Tamil Nadu, India.
S. Praveen Kumar, student currently perusing Computer Science and Engineering in SRM Institute Of Science And Technology located in
Dry spell anticipating is imperative to water assets arranging and the board in limiting the negative results. The exploration on the progression of flood and dry season expectation models added to hazard decrease, arrangement proposal, decrease the destruction of all life forms, and decrease of the assets harm related with floods and dry spell.
Flood, dry season gauging and forecast abilities developed gradually during the 1970s and 1980s. Be that as it may, ongoing innovative advances have majorly affected estimating procedures. The significance of cutting-edge frameworks for present moment and long-haul expectation for flood and dry spell occasions is firmly underscored to make enduring and harm less serious. The forecast of these sorts of risks and event area is typically mind boggling because of regularly changing nature of atmosphere condition. In this way, the present significant flood and dry season forecast models are for the most part information explicit and include different presumptions.
The model relies upon the accessible information to be "educated", with no an earlier theory about the sort of relationship, which is permitted to be intricate and nonlinear. Be that as it may, these techniques need hidden scientific hypothesis and are typically persuaded by natural contentions.
II. LITERATURESURVEY
Flood Prediction Using Machine Learning Models: Literature Review by Amir mosavi and his team to predict floods using machine learning the machine learning algorithm used by them is Artificial Neutral Networks (AANs), Multilayer Perceptron (MLP), Adaptive Neuro-Fuzzy Inference System (ANFIS), 4. Wavelet Neural Network (WNN) and Support Vector Machine (SVM) to predict the floods in an area. The main disadvantage in this paper is that it cannot predict spatial floods which is an important aspect in flood prediction.
Drought forecasting using new machine learning methods by Anteneh BELAYNEH, Jan ADAMOWSKI. The main objective in this paper is to predict the future drought events in advance in order to save agriculture. The algorithms used to predict the droughts are artificial neural networks (ANNs), support vector regression (SVR). The Standardized Precipitation Index (SPI) was the drought index chosen to represent drought in the basin. The main disadvantage in this paper is that there is no longer-term SPI which is a major setback.
Use of Multivariate Machine Learning Analysis Techniques for Flood Risk Prevention by Politecmico di Milano. The main objective of this paper is Flood risk prevention which is completely based on the civil
Water Hazard Prediction using Machine
Learning
sources such satellite images, water basin levels, meteorological and GIS data, that nowadays are easily produced by the availability new satellite portals as SENTINEL and distributed sensor networks on the field. It uses many ML algorithms. Case Study: The Seveso River. It predicts only food but not drought.
Artificial Neural Networks (ANNs) for flood forecasting at Dongola Station in the River Nile, Sudan by Sulafa Hag Elsaf. The main objective is to predict Floods due to unconditional rainfall in some area. It uses Artificial neural networks (ANNs) algorithm. This can also predict only flood as its disadvantage.
Flood Forecasting Using Machine Learning by Kuolin Hsu in the year 2019. This paper is based on the flood hazards caused by Climatic changes around. This paper expels recent machine learning algorithms and predictive analysis. This paper is based on a global prospective basis.
Drought Prediction and Management using Big Data Analytics by Himani Shah, Vinita Rane, Nupur Gir. This is based on The prediction of occurrence of droughts in a certain area , In this DDI will be calculated which will be based on SPI, SPEI, PDSI, PHDI and ZIND indices and the algorithm used is the random forest algorithm and also robin algorithm with dynamic quantum size is used for resource allocation for the victims of drought affected areas. This project can be very helpful for farmers as based on the severity of droughts the farmers can decide which crops to grow.
Prediction on ecological water demand based on support vector machine by Lingling ZHANG, Yanfu WEI. This paper introduces a model which combine support vector machine with genetic algorithm to predict the ecological water demand. The support vector regression machine (SVRM) is based on Statistics Learning Theory with the rule of the structure risk minimum. It has the high precision forecast, better applicability, general value in the complex ecological water demand prediction.
Estimation of Water Demand in Residential Building using Machine Learning Approach by Dongjun Suh, Hyunyoung Kim, Jinsul Kim. This paper shows an estimation model for residential water consumption using machine learning approach in Korea. The proposed model accurately forecast water uses for each examined residential apartment buildings. It also says about efficient consumption of water resources. This model has been made keeping in mind the local community in Korea. It is a big boost to the locals.
III. PROPOSEDSYSTEM
The various past data sets collected from kraggle.com is being put to use to predict and forecast flood and drought going to occur in the future in a particular location. This prediction is done by ML using Artificial Neural Network and Support Vector Machine. Here two data sets are going to be used (1) Measurement of water level in the lakes in and around the city which has the readings for the past 15 years. (2) The second data set is the measurement of rainfall in the city which fills up the lakes and makes it to overflow. This data set can also be used to predict drought as this data can also be inferred to find the lack of rainfall the main source of water for daily needs which causes drought.
IV. MATH
If you are using Word, use either the Microsoft Equation Editor or the MathType add-on (http://www.mathtype.com) for equations in your paper (Insert | Object | Create New | Microsoft Equation or MathType Equation). “Float over text” should not be selected.
V. MACHINELEARNINGMETHOD
Environmental change is an extraordinary determinant in the adjustment of the dynamic of water surface bodies. The impact of the expansion of temperature risings, and outrageous meteorological occasions reflect in the increment in the number, and power of a flood and dry spell occasions. Expectation and assurance in capacity to moderate the impacts of outrageous occasions replaces the ideas, and thoughts of “Early Warning Systems” (EWS). The meaning of Early Warning System is the innovation and methodology intended to foresee and endure the mischief of characteristic and human-started calamities and other unfortunate occasions. Early Warning Systems (EWS) are notable as a basic life-sparing device for floods, dry seasons, storms, bushfires, and different dangers. This work needs to propose the use of on AI calculations on floods occasions expectation, utilizing specifically two methodologies, the Support Vector Machines and the Artificial Neural Network.
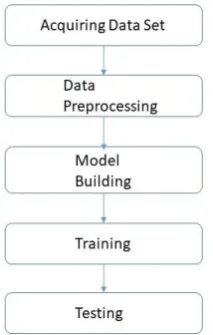
A. Data Set Analysis
Figure 2: Flow diagram for ML model building B. Artificial Neural Network
ANN is a profoundly remarkable learning figuring, trustworthy for adaptable and furthermore powerful for exhibiting heterogeneous flood structures with a high adjustment to non-basic disappointment and exact estimate. ANN is a learning estimation that is pushed by the technique for common tactile frameworks, for instance, the cerebrum, process information. In improved models of the cerebrum, it contains an information layer of neurons (or focuses, units), or a couple (or even three) secured layers of neurons one last layer of neurons, and a last layer of yield neuron:
𝑐𝑖 = 𝜎( 𝐿𝑖𝑗
𝑃
𝑗 =1
𝑌𝑖 + 𝑇𝑖𝑐𝑖𝑑)
Where σ () is enactment (move) work, P is quantity of information neurons Lij the loads, Yi contributions for information nerve cells and the edge values of the concealed nerve cells. ANN are of two types:
(1)Feed forward systems: here charts have no circle. (2)Intermittent (input) networks: but here the circles
happen in view of criticism associations.
Artificial Neural Networks systems (ANNs) can be utilized as devices for expectation, characterization, and choice help. The ANN illustrations utilized in the examination has a feed-forward and multi-layer perceptron (MLP) design which is prepared using the Levenberg Marquardt (LM) rear spread calculation. They are frequently utilized in hydrology for anticipating because of its straightforwardness. It comprises an information layer, at least one overall covered up layer, and a yield layer.
𝑌𝑘 𝑡 = 𝑓0 𝑊𝑘𝑗 𝑄
𝑗 =0
∗ 𝑓𝑛 𝑊𝑗𝑖𝑋𝑖 𝑡 + 𝑊𝑗 0 + 𝑊𝑘0 𝐿
𝑖=0
here L = amount or number of tests, Q = quantity of concealed nerve cell, xi(t) = the ith input value at time t; wji = mass that associates the ith neuron of info layer and the jth nerve cell in the shrouded layer; wj0 = predisposition to the jth shrouded nerve cell; fn = initiation capacity of the shrouded neuron; wkj = mass that interfaces the jth nerve cell belonging
[image:3.595.326.527.154.330.2]enactment work for the yield neuron; and yk(t) is the estimated kth yield at time step t. There are average of 4–6 contributions for every ANN illustration. The ideal amount of info nerve cells is controlled by experimentation, using quantity of neurons which displayed the most minimal RMS mistake (Root Mean Square) esteem among the preparation data set chosen to use. Sources of info and yields were institutionalized somewhere in the range of 0 and 1.
Figure 3: ANN simple feed forward network C. Support Vector Machine
[image:3.595.320.539.559.733.2]Support vector machine (SVM) is a managed AI estimation that can be used for both portrayal and backslide troubles. SVM is incredibly mainstream during flood illustrating; it is a coordinated learning machine which works dependent on the factual learning hypothesis and the basic Risk reduction rule. SVMs can be arranged into two kinds: bolster vector grouping (SVC) and bolster vector relapse (SVR), where SVR is the best sort for gauging errands. It is utilized to anticipate an amount forward in time dependent on preparing from past information. The significant parameters for the tuning of SVMs incorporate part type and parameter (classes of calculations for example examination), regularization parameter (the exchange off between accomplishing a low preparing mistake and a low testing blunder), Gamma parameter (multifaceted nature of model) and room for give and take acknowledgment.
We plot every datum thing as a point in n-dimensional space (where n is number of highlights you have) with the estimation of each component being the estimation of a specific facilitate. At that point, we perform characterization by finding the hyper-plane that separate the two classes well overall (take a gander at the beneath depiction picture).
[image:4.595.327.532.351.655.2]Figure 5: SVM – Graphical Representation In SVM, it is definitely not hard to have a straight hyper-plane between these two classes. Regardless, another expending request which develops is, should we need to add this part physically to have a hyper-plane. No, SVM has a framework called the bit trick. These are limits which takes low dimensional data space and change it to a higher dimensional space for instance it changes over not recognizable issue to detachable issue, these limits are called parts.
Figure 6: Kernel’s in Machine learning and SVM It works genuinely well with clear edge of separation. It is convincing in high dimensional spaces. It is reasonable in circumstances where number of estimations is more critical than the number of tests. It uses a subset of getting ready concentrations in the decision limit (called reinforce vectors), so it is similarly memory capable. It doesn't perform well, when we have enormous enlightening list in light of the way that the important getting ready time is higher. It is like manner doesn't perform well in reality, when the instructive accumulation has more uproar for instance target classes are covering. SVM doesn't authentically give probability assesses, these are resolved using an expensive five-wrinkle cross-endorsement. It is associated SVC method for Python scikit-learn library.
[image:4.595.56.284.429.544.2]VI. EXPERIMENT
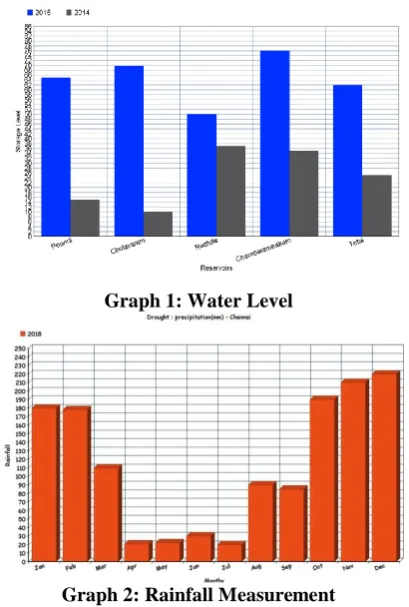
Table 1: Rainfall in lakes
The above graph is the reference to the amount of rainfall in Chennai. Out of those four reservoirs the Chembarambakkam and the Nungambakkam reservoirs (2015) are those which have been opened due to maximum capacity. so now, we are goanna predict the intensity at which both the reservoirs got filled up in a day.
Due to the full capacity of water there may be unconditional flow of water at a very high speed which will damage the properties. If it happens the prediction of flow of water is displayed in means of graph. There is being a severe drought in Chennai in 2019 where in contrasting to 2015 a lot of dams and reservoirs in and around Chennai has been dried out without enough water resulting in drought. Here we have got the details of years with decreasing amount of water in Chennai.
Graph 1: Water Level
Graph 2: Rainfall Measurement
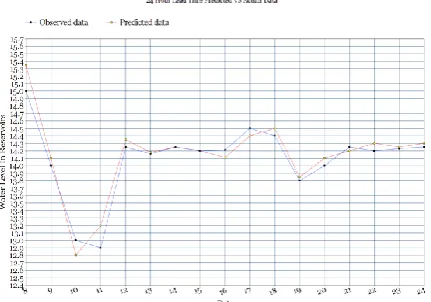
Graph 2: 24 Hours Lead Time
Graph 3: 48 Hours Lead Time
Graph 4: 72 Hours Lead Time
The model exactness examination is delineated similar to the slip-up of deciding or the assortment between the watched and foreseen characteristics. In the composition, there are various introduction evaluation procedures for assessing the precision and everybody has positive conditions and limitations. Here for taking a gander at the model, real measures are taken. Trustworthiness of-fit accurate limits measure how well data fit into the model. In this examination, the most extensively used systems specifically coefficient of affirmation (R2), full scale total of squares (SST), total square of misstep (SSE), mean entire of screw up (MSE), root mean square bungle (RMSE), mean preeminent degree of botch (MAPE) are used to check the show of the model. Each
The formula used for statistics are Total sum of square,
TSS =
𝑛𝑖−1𝑦
𝑖− 𝑦
′ 2Sum of Square of root,
SS =
𝑛𝑖=1𝑦
𝑖− 𝑦
𝑖′ 2 Mean sum of error,EMS =
1𝑛
𝑥 𝑆𝑆
Root mean square of error,MSER =
𝐸𝑀𝑆
Mean absolute percentage of error,
AP =
1𝑛
𝑦
𝑖− 𝑦
𝑖′ /𝑦
𝑖∗ 100
𝑛𝑖=1
Coefficient of determination R square
,
[image:5.595.65.281.53.204.2]𝐶𝑅
2= 1 −
𝑆𝑆
𝑇𝑆𝑆
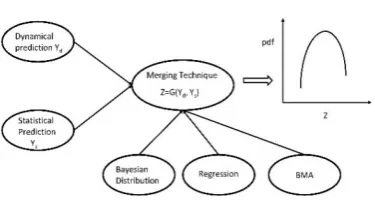
Table 3: Prediction Table
Figure 10: Prediction method
In kernel SVM you map your data points into a possibly infinite dimension Hilbert space H. It turns out that w, the normal vector to the separating hyperplane (which completely characterizes the decision boundary), has the form
P =
𝑚𝑎
𝑜𝑢
𝑜∅(𝑞
𝑜)
𝑜=1
Where ϕ is the map from input data space to feature space and the ao are from the dual formation (and if ii is not a support vector then ao=0). One of the things that makes SVM practical is that w is a finite linear combination of the {ϕ(qo)} which is due to the representor theorem.
We classify a point e via,
𝐶 𝑥 = 𝑠𝑔𝑛(𝑟 + 𝑎𝑢𝑏𝑢𝐿(𝑒𝑢 𝑤
𝑢=1
, 𝑒)
To compute,
𝐸 𝑡, 𝑡′ = exp(−𝛾| 𝑡 − 𝑡′ |2)
we have,
||x−x′||2=||x||2+||x′||2−2xTx′
This is how we call the above function.
VII. CONCLUSION
The point of convergence of this paper is to apply improved ANN for flood and dry season desire by using sensible educational accumulations of precipitation estimations and lakes water level in and around the city. The pack declared in this article has provoked the end that ANN type masterminds, dependably performed better stood out from another framework. Among the water level figure following 24 hours, 48 hours and 72 hours; desire following 24 hours performs well. Thusly our ANN model is used to envision simply flood and dry season going to happen later on. This strategy is worthwhile in light of the fact that just a single variable is required, while different models require a few factors to create exact expectations. The show of each circumstances was checked, and the structure with the base number of layers additionally, neurons was picked to evade any abundance. ANNs have the advantage of ease when appeared differently in relation to other continuously refined models. Along these lines, in conditions where information is absent or difficult to get, the ANN procedure gives the most achievable choice to flood foreseeing. Neural frameworks (ANNs) offer a technique for reducing the
insightful costs of topographical and Hydrological information by decreasing the proportion of time spent separating the data. The measurable investigation of territorial dry spells has been the fundamental subject of this paper. The fundamental target of the examination has been to build up a way to deal with the break down and evaluate provincial dry spells, so the spatial and fleeting examples of dry seasons of different degrees of seriousness can be portrayed and described. The investigation has been constrained to meteorological dry seasons dependent on yearly precipitation information as the fundamental driving capacity of water supply in a district. The methodology created depends on standardized and institutionalized precipitation information that are additionally examined and arranged dependent on a non parametric ANN calculation. It includes preparing ANN, assessing or introducing information, characterizing the information, deciding the dry season seriousness at a point, and deciding the local dry spell seriousness.
REFERENCES
1. Mohamed I. Alhajri, Nazar T. Ali, M. Shubair,” Classification of Indoor Environments for Iot, Applications: A Machine Learning Approach”, citation Information: Doi 10.1109/lawp. 2018.2869548, IEEE Antennas and Wireless Propagation Letters.
2. Sulafa Hag Elsafi,” Artificial Neural Networks (Anns) For FloodForecasting At Dongola Station in The River Nile, Sudan”, Alexandria Engineering Journal (2014) 53, 655–66.
3. Tuoyuan Cheng, Fouzi Harrou, Member,” Monitoring Influent Measurements at Water Resource Recovery Facility Using Data-driven Soft Sensor Approach”, IEEE, Ying Sun And Torove Leiknes. Doi 10.1109/jsen.2018.2875954, IEEE Sensors Journal.
4. Anteneh Belayneh, Jan Adamowski, “Drought Forecasting Using New Machine Learning Methods”, Belayneh A., Adamowski J. 2013. Drought Forecasting Using New Machine Learning Methods. Journal of Water and Land Development. No. 18 P. 3–12.
5. Amir Mosavi, Pinar Ozturk And Kwok-wing Chau, “Flood Prediction Using Machine Learning Models: Literature Review”, Water 2018, 10, 1536; doi:10.3390/w10111536
6. K. F. Fung, Y. F. Huang, C. H. Koo And Y. W. Soh,” Drought Forecasting: A Review of Modelling Approaches 2007–2017”. 7. D. Vito, Politecmico Di Milano, “Use of Multivariate Machine
Learning Analysis Techniques for Flood Risk Prevention”, https://doi.org/10.5194/isprs-archives-XLII-3-W4-549-2018. 8. Fi-john Chang , Kuolin Hsu And Li-chiu Chang ,” Flood Forecasting
Using Machine Learning Methods”, Water 2019 ,11,9;doi10.3390 / W11010009 , www.mdpi.com/journal/water.
9. A. L. E. Abreu And A. Chaves Neto, “Machine Learning Model for Predicting Evaporation Losses in Reservoirs”, IEEE Latin America Transactions, Vol. 16, No. 7, July 2018.
10. Dongjun Suh And Hyunyoung Kim, Jinsul Kim,” Estimation of Water Demand in Residential Building Using Machine Learning Approach”, 978-1-4673-6537-6/15/$31.00 ©2015 IEEE.
11. Ali Saremi, Kiarash Saremi , Amin Saremi And Mohsen Sadeghi ,” Spatial Artificial Neural Network (SANN) Based Regional Drought Analysis”,978-0-7695-4821-0/12 $26.00 © 2012 IEEE DOI 10.1109/CICSyN.2012.11 .
12. Naman Satiya, Vinit Varu, Aakanksha Gadagkar And Darshan Shaha, “Optimization of Water Consumption Using Dynamic Quota Based Smart Water Management System”, 978-1-5090-6255-3/17/$31.00 ©2017 IEEE.
13. Li-li Sheng, Wu-qun Cheng, Hui Xia, Xian-bing Wu And Xi-ping Zhang,” Prediction of Annual Precipitation Based on Fuzzy and Grey Markov Process”, 978-1-4244-6527-9/10/$26.00 ©2010 IEEE. 14. Xili Wang, Lei Ma and Xilin Wang,” Apply Semi-supervised Support
Vector Regression for Remote Sensing Water Quality Retrieving”, 978-1-4244-9566-5/10/$26.00 ©2010 IEEE.
AUTHORSPROFILE
D. Dakshin was born in Chennai, Tamil Nadu, India in the year 1999. He is a student currently perusing Computer Science and Engineering in SRM Institute Of Science And Technology located in Chennai, Tamil Nadu, India.
V. R. Rupesh was born in Chennai, Tamil Nadu,
India in the year 1999.He is a student currently perusing Computer Science and Engineering in SRM Institute Of Science And Technology located in Chennai, Tamil Nadu, India.
S. Praveen Kumar was born in Trichy, Tamil Nadu, India in the year 2000. He is a student currently perusing Computer Science and Engineering in SRM Institute Of Science And Technology located in Chennai, Tamil Nadu, India.