SDR 56/2012 5 April 2012
National Comparators for Further Education
and Work-Based Learning: 2010/11
The latest figures on learner outcomes in the Further Education (FE) and Work-based Learning (WBL) sectors in Wales show:
• The overall learning activity success rate for FE in 2010/11 was 81 per cent.
• The FE learning activity completion rate remained static at 90 per cent whereas the FE learning activity attainment rate increased by one percentage point to 90 per cent.
• WBL framework success rates were 83 per cent and 81 per cent in Apprenticeship and Foundation Apprenticeship programmes respectively.
Note that improvements to data quality continue to be made and may contribute to the year-on-year changes in learner outcome measures. Further to this, inconsistencies in the recording of learner data have been identified in the past year and this issue is expanded upon in pages 4 and 5 of this release. Therefore, year-on-year comparisons of learner outcomes should be undertaken with caution.
Chart 1: Trends in learner outcomes
0% 10% 20% 30% 40% 50% 60% 70% 80% 90% 100%
FE Completion FE Attainment FE Success WBL Framework Success
2008/09 2009/10 2010/11
This Statistical First Release presents information on learner outcomes for 2010/11, covering FE and WBL delivered by learning providers in Wales. The statistics are presented as national comparators broken down by level of study, type of learning aim, learner age and sector/subject area, and are derived from the Lifelong Learning Wales Record (LLWR).
Statistician: Scott Clifford Tel: 029 2082 5067 E-mail: [email protected] Next Update: April 2013 (provisional)
Outcomes in further education
Chart 1 shows that across all further education programmes in 2010/11, 90 per cent of learning activities were completed and of those activities with an assessable outcome, 90 per cent were attained. Overall, 81 per cent of learning activities were successfully completed and attained.
Analysis of FE success rates by sector/subject area (Chart 2) shows that:
• Success rates were highest in the areas of Hospitality and Catering; Agriculture, Horticulture and Animal Care; Retailing and Customer Service; Health, Public Services and Care;
Independent Living Skills; and Adult Basic Education.
• Success rates were lowest in the areas of Science and Mathematics; Business, Administration and Law; Social Sciences; Hair and Beauty; and Engineering and Manufacturing Technologies.
Chart 2: FE learning activity success rates by sector/subject area, 2010/11
0% 10% 20% 30% 40% 50% 60% 70% 80% 90% 100% Hospi tality and Cat ering Agricu ltur
e, Ho rtic ultur e an d A nim al Car e Reta iling an
d C ustom
er S ervic
e
Healt h, P
ubl ic S
ervic es a
nd Car e
Inde pen
dent Liv
ing S kills
Adul t Ba
sic E duca
tion
Leis ure,
Trav el a
nd T our ism Educ atio n an d Tr
aini ng Art a nd
Desi gn
Histo ry, P
hilos ophy and Theo logy Info rmat
ion and Com muni cation Tec hno logy Con stru ctio n, P
lannin g an
d the B uilt Env ironm ent Langu age
s, L itera
ture and Cu
lture
En glis
h for Spe
aker s of
Othe r Langu
ages Per form ing A rts Foun dat
ion f or W
ork
Eng ine
ering and M
anuf actur
ing T echn
ologi es Hair and
Bea uty So cial Sci ence s Busi ness, Adm inis
tration an d Law
Sci ence an
d M athem
atics 2010/11 National Comparator
Analysis of FE success rates by learner age group shows that:
• despite some variations for different programmes of study, there was little difference in overall success rates for learners aged 18 and under and those aged 19 and over;
Outcomes in work-based learning
Learners on Apprenticeship programmes have to achieve a range of qualifications including an NVQ, key skills and technical certificate in order to gain the full Apprenticeship ‘framework’. In 2010/11, 82 per cent of learners across all Apprenticeship and Foundation Apprenticeship programmes achieved this, compared to 80 per cent in 2009/10. However, this increase can be largely attributed to a
methodological change (see section 2.5 of the notes for further information).
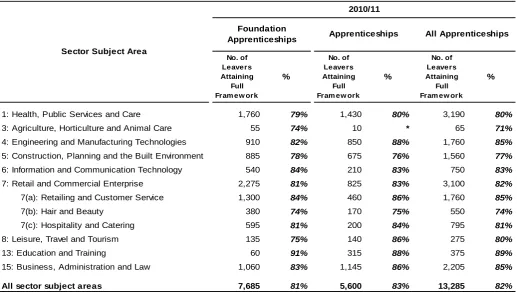
At a sector level, the success rate for Apprenticeships was slightly higher than for Foundation Apprenticeships. This was reflected across most areas, with only three areas having a higher
Foundation Apprenticeship success rate. All subject areas exceeded the Welsh Government contractual requirement of 50 per cent framework success and this is reflected in an overall NVQ success rate of 83 per cent on Apprenticeship programmes.
Overall, the best performing areas were Education and Training; Business, Administration and Law; Engineering and Manufacturing Technologies; and Retailing and Customer Service. Chart 3 shows the pattern of framework success rates on Apprenticeship programmes.
Chart 3: WBL framework success rates by sector/subject area, 2010/11
0% 10% 20% 30% 40% 50% 60% 70% 80% 90% 100% Educ ation and Traini ng Busi ness, Adm inist ratio n and
Law
Engi nee
ring a nd M anu fact urin g T echn ologi es Ret ailing a
nd C ustom
er S ervi
ce
Info rmat
ion a nd
Com mun
icatio n Te
chno logy
Hos pita
lity an d C
ater ing
Leisu re, T
rave l an d T ouris m Healt h, P ublic Ser vice s and
Ca re Cons truc tion, Pla nnin g an d th e B
uilt E nvi
ronme nt
Hair a nd B
eauty
Agric ultur
e, H ortic
ultur e and
Anim al C
are Foundation Apprenticeships Apprenticeships
Analysis of WBL activity success rates by learner age group shows that:
• On Foundation Apprenticeship, Apprenticeship and Skill Build learning activities, learners aged 19 and over generally have higher success rates than younger learners.
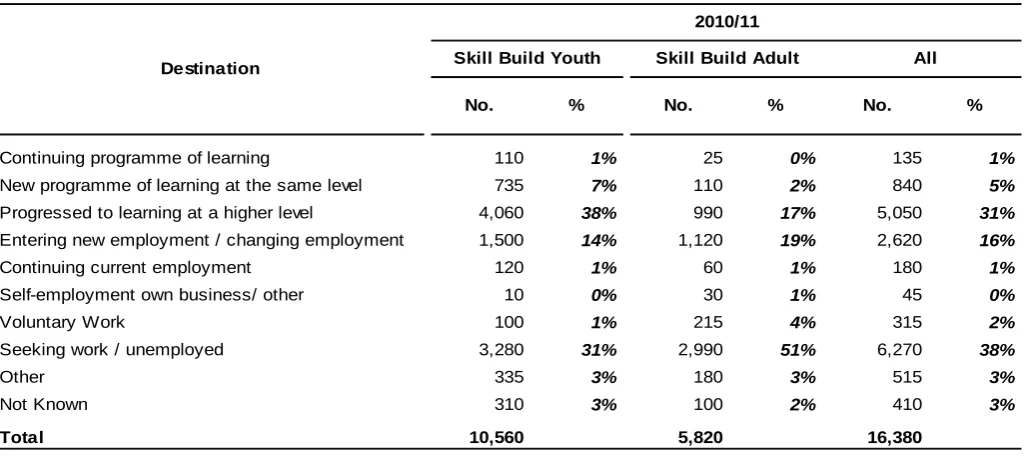
Analysis of learner destination, during the three month period following the end of a Skill Build learning programme, shows that:
• 45 per cent of leavers from Skill Build Youth programmes progressed into further learning compared with 19 per cent of leavers from Skill Build Adult programmes;
• 14 per cent from Skill Build Youth programmes entered employment compared with 19 per cent of leavers from Skill Build Adult programmes; and
Data Management Principles
Over the past year, discussions between officers from DfES (Department for Education and Skills) and providers have highlighted some inconsistencies in the way that learner outcomes are being recorded. To address these inconsistencies, a set of data management principles has been developed in partnership with CollegesWales and issued to FE institutions and WBL providers (in December 2011 and February 2012 respectively).
These principles provide clarification on a number of data management issues. In particular, the circumstances in which LLWR records can be deleted as well as on matters such as recording transfers between learning programmes and learning activities.
Both the deletion of LLWR records and the incorrect recording of transfers can contribute to an undercount of terminated learning activities and/or learning programmes and therefore potentially inflate the success rates detailed within this output.
Analysis has been undertaken to determine the impact of the guidelines on submitted data. The
following table compares the number of learning activities in the FE success rate denominator against an earlier freeze of the LLWR data.
Funding Audit freeze (taken September 2011)
Statistical Release freeze (taken February
2012)
Long 309,945 305,010 -1.6
Short1 106,920 104,750 -2.0
All learning aims 416,865 409,765 -1.7
Source: Lifelong Learning Wales Record (LLWR) 1
Includes e-learning learning aims Length
No. of Assessable, Terminated Learning Activities
% Difference
This table shows a decrease in the total number of learning activities comprising the FE success rate denominator which could indicate an inflation of the FE success rate. At an overall level the difference between freezes is lower than in a similar analysis for the 2009/10 academic year.
However, further analysis by institution reveals significant variation. A third of institutions showed no difference in learning activity volume between the freezes and a further third showed an increase in learning activity volume. The overall decrease in learning activity volume is largely attributable to a handful of institutions displaying substantial decreases (ie. greater than 10 per cent) which are indicative of underlying data-issues and their subsequent correction.
Additional analysis was undertaken to specifically investigate the recording of learning programmes and learning activities as transferred or continuing. If a learning activity is recorded as continuing or transferred, it is excluded from learning activity success rates. Similarly, if a learning programme is recorded as continuing or transferred, it is excluded from framework success rates.
The following two tables show the proportion of FE learning activities and WBL learning programmes in the respective learner outcome measure cohorts that are recorded as continuing or transferred in
2010/11 compared with equivalent data for 2009/10.
Proportion of FE learning activities recorded as continuing or transferred, by learning aim length and academic year
2009/10 2010/11 2009/10 2010/11
Long 2.1 0.7 6.4 8.0
Short1 3.4 0.6 0.9 2.1
All learning aims 2.5 0.7 4.6 6.3
Source: Lifelong Learning Wales Record (LLWR) 1
Includes e-learning learning aims Length
% of Continuing Learning Activities
% of Transferred Learning Activities
Proportion of WBL learning programmes recorded as continuing or transferred, by programme type and academic year
2009/10 2010/11 2009/10 2010/11
Foundation Apprenticeship 3.2 0.7 2.3 3.7
Apprenticeship 3.5 1.2 2.1 3.1
All Apprenticeships 3.3 0.9 2.2 3.4
Skill Build Youth 0.9 0.5 3.8 4.7
Skill Build Adult 0.5 0.2 0.4 1.5
All Skill Build 0.8 0.4 2.8 3.5
Source: Lifelong Learning Wales Record (LLWR)
Type of Learning Programme
% of Continuing Learning Programmes
% of Transferred Learning Programmes
The decrease in the proportion of FE learning activities and WBL learning programmes recorded as continuing corresponds with the anticipated impact of the guidelines. However, the increase in the proportion of records recorded as transferred is contrary to expectations.
Analysis suggests that inconsistencies remain in the recording of data and further detailed analysis will be required to explain the individual increases and decreases in learning activity and learning
programme volumes. However, given that success rates have largely remained static between 2009/10 and 2010/11, it seems that the guidelines have had limited impact at this stage and this has been offset by further overall improvements in learner outcomes. Further analysis will be required to assess and monitor the ongoing impact of the guidelines on LLWR data in subsequent years
Tables
Tables 1a – 1c Completion, attainment and success rates for FE provision by notional level, broad type of learning aim, learning aim length and age group
Tables 2a – 2c Completion, attainment and success rates for FE provision by sector/subject area and learning aim length
Table 3 Success rates for WBL provision by programme, broad type of learning aim and age group
Table 4 Success rates for WBL NVQ provision by sector/subject area and type of programme
Table 5 Framework success rates for WBL provision by sector/subject area type of programme and programme type
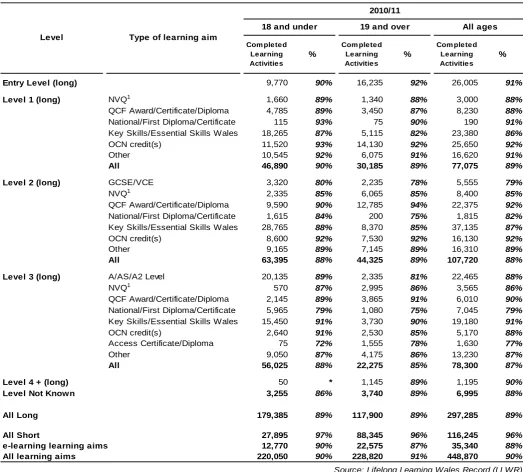
Table 1a - Completion rates for FE provision by notional level, broad type of learning aim, learning aim length and age group
Com pleted Learning Activities
%
Com pleted Le arning Activities
%
Com ple te d Learning Activities
%
Entry Level (long) 9,770 90% 16,235 92% 26,005 91%
Level 1 (long) NVQ1 1,660 89% 1,340 88% 3,000 88%
QCF Award/Certificate/Diploma 4,785 89% 3,450 87% 8,230 88% National/First Diploma/Certificate 115 93% 75 90% 190 91% Key Skills/Essential Skills Wales 18,265 87% 5,115 82% 23,380 86%
OCN credit(s) 11,520 93% 14,130 92% 25,650 92%
Other 10,545 92% 6,075 91% 16,620 91%
All 46,890 90% 30,185 89% 77,075 89%
Level 2 (long) GCSE/VCE 3,320 80% 2,235 78% 5,555 79%
NVQ1 2,335 85% 6,065 85% 8,400 85%
QCF Award/Certificate/Diploma 9,590 90% 12,785 94% 22,375 92% National/First Diploma/Certificate 1,615 84% 200 75% 1,815 82% Key Skills/Essential Skills Wales 28,765 88% 8,370 85% 37,135 87%
OCN credit(s) 8,600 92% 7,530 92% 16,130 92%
Other 9,165 89% 7,145 89% 16,310 89%
All 63,395 88% 44,325 89% 107,720 88%
Level 3 (long) A/AS/A2 Level 20,135 89% 2,335 81% 22,465 88%
NVQ1 570 87% 2,995 86% 3,565 86%
QCF Award/Certificate/Diploma 2,145 89% 3,865 91% 6,010 90% National/First Diploma/Certificate 5,965 79% 1,080 75% 7,045 79% Key Skills/Essential Skills Wales 15,450 91% 3,730 90% 19,180 91%
OCN credit(s) 2,640 91% 2,530 85% 5,170 88%
Access Certificate/Diploma 75 72% 1,555 78% 1,630 77%
Other 9,050 87% 4,175 86% 13,230 87%
All 56,025 88% 22,275 85% 78,300 87%
Level 4 + (long) 50 * 1,145 89% 1,195 90%
Level Not Known 3,255 86% 3,740 89% 6,995 88%
All Long 179,385 89% 117,900 89% 297,285 89%
All Short 27,895 97% 88,345 96% 116,245 96%
e-learning learning aims 12,770 90% 22,575 87% 35,340 88%
All learning aims 220,050 90% 228,820 91% 448,870 90%
Source: Lifelong Learning Wales Record (LLWR)
1 Includes QCF qualifications that directly replace NVQs
Type of learning aim Level
2010/11
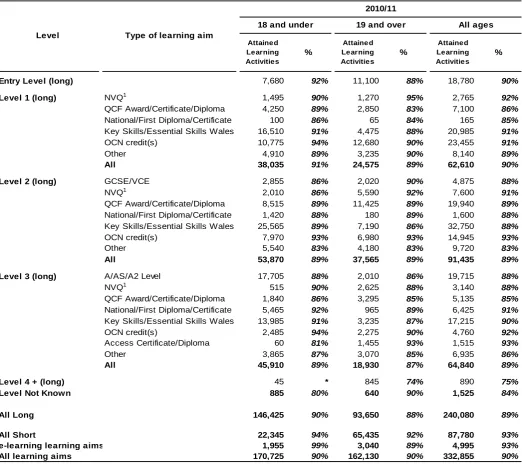
Table 1b - Attainment rates for FE provision by notional level, broad type of learning aim, learning aim length and age group
Attained Learning Activities
%
Attaine d Le arning Activities
%
Attained Learning Activities
%
Entry Level (long) 7,680 92% 11,100 88% 18,780 90%
Level 1 (long) NVQ1 1,495 90% 1,270 95% 2,765 92%
QCF Award/Certificate/Diploma 4,250 89% 2,850 83% 7,100 86% National/First Diploma/Certificate 100 86% 65 84% 165 85% Key Skills/Essential Skills Wales 16,510 91% 4,475 88% 20,985 91%
OCN credit(s) 10,775 94% 12,680 90% 23,455 91%
Other 4,910 89% 3,235 90% 8,140 89%
All 38,035 91% 24,575 89% 62,610 90%
Level 2 (long) GCSE/VCE 2,855 86% 2,020 90% 4,875 88%
NVQ1 2,010 86% 5,590 92% 7,600 91%
QCF Award/Certificate/Diploma 8,515 89% 11,425 89% 19,940 89% National/First Diploma/Certificate 1,420 88% 180 89% 1,600 88% Key Skills/Essential Skills Wales 25,565 89% 7,190 86% 32,750 88%
OCN credit(s) 7,970 93% 6,980 93% 14,945 93%
Other 5,540 83% 4,180 83% 9,720 83%
All 53,870 89% 37,565 89% 91,435 89%
Level 3 (long) A/AS/A2 Level 17,705 88% 2,010 86% 19,715 88%
NVQ1 515 90% 2,625 88% 3,140 88%
QCF Award/Certificate/Diploma 1,840 86% 3,295 85% 5,135 85% National/First Diploma/Certificate 5,465 92% 965 89% 6,425 91% Key Skills/Essential Skills Wales 13,985 91% 3,235 87% 17,215 90%
OCN credit(s) 2,485 94% 2,275 90% 4,760 92%
Access Certificate/Diploma 60 81% 1,455 93% 1,515 93%
Other 3,865 87% 3,070 85% 6,935 86%
All 45,910 89% 18,930 87% 64,840 89%
Level 4 + (long) 45 * 845 74% 890 75%
Level Not Known 885 80% 640 90% 1,525 84%
All Long 146,425 90% 93,650 88% 240,080 89%
All Short 22,345 94% 65,435 92% 87,780 93%
e-learning learning aims 1,955 99% 3,040 89% 4,995 93%
All learning aims 170,725 90% 162,130 90% 332,855 90%
Source: Lifelong Learning Wales Record (LLWR)
1 Includes QCF qualifications that directly replace NVQs
Type of learning aim Level
2010/11
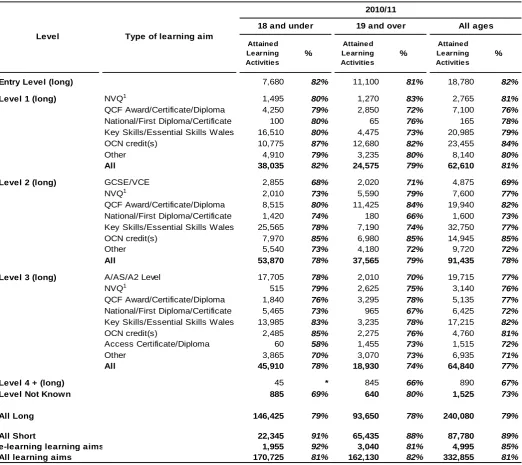
Table 1c - Success rates for FE provision by notional level, broad type of learning aim, learning aim length and age group
Attained Learning Activities
%
Attaine d Le arning Activities
%
Attained Learning Activities
%
Entry Level (long) 7,680 82% 11,100 81% 18,780 82%
Level 1 (long) NVQ1 1,495 80% 1,270 83% 2,765 81%
QCF Award/Certificate/Diploma 4,250 79% 2,850 72% 7,100 76% National/First Diploma/Certificate 100 80% 65 76% 165 78% Key Skills/Essential Skills Wales 16,510 80% 4,475 73% 20,985 79%
OCN credit(s) 10,775 87% 12,680 82% 23,455 84%
Other 4,910 79% 3,235 80% 8,140 80%
All 38,035 82% 24,575 79% 62,610 81%
Level 2 (long) GCSE/VCE 2,855 68% 2,020 71% 4,875 69%
NVQ1 2,010 73% 5,590 79% 7,600 77%
QCF Award/Certificate/Diploma 8,515 80% 11,425 84% 19,940 82% National/First Diploma/Certificate 1,420 74% 180 66% 1,600 73% Key Skills/Essential Skills Wales 25,565 78% 7,190 74% 32,750 77%
OCN credit(s) 7,970 85% 6,980 85% 14,945 85%
Other 5,540 73% 4,180 72% 9,720 72%
All 53,870 78% 37,565 79% 91,435 78%
Level 3 (long) A/AS/A2 Level 17,705 78% 2,010 70% 19,715 77%
NVQ1 515 79% 2,625 75% 3,140 76%
QCF Award/Certificate/Diploma 1,840 76% 3,295 78% 5,135 77% National/First Diploma/Certificate 5,465 73% 965 67% 6,425 72% Key Skills/Essential Skills Wales 13,985 83% 3,235 78% 17,215 82%
OCN credit(s) 2,485 85% 2,275 76% 4,760 81%
Access Certificate/Diploma 60 58% 1,455 73% 1,515 72%
Other 3,865 70% 3,070 73% 6,935 71%
All 45,910 78% 18,930 74% 64,840 77%
Level 4 + (long) 45 * 845 66% 890 67%
Level Not Known 885 69% 640 80% 1,525 73%
All Long 146,425 79% 93,650 78% 240,080 79%
All Short 22,345 91% 65,435 88% 87,780 89%
e-learning learning aims 1,955 92% 3,040 81% 4,995 85%
All learning aims 170,725 81% 162,130 82% 332,855 81%
Source: Lifelong Learning Wales Record (LLWR)
1 Includes QCF qualifications that directly replace NVQs
Type of learning aim Level
2010/11
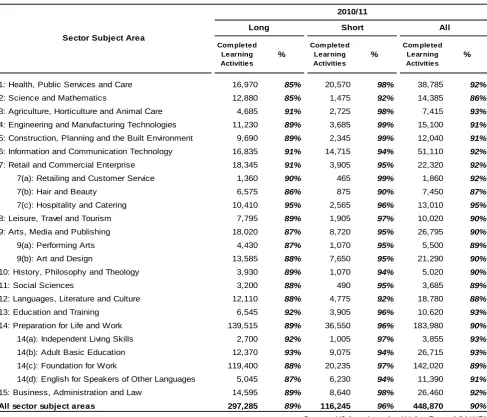
Table 2a - Completion rates for FE provision by sector subject area and learning aim length
Com pleted Learning Activities
%
Com ple te d Learning Activities
%
Com pleted Learning Activitie s
%
1: Health, Public Services and Care 16,970 85% 20,570 98% 38,785 92%
2: Science and Mathematics 12,880 85% 1,475 92% 14,385 86%
3: Agriculture, Horticulture and Animal Care 4,685 91% 2,725 98% 7,415 93%
4: Engineering and Manufacturing Technologies 11,230 89% 3,685 99% 15,100 91%
5: Construction, Planning and the Built Environment 9,690 89% 2,345 99% 12,040 91%
6: Information and Communication Technology 16,835 91% 14,715 94% 51,110 92%
7: Retail and Commercial Enterprise 18,345 91% 3,905 95% 22,320 92%
7(a): Retailing and Customer Service 1,360 90% 465 99% 1,860 92%
7(b): Hair and Beauty 6,575 86% 875 90% 7,450 87%
7(c): Hospitality and Catering 10,410 95% 2,565 96% 13,010 95%
8: Leisure, Travel and Tourism 7,795 89% 1,905 97% 10,020 90%
9: Arts, Media and Publishing 18,020 87% 8,720 95% 26,795 90%
9(a): Performing Arts 4,430 87% 1,070 95% 5,500 89%
9(b): Art and Design 13,585 88% 7,650 95% 21,290 90%
10: History, Philosophy and Theology 3,930 89% 1,070 94% 5,020 90%
11: Social Sciences 3,200 88% 490 95% 3,685 89%
12: Languages, Literature and Culture 12,110 88% 4,775 92% 18,780 88%
13: Education and Training 6,545 92% 3,905 96% 10,620 93%
14: Preparation for Life and Work 139,515 89% 36,550 96% 183,980 90%
14(a): Independent Living Skills 2,700 92% 1,005 97% 3,855 93%
14(b): Adult Basic Education 12,370 93% 9,075 94% 26,715 93%
14(c): Foundation for Work 119,400 88% 20,235 97% 142,020 89%
14(d): English for Speakers of Other Languages 5,045 87% 6,230 94% 11,390 91%
15: Business, Administration and Law 14,595 89% 8,640 98% 26,460 92%
All sector subject areas 297,285 89% 116,245 96% 448,870 90%
Source: Lifelong Learning Wales Record (LLWR)
Sector Subject Area
2010/11
Table 2b - Attainment rates for FE provision by sector subject area and learning aim length
Attained Learning Activities
%
Attained Learning Activities
%
Attained Learning Activitie s
%
1: Health, Public Services and Care 14,235 90% 16,850 95% 31,180 93%
2: Science and Mathematics 10,795 85% 1,195 91% 12,000 86%
3: Agriculture, Horticulture and Animal Care 3,750 90% 2,290 93% 6,045 91%
4: Engineering and Manufacturing Technologies 9,665 88% 2,185 89% 11,900 88%
5: Construction, Planning and the Built Environment 8,265 89% 1,850 92% 10,115 89%
6: Information and Communication Technology 11,755 87% 11,170 92% 25,780 89%
7: Retail and Commercial Enterprise 16,750 93% 2,895 92% 19,655 93%
7(a): Retailing and Customer Service 1,260 93% 250 93% 1,505 93%
7(b): Hair and Beauty 5,920 92% 590 90% 6,515 92%
7(c): Hospitality and Catering 9,570 94% 2,055 93% 11,635 93%
8: Leisure, Travel and Tourism 7,055 92% 1,555 97% 8,615 93%
9: Arts, Media and Publishing 15,780 92% 7,085 93% 22,880 92%
9(a): Performing Arts 3,805 90% 780 95% 4,580 91%
9(b): Art and Design 11,980 92% 6,310 93% 18,300 93%
10: History, Philosophy and Theology 3,430 92% 505 88% 3,935 92%
11: Social Sciences 2,820 90% 235 95% 3,050 90%
12: Languages, Literature and Culture 9,885 91% 3,875 92% 13,905 91%
13: Education and Training 5,200 88% 2,860 94% 8,080 90%
14: Preparation for Life and Work 109,530 89% 28,030 92% 139,205 90%
14(a): Independent Living Skills 1,285 91% 650 86% 1,935 89%
14(b): Adult Basic Education 6,770 92% 5,480 88% 13,535 91%
14(c): Foundation for Work 97,655 89% 17,275 95% 115,295 90%
14(d): English for Speakers of Other Languages 3,815 88% 4,625 88% 8,440 88%
15: Business, Administration and Law 10,805 84% 4,700 90% 15,635 86%
All sector subject areas 240,080 89% 87,780 93% 332,855 90%
Source: Lifelong Learning Wales Record (LLWR)
Sector Subject Area
2010/11
Table 2c - Success rates for FE provision by sector subject area and learning aim length
Attained Learning Activities
%
Attained Learning Activities
%
Attained Learning Activitie s
%
1: Health, Public Services and Care 14,235 76% 16,850 93% 31,180 85%
2: Science and Mathematics 10,795 72% 1,195 83% 12,000 73%
3: Agriculture, Horticulture and Animal Care 3,750 82% 2,290 91% 6,045 86%
4: Engineering and Manufacturing Technologies 9,665 78% 2,185 87% 11,900 80%
5: Construction, Planning and the Built Environment 8,265 79% 1,850 91% 10,115 81%
6: Information and Communication Technology 11,755 78% 11,170 86% 25,780 82%
7: Retail and Commercial Enterprise 16,750 85% 2,895 87% 19,655 85%
7(a): Retailing and Customer Service 1,260 84% 250 91% 1,505 85%
7(b): Hair and Beauty 5,920 80% 590 79% 6,515 80%
7(c): Hospitality and Catering 9,570 89% 2,055 89% 11,635 89%
8: Leisure, Travel and Tourism 7,055 82% 1,555 94% 8,615 84%
9: Arts, Media and Publishing 15,780 80% 7,085 88% 22,880 82%
9(a): Performing Arts 3,805 79% 780 91% 4,580 80%
9(b): Art and Design 11,980 80% 6,310 88% 18,300 83%
10: History, Philosophy and Theology 3,430 83% 505 82% 3,935 82%
11: Social Sciences 2,820 79% 235 88% 3,050 79%
12: Languages, Literature and Culture 9,885 79% 3,875 84% 13,905 81%
13: Education and Training 5,200 81% 2,860 89% 8,080 83%
14: Preparation for Life and Work 109,530 79% 28,030 88% 139,205 80%
14(a): Independent Living Skills 1,285 86% 650 83% 1,935 85%
14(b): Adult Basic Education 6,770 85% 5,480 83% 13,535 85%
14(c): Foundation for Work 97,655 78% 17,275 92% 115,295 80%
14(d): English for Speakers of Other Languages 3,815 78% 4,625 83% 8,440 80%
15: Business, Administration and Law 10,805 74% 4,700 87% 15,635 78%
All sector subject areas 240,080 79% 87,780 89% 332,855 81%
Source: Lifelong Learning Wales Record (LLWR)
Sector Subject Area
2010/11
Table 3 - Learning activity success rates for WBL provision by programme, type of learning aim and age group
Attained Learning Activities
%
Attained Learning Activities
%
Attained Learning Activities
%
Foundation NVQ1 1,810 77% 5,585 85% 7,395 83%
Apprenticeship QCF Award/Certificate/Diploma 315 74% 1,730 82% 2,045 80%
Key Skills/Essential Skills Wales 2,950 79% 10,595 86% 13,540 84%
Other 1,335 84% 3,560 88% 4,900 87%
All 6,410 79% 21,470 86% 27,880 84%
NVQ1 910 80% 4,960 85% 5,870 84%
QCF Award/Certificate/Diploma 25 * 800 82% 825 82%
Key Skills/Essential Skills Wales 1,010 84% 7,875 86% 8,885 86%
Other 785 85% 3,525 86% 4,310 86%
All 2,730 83% 17,155 86% 19,890 85%
NVQ1 * * 770 84% 770 84%
QCF Award/Certificate/Diploma 0 n/a 260 78% 260 78%
Key Skills/Essential Skills Wales 0 n/a 355 83% 355 83%
Other 0 n/a 30 * 30 *
All * * 1,415 82% 1,420 82%
NVQ1 0 n/a 25 * 25 *
QCF Award/Certificate/Diploma 0 * 0 * 0 *
Key Skills/Essential Skills Wales 10 * 50 86% 60 86%
Other 10 * 40 * 50 89%
All 15 * 115 88% 130 87%
Skill Build Youth NVQ1 1,335 68% 10 * 1,345 68%
QCF Award/Certificate/Diploma 4,320 70% 55 73% 4,370 70%
Key Skills/Essential Skills Wales 12,025 76% 100 72% 12,125 76%
Certificate in Adult Literacy 780 76% 10 * 790 76%
Certificate in Adult Numeracy 905 84% 10 * 915 83%
Gaining Opportunities & Living Skills (GOALS) 315 97% * * 320 97%
Pacific Institute 235 86% * * 235 86%
The ASDAN Foundation Training Award 0 n/a 0 n/a 0 n/a
Other 2,775 77% 25 * 2,800 77%
All 22,685 75% 215 74% 22,900 75%
Skill Build Adult NVQ1 60 67% 735 74% 790 73%
QCF Award/Certificate/Diploma 315 71% 3,890 77% 4,210 77%
Key Skills/Essential Skills Wales 675 73% 7,700 80% 8,375 79%
Certificate in Adult Literacy 20 * 210 75% 230 74%
Certificate in Adult Numeracy 25 * 235 83% 260 82%
Gaining Opportunities & Living Skills (GOALS) 65 93% 945 94% 1,005 94%
Pacific Institute 15 * 65 91% 75 92%
The ASDAN Foundation Training Award 0 n/a 0 n/a 0 n/a
Other 135 80% 1,395 81% 1,530 81%
All 1,305 74% 15,170 80% 16,475 79%
Flexible Learning NVQ1 10 * 750 93% 755 93%
QCF Award/Certificate/Diploma * * 180 89% 180 89%
Key Skills/Essential Skills Wales * * 45 70% 45 70%
Other * * 160 95% 160 95%
All 15 * 1,135 91% 1,145 92%
Source: Lifelong Learning Wales Record (LLWR)
1 Includes QCF qualifications that directly replace NVQs Pre Apprenticeship
Learning Modern Skills Diploma
2010/11
18 and under 19 and over All ages
Type of
Programme Type of learning aim
Table 4 - Learning activity success rates for apprenticeship NVQ1 provision by sector subject area and type of programme
Attained Learning Activities
%
Attained Learning Activities
%
Attained Le arning Activitie s
%
1: Health, Public Services and Care 1,790 83% 1,475 84% 3,265 84%
3: Agriculture, Horticulture and Animal Care 40 * * * 45 *
4: Engineering and Manufacturing Technologies 920 83% 1,005 89% 1,925 86% 5: Construction, Planning and the Built Environment 910 79% 770 74% 1,680 77% 6: Information and Communication Technology 290 86% 175 91% 465 88%
7: Retail and Commercial Enterprise 2,215 82% 810 84% 3,025 83%
7(a): Retailing and Customer Service 1,225 87% 435 88% 1,660 88%
7(b): Hair and Beauty 395 73% 170 74% 565 74%
7(c): Hospitality and Catering 595 79% 200 84% 800 80%
8: Leisure, Travel and Tourism 140 78% 140 87% 280 82%
13: Education and Training 55 93% 320 90% 375 90%
15: Business, Administration and Law 1,030 84% 1,165 87% 2,195 86%
All sector subject areas 9,610 83% 6,675 84% 13,260 83%
Source: Lifelong Learning Wales Record (LLWR)
1 Includes QCF qualifications that directly replace NVQs
Sector Subject Area
2010/11
Foundation
Apprenticeships Apprenticeships All Apprenticeships
Table 5 - Framework success rates for WBL provision by sector subject area and programme type
No. of Leavers Attaining
Full Fram e w ork
%
No. of Leave rs Attaining
Full Fram ew ork
%
No. of Leavers Attaining
Full Fram ew ork
%
1: Health, Public Services and Care 1,760 79% 1,430 80% 3,190 80%
3: Agriculture, Horticulture and Animal Care 55 74% 10 * 65 71%
4: Engineering and Manufacturing Technologies 910 82% 850 88% 1,760 85% 5: Construction, Planning and the Built Environment 885 78% 675 76% 1,560 77%
6: Information and Communication Technology 540 84% 210 83% 750 83%
7: Retail and Commercial Enterprise 2,275 81% 825 83% 3,100 82%
7(a): Retailing and Customer Service 1,300 84% 460 86% 1,760 85%
7(b): Hair and Beauty 380 74% 170 75% 550 74%
7(c): Hospitality and Catering 595 81% 200 84% 795 81%
8: Leisure, Travel and Tourism 135 75% 140 86% 275 80%
13: Education and Training 60 91% 315 88% 375 89%
15: Business, Administration and Law 1,060 83% 1,145 86% 2,205 85%
All sector subject areas 7,685 81% 5,600 83% 13,285 82%
Source: Lifelong Learning Wales Record (LLWR)
Sector Subject Area
2010/11
Foundation
[image:14.595.43.561.422.715.2]Table 6 - Destinations of Skill Build leavers in three month period following end of programme
No. % No. % No. %
Continuing programme of learning 110 1% 25 0% 135 1%
New programme of learning at the same level 735 7% 110 2% 840 5%
Progressed to learning at a higher level 4,060 38% 990 17% 5,050 31% Entering new employment / changing employment 1,500 14% 1,120 19% 2,620 16%
Continuing current employment 120 1% 60 1% 180 1%
Self-employment own business/ other 10 0% 30 1% 45 0%
Voluntary Work 100 1% 215 4% 315 2%
Seeking work / unemployed 3,280 31% 2,990 51% 6,270 38%
Other 335 3% 180 3% 515 3%
Not Known 310 3% 100 2% 410 3%
Total 10,560 5,820 16,380
Destination
2010/11
Notes
1. Data Sources
This Statistical First Release (SFR) summarises data on learner outcomes for 2010/11. It covers further education (FE) and work based learning (WBL) provision delivered by learning providers funded by DfES (Department for Education and Skills). However, the figures are not restricted to fundable provision at those providers.
Data on learners accessing FE and WBL provision across Wales is submitted electronically to DfES by learning providers via the Lifelong Learning Wales Record (LLWR). This data is used for funding, monitoring performance and outcomes and to inform strategy development. Furthermore, the data provides the official source of statistics on Post 16 (non-higher education) learners in Wales.
Further information on LLWR including user support manuals can be found at:
Welsh Government - Lifelong Learning Wales Record
Our statement of administrative sources, which also refers to this data source, can be found at:
Statement of Administrative Sources
2. Definitions
2.1 Terminology
• The term ‘academic year’ is used throughout this release to refer to the period 1 August to 31 July.
• The term ‘learning activity’ refers to a specific qualification or course pursued by a learner, for example, an NVQ or Key Skill. The term ‘learning programme’ refers to a group of related learning activities.
2.2 Cohorts
• The base cohorts underpinning tables 1a – 1c and 2a – 2c comprise all learning activities that were either expected to complete during the respective academic year or actually ended during the academic year but were expected to complete prior to it.
• The base cohorts underpinning tables 5 and 6 comprise all work based learning programmes recorded as ending in the respective academic year.
• The base cohorts underpinning tables 3 and 4 comprise all learning activities associated with work based learning programmes recorded as ending in the respective academic year.
2.3 Provision type
• For the purposes of this statistical release, WBL provision is defined as that submitted to the LLWR by a WBL provider or provision at FE institutions comprising a WBL designated learning
• Foundation Apprenticeships and Apprenticeships are employment-based learning programmes for employed learners aged 16 and above, to NVQ Level 2 or 3 respectively.
• The Skill Build programme offered those not in employment (unemployed, or inactive) work-related skills including pre-NVQ learning, vocationally focused qualifications at Levels 1, 2 and 3, help with Basic Skills, and key employability skills. From August 2011 onwards, the Skill Build programme has been replaced by the Traineeship and Steps to Employment programmes.
• Further education (FE) provision is defined as that submitted to the LLWR by an FE institution excluding provision categorised as WBL. Specifically, it excludes provision delivered by Merthyr Tydfil College which merged with the University of Glamorgan on 1 April 2006.
• Provision submitted to the LLWR by an FE institution but delivered by a Local Education Authority (LEA) as part of a subcontracting arrangement is categorised as FE provision.
• Higher Education (HE) level provision delivered by FE institutions has been excluded from this release.
• Welsh for Adults (WfA) provision submitted to the LLWR by Coleg Gwent has been excluded from this release.
• Pathways to Apprenticeships provision is excluded from this release as is data relating to the following WBL pilot programmes: Six Month Offer, Pre-Employment Training (formerly Local Employment Partnership Pre-Employment Training (LEP-PET)), Young Persons Guarantee – Routes into Work and Shared Apprenticeships.
2.4 Completion, Attainment and Success
• The completion rates shown in tables 1a and 2a are calculated as the number of learning activities completed divided by the number of learning activities terminated (completed or withdrawn).
• The attainment rates shown in tables 1b and 2b are calculated as the number of learning activities attained divided by the number of learning activities completed.
• The success rates shown in tables 1c, 2c, 3 and 4 are calculated as the number of learning activities attained divided by the number of learning activities terminated.
• Learning activities that are deemed to be non-assessable (i.e. do not lead to an associated award) are excluded from the denominators of the attainment and success rate calculations.
• Learning activities recorded as either transferred or continuing are excluded from all calculations.
2.5 Framework Success
• The framework success rates shown in table 5 are calculated as the number of learning programmes where the full framework has been achieved divided by the number of learning programmes terminated.
• Learning programmes recorded as terminated due to the learner being made redundant have been excluded from the calculation. This is a change in methodology from previously published
framework success rates.
2.6 Long / Short learning activities
• Tables 1a – 1c and 2a – 2c show results for both long and short learning activities. Short learning activities are ‘Other’ or OCN learning aims with an expected length of less than 24 weeks.
• Learning aims categorised as one of the main learning aim types (eg. A/AS level, NVQ, Key Skills) are treated as long, irrespective of expected length. This change to the methodology was introduced in 2010/11.
2.7 Learner Age Group
• A learner’s age group is calculated from their age at 31 August in the academic year they started their learning activity. Learners of unknown age are included in the age group 19 and over.
2.8 Sector/Subject Areas
• The sector/subject areas detailed in Tables 2a – 2c, 4 and 5 are based on the 15 first-tier areas of learning in the Qualifications and Curriculum Development Agency’s (QCDA) sector/subject framework and reflect the sub-areas used by Estyn for inspection purposes.
• The total lines include learning activities with unknown sector/subject areas.
• Apprenticeship programmes have been mapped to sector/subject areas in table 5 on the basis of the occupational sector code. The NVQs and QCF qualifications detailed in table 4 have been mapped to the same sector/subject area as the overarching programme.
2.9 Early Drop-out
• For FE provision, long learning activities that ended before 1 November of the academic year in which they commenced without completing have been classified as early drop-outs and excluded from calculations.
• In the case of WBL provision, long learning activities that ended within 6 weeks of their start date without completing have been classified as early drop-outs and excluded from calculations.
2.10 Destinations
• Changes to the data collected on learner destinations via the LLWR were implemented in 2010/11. As such, the information detailed in Table 6 is different to previous years and care should be taken when making comparisons across years.
3. Rounding and Suppression
• All figures in this Statistical Release are rounded to the nearest 5 and therefore there may be apparent slight differences between the sum of the constituent rows/columns and the totals. A ‘*’ represents numbers greater than 0 but less than 5.
• In addition, percentage calculations where the denominator is less than 50 have been suppressed and the percentage replaced with a ‘*‘.
4. Key Quality Information
This section provides a summary of information on this output against five dimensions of quality: Relevance, Accuracy, Timeliness and Punctuality, Accessibility and Clarity, and Comparability.
4.1 Relevance
The measures set out in this publication are primarily used:
• by the Welsh Government - DfES, to monitor providers’ performance and as baseline information to set targets for improvements as part of the Quality and Effectiveness Framework for post-16 learning;
• by Estyn, to inform inspection judgements on Key Question 1 ‘How well do learners achieve?’, and;
• by providers themselves, as a management tool to measure their own performance and benchmark themselves against sector averages, as part of their annual self-assessment cycles.
The Welsh Government and Estyn have a commitment to share data in order to minimise bureaucracy for providers and ensure consistent definitions of performance wherever possible and have worked together closely to develop these measures and a standard format for presenting data.
The measures are also used both within and outside the Welsh Government to monitor educational trends and as a baseline for further analysis of the underlying data. Some of the key users are:
• Ministers and the Members Research Service in the National Assembly for Wales;
• Officials in the Welsh Government;
• Other government departments;
• Students, researchers, and academics;
• Individual citizens, private companies, and the media.
These statistics are used in a variety of ways. Some examples of these are:
• general background and research;
• inclusion in reports and briefings;
• advice to Ministers;
• to inform and evaluate the education policy-making process in Wales.
4.2 Accuracy
Statisticians within the Welsh Government undertake a process of data-reconciliation ahead of
issued to FE institutions and WBL providers. Data quality issues are then followed up and resolved in liaison with DfES officials.
The following table summarises the improvements to FE institutions’ data quality over the last three years:
2007/08 2008/09 2009/10 2010/11
% of completed, assessable learning activities not
linking to an award 13 7 3 3
% of completed, assessable learning activities linking
to an award where the result is unknown 6 2 2 1
Source: Lifelong Learning Wales Record (LLWR)
Pages 4 and 5 of this release also refer to the potential impact on data quality following the issuing of new data management principles to providers during the 2011/12 academic year.
4.3 Timeliness and Punctuality
Data for a given academic year are published as soon as possible. The current annual timescale for the production of final learner outcomes data has been agreed in consultation with learning providers and balances timeliness against the need for accurate data-quality in order to underpin robust sector benchmarks. Statistics on a given academic year are drawn from a database based on the LLWR as at February following the end of the academic year. This first release is then produced and published as soon as possible during April and May.
4.4 Accessibility and Clarity
This statistical release is pre-announced and then published on the Statistics section of the Welsh Government website.
4.5 Comparability
Figures in this statistical release are comparable with previous years. Links to the previous three years’ releases are provided below:
National Comparators for Further Education and Work-Based Learning, 2009/10
National Comparators for Further Education and Work-Based Learning, 2008/09
National Comparators for Further Education and Work-Based Learning, 2007/08
Equivalent data on post-16 learner outcomes in England, Scotland and Northern Ireland can be found on the websites of the Data Service, Scottish Funding Council (SFC) and Department for Employment and Learning – Northern Ireland (DELNI) respectively:
The Data Service - Current Statistical First Release
Department for Employment & Learning Northern Ireland - Further Education Performance Statistics
However, due to differences in methodology and data collection, caution should be exercised in making direct comparisons with the figures contained within this release.
4.6 Coherence
Statistics on projected apprenticeship framework success rates were released by the Welsh Government on 20 December 2011.
The projected framework success rate methodology was developed in response to feedback from the WBL sector requesting more timely data on sector performance. The measure is intended to provide an early indication of final framework success rates by including those leavers where certification has been applied for but has yet to be received. Further information can be found in the release:
Projected Apprenticeship Framework Success Rates, 2010/11
Comparison of the projected framework success rates with the actual framework success rates for 2010/11 detailed in table 5 of this release show that:
• Actual framework success rates were higher than projected framework success rates for the majority of subject areas;
• At a sector level, actual framework success rates were 2 percentage points higher than the projected framework success rates; and
• The difference between actual and projected rates varied across subject areas with the largest differences in Construction, Planning and the Built Environment; Information and
Communication Technology; and Hair and Beauty.
5. Additional Information
5.1 Further dissemination of performance measures
More detailed tables including trends over time will be made available soon on StatsWales, a free to use service that allows visitors to view, manipulate, create and download data. Data for individual learning providers can be made available to users on request.
Learner Outcomes Reports (LORs) for individual providers will be published by DfES in April 2012:
Learner Outcomes Reports for Further Education
Learner Outcomes Reports for Work Based Learning Providers
5.2 Learner outcomes for Adult Community Learning
Analysis was undertaken last year in liaison with DfES and NIACE Dysgu Cymru in order to develop learner outcomes data for the Adult Community Learning (ACL) sector in Wales.
A statistical article summarising the results of this analysis was published on 14 July 2011:
Development of Learner Outcome Measures for Adult Community Learning
A further release detailing ACL learner outcomes for 2010/11 will be published in April.
5.3 Other outputs sourced from LLWR data
• Further Education, Work-based Learning and Community Learning in Wales, 2010/11 and 2011/12 (early figures) – headline national trends in volumes of learning, published 28 March 2012.
• Learning Network Analysis 2010/11 – bulletin providing analysis at both national and regional level for post-16 learners (excluding learners at HEIs) at FE Institutions, other training providers and school sixth forms in Wales, with extended coverage to include Welsh domiciled learners at similar providers located in England, due May 2012. Associated StatsWales tables include figures for individual FE institutions.
• Further Education, Work-based Learning and Community Learning in Wales Statistics, 2010/11 – Reference volume, due autumn 2012.