R E S E A R C H
Open Access
Identification and selective expansion of
functionally superior T cells expressing
chimeric antigen receptors
ZeNan L. Chang
1,2, Pamela A. Silver
3and Yvonne Y. Chen
1*Abstract
Background:T cells expressing chimeric antigen receptors (CARs) have shown exciting promise in cancer therapy, particularly in the treatment of B-cell malignancies. However, optimization of CAR-T cell production remains a trial-and-error exercise due to a lack of phenotypic benchmarks that are clearly predictive of anti-tumor functionality. A close examination of the dynamic changes experienced by CAR-T cells upon stimulation can improve understanding of CAR–T-cell biology and identify potential points for optimization in the production of highly functional T cells. Methods:Primary human T cells expressing a second-generation, anti-CD19 CAR were systematically examined for changes in phenotypic and functional responses to antigen exposure over time. Multi-color flow cytometry was performed to quantify dynamic changes in CAR-T cell viability, proliferation, as well as expression of various activation and exhaustion markers in response to varied antigen stimulation conditions.
Results:Stimulated CAR-T cells consistently bifurcate into two distinct subpopulations, only one of which (CARhi/CD25+) exhibit anti-tumor functions. The use of central memory T cells as the starting population and the resilience—but not antigen density—of antigen-presenting cells used to expand CAR-T cells were identified as critical parameters that augment the production of functionally superior T cells. We further demonstrate that the CARhi/CD25+subpopulation upregulates PD-1 but is resistant to PD-L1-induced dysfunction.
Conclusions:CAR-T cells expandedex vivofor adoptive T-cell therapy undergo dynamic phenotypic changes during the expansion process and result in two distinct populations with dramatically different functional capacities. Significant and sustained CD25 and CAR expression upregulation is predictive of robust anti-tumor functionality in antigen-stimulated T cells, despite their correlation with persistent PD-1 upregulation. The functionally superior subpopulation can be selectively augmented by careful calibration of antigen stimulation and the enrichment of central memory T-cell type.
Keywords:Chimeric antigen receptor, CD19 CAR-T cell, T-cell immunotherapy, PD-1
Background
Adoptive cell therapy using T cells engineered to express tumor-targeting chimeric antigen receptors (CARs) is a promising treatment strategy for refractory diseases such as metastatic melanoma, leukemia, and neuroblastoma [1–3]. Several recent trials have demonstrated remark-able clinical efficacy, particularly in the treatment of chronic and acute B-cell malignancies using CD19-targeting T cells [4–6]. Accumulating clinical reports
suggest that, in addition to patient-to-patient variations in tumor burden and overall health profile, the quality of individual T-cell products could significantly influence clinical outcome [5, 7]. However, it remains unclear which T-cell characteristics are the most critical and predictive of anti-tumor efficacy, and if and how such characteristics could be promoted during T-cell manufacturing. As CAR-T cell technology advances toward broader clinical use, the ability to identify critical T-cell characteristics and sys-tematically optimize CAR-T cell preparation has the po-tential to significantly improve the robustness of adoptive T-cell therapy.
* Correspondence:[email protected]
1Department of Chemical and Biomolecular Engineering, University of
California–Los Angeles, 420 Westwood Plaza, Boelter Hall 5531, Los Angeles, CA 90095, USA
Full list of author information is available at the end of the article
Considerable differences exist in the T-cell manufactur-ing protocols utilized thus far by different clinical groups, rendering efforts to systematically optimize the produc-tion process a practical challenge. Although numerous characterization assays and product release criteria are ap-plied to CAR-T cell products, they typically generate snap-shot views of T-cell properties and provide limited insight into dynamic changes experienced by T cells, which may occur throughoutin vitroexpansion as well as after infu-sion into the patient. For example, phenotypic characteris-tics such as % CD3+, % CD4+, % CD8+, and % CAR+are typically quantified at the end of cell expansion prior to product release for infusion [4–6, 8]. Cytokine production and cell lysis efficiency are measuredin vitroat single time points to confirm target-specific functional activity [5, 6, 9]. After adoptive transfer, in vivoperformance is measured by quantifying cytokine levels, tumor burden, and CAR+ T-cell count in the patient [4, 10, 11]. In these cha-racterization assays, observed anti-tumor functionality is attributed to CAR+ T cells as a homogenous group, and time-point data are used to generalize across cell-expansion and treatment periods. Given that current clinical protocols typically utilize unsorted, polyclonal T cells for infusion, the assumption of uniformity among CAR+T cells is one dictated by experimental constraints rather than our understanding of CAR–T-cell biology. In-deed, the recognition that not all T cells are equal has prompted active research on questions such as the opti-mal T-cell subtype and cytokine regimen to use for the production of therapeutic T cells [12–16]. However, trial-and-error remains the dominant approach to process optimization, as typical characterization methods such as those described above provide information that enables quality control but not in-depth understanding of how the T cells arrived at their present state of functionality or lack thereof. We propose that a close examination of dynamic changes experienced by CAR-T cells throughout a stimula-tion cycle can provide a deeper understanding of CAR– T-cell biology and identify potential points for optimization in the production of highly functional therapeutic T cells.
In this study, we perform quantitative evaluations of the phenotypic and functional changes exhibited by CAR-T cells undergoing antigen stimulation, including CAR–T-cell viability, proliferation, as well as the expres-sion of various T-cell activation and exhaustion markers. Contrary to the assumption of uniformity, stimulated CAR+ T cells consistently bifurcate into two distinct populations, only one of which (CARhi/CD25+) is func-tionally active. Detailed in vitro examinations reveal dy-namic changes in CAR-T cells over the course of antigen stimulation that are difficult to observe in vivo, and en-able the identification of strategies to maximize the CARhi/CD25+ cell subpopulation upon antigen stimula-tion. Finally, we demonstrate that CAR-T cells in the
functionally superior subpopulation upregulate PD-1 but remain functional when challenged by target cells over-expressing PD-L1, indicating an unexpected source of CAR-T cell resilience and highlighting properties to be considered in the development of combinatorial stra-tegies employing CAR-T cells and checkpoint therapies.
Methods
Cell line isolation and maintenance
Primary human CD4+ or CD8+ T cells were isolated from healthy donor blood samples obtained from the Boston Children’s Hospital Blood Donor Center and the UCLA Blood & Platelet Center. The RosetteSep CD4+or CD8+ Human T-cell Enrichment Cocktail (Stemcell Technologies) was used following manufacturer’s proto-cols. Central memory T cells were obtained by magnetic bead-based sorting. Anti-CD45RA MicroBeads (Miltenyi Biotec) were used to deplete CD45RA+ cells, and CD45RA−cells were stained with anti-CCR7-APC (clone G043H7, BioLegend) followed by anti-APC MicroBeads (Miltenyi Biotec) and enriched for CCR7+ cells. Isolated T cells were seeded at 1 × 10⁶ cells/ml in T-cell media (RPMI-1640 media (Lonza) with 10 % heat-inactivated fetal bovine serum (FBS; Life Technologies)) and stimu-lated with CD3/CD28 Dynabeads (Life Technologies) at a 1:1 cell:bead ratio. Cells were fed 50 IU/ml interleukin (IL)-2 (Chiron) and 1 ng/ml IL-15 (Miltenyi Biotec) every 48 h and passaged routinely. H9 and JeKo-1 cells were obtained from ATCC and maintained in RPMI-1640 with 10 % or 20 % heat-inactivated FBS, respectively. K562, TM-LCL, and Raji cells were generous gifts from Dr. Michael C. Jensen at Seattle Children’s Research Insti-tute and maintained in T-cell media. CD19+ K562 and CD19+H9 cells were generated by lentivirally transducing parental K562 and H9 cells with CD19 cDNA expressed from an EF1α promoter and sorting for CD19+ cells by fluorescence-activated cell sorting (FACS).
MicroBeads (Miltenyi Biotec) according to the manu-facturer’s protocols. CAR+T-cell fractions with different CAR expression levels were isolated by staining transduced cells with biotinylated Erbitux followed by streptavidin-PE (Jackson Immunoresearch), then sorted by FACS. Re-gardless of sorting method, CAR+ cells were expanded as previously described [18]. Briefly, 1 × 10⁶T cells were re-suspended in 50 ml total volume with 7 × 10⁶γ-irradiated (80 Gy) TM-LCL cells and supplemented with 50 IU/ml IL-2 and 1 ng/ml IL-15 every 48 h. Stimulated high and low CAR-expressing populations were isolated by FACS after 20 h of co-incubation with CD19+K562 target cells at a 2:1 effector-to-target (E:T) ratio.
Surface marker staining
For surface marker staining, 1 × 10⁵T cells were seeded in 96-well plates with indicated target cells (unirradiated) at a 2:1 E:T ratio unless otherwise noted. Experiments with 2.5 × 10⁵ T cells were performed in 24-well plates. When indicated,γ-irradiated (100 Gy) K562 targets were used. When indicated, CD28 monoclonal antibody (clone CD28.2; eBiosciences) was applied at 10μg/mL to provide CD28 costimulatory signal. Cell mixtures were incubated at 37 °C, and analyzed at the indicated time points with fluorescently labeled monoclonal antibodies binding CCR7 (clone REA108), CD19 (clone LT19), CD25 (clone BC96), CD27 (clone M-T271), CD45RA (clone T6D11), CD57 (clone TB03), PD-1 (PD1.3.1.3), PD-L1 (clone 29E.2A3), and Tim-3 (clone F38-2E2) (BioLegend and Miltenyi Biotec). V500-conjugated Annexin V (BD Biosciences) and Pacific Blue-conjugated Annexin V (BioLegend) were used to detect pre-apoptotic cells. CAR expression was probed with Protein L (Genscript) followed by PE-conjugated strep-tavidin (Jackson Immunoresearch) or with APC-conjugated polyclonal antibody binding human IgG Fcγ (Jackson Immunoresearch). EGFRt expression was probed with biotinylated Erbitux followed by PE-conjugated strep-tavidin. Analyses were performed on a MACSQuant VYB flow cytometer (Miltenyi Biotec) equipped with 405-, 488-, and 561-nm lasers. Data were processed using FlowJo soft-ware (TreeStar).
Cell proliferation and cytokine production quantification T cells were labeled with 0.2μM carboxyfluorescein dia-cetate succinimidyl ester (CFDA-SE, Life Technologies) for cell proliferation tracking. A human Th1/Th2 cyto-kine cytometric bead array kit (BD Biosciences) was used according to the manufacturer’s protocols to quantify cytokine secretion. Co-incubations with target cells were set up as described above. Samples were analyzed with a MACSQuant VYB flow cytometer and cytokine produc-tion was quantified using the FCAP Array 3.0 software (Soft Flow).
Quantitative PCR
Genomic DNA and cDNA were isolated from frozen T-cell pellets with DNeasy Blood and Tissue Kit (Qiagen) and SuperScript III CellsDirect cDNA Synthesis System (Life Technologies), respectively. Quantitative PCR (qPCR) was performed using SsoFast EvaGreen Supermix (Bio Rad), a CFX96 Real-Time Thermal Cycler (Bio Rad), and WPRE forward and reverse primers (5′-TTTCCGGGA
CTTTCGCTTTC and 5′-AAGGGACGTAGCAGAAG
GAC, respectively, for cDNA; or 5′-ACTGTGTTTGCT
GACGCAACCC and 5′-CAACACCACGGAATTGTCA
GTGCC, respectively, for gDNA) according to the ma-nufacturer’s protocols. The reference β-actin primer set 5′-TCCCTGGAGAAGAGCTACGA (forward) and 5′-AG CACTGTGTTGGCGTACAG (reverse) provided norma-lization control. The qPCR protocol included 30 cycles of a 5-s denaturation step at 95 °C for cDNA and 98 °C for gDNA, and a 5-s annealing/extension step at 60 °C. All re-actions were performed in quadruplicates, and threshold cycle (Ct) values were averaged to obtain the arithmetic mean. Relative WPRE levels were calculated with the fol-lowing formula:
RL
¼
ð
ε
ActinÞ
Ct;Actin
ε
WPREð
Þ
Ct;WPREwhere RL indicates relative WPRE levels, εx indicates
primer efficiency for gene x, and Ct,x indicates the
aver-aged Ct value for gene x. Standard deviation in relative WPRE levels was calculated with the following formula:
s:d:¼
ffiffiffiffiffiffiffiffiffiffiffiffiffiffiffiffiffiffiffiffiffiffiffiffiffiffiffiffiffiffiffiffiffiffiffiffiffiffiffiffiffiffiffiffiffiffiffiffiffiffiffiffiffiffiffiffiffiffiffiffiffiffiffiffiffiffiffiffiffiffiffiffiffiffiffiffiffiffiffiffiffiffiffiffiffiffiffiffiffiffiffiffiffiffiffiffiffiffiffiffiffiffiffiffi
RL lnεActin
ð Þ2 s:d:
Actin
ð Þ2þRL lnε
WPRE
ð Þ2s:d:
WPRE
ð Þ2
q
where s.d.x indicates the standard deviation calculated
from the quadruplicate samples for gene x.
Statistical methods
Data are presented as means ± standard deviations as stated in figure legends. Results were analyzed by two-tailed unpaired Student’sttest with simple Bonferroni cor-rection for multiple comparisons when appropriate. Tests were conducted with statistical significance set atp< 0.05.
Results
quantification of CAR expression via antibody staining of surface-bound EGFRt, without disrupting potential interac-tions between CAR molecules and their ligands [20]. Co-staining experiments confirmed that EGFRt Co-staining tightly correlates with direct CAR staining in both stimulated and unstimulated CAR-T cells (Additional file 1: Figure S1). EGFRt is particularly useful to track the expression of the anti-CD19 CAR in this study because the anti-CD19 scFv used is only weakly stained by reagents such as protein L and anti-Fab antibody that typically bind scFvs. Unless spe-cified otherwise, we have used EGFRt to measure CAR ex-pression in the studies reported here.
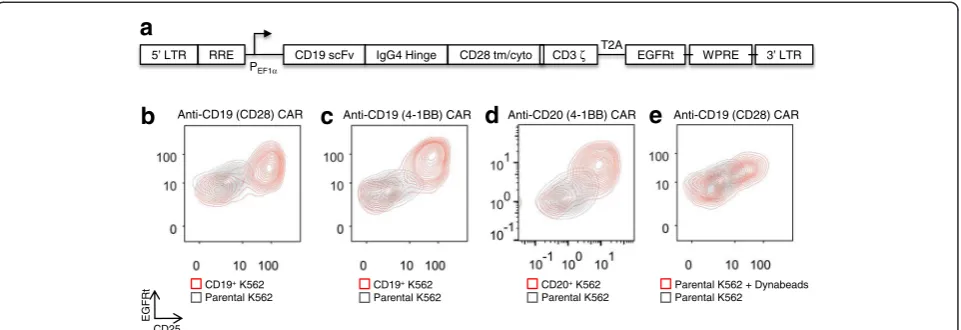
CAR-T cells were co-incubated with parental (CD19−) or CD19+K562 target cells and monitored for five days. A CARhi/CD25+ group with elevated CAR expression con-sistently emerged within 24 h of co-incubation, resulting in a population distinct from the CARlo/CD25− group, which maintained the original CAR expression level (Fig. 1b–d). This population bifurcation is observed in both CD4+and CD8+T cells (Fig. 1b and Additional file 2: Figure S2), is independent of the co-stimulatory signals present in the CAR (either CD28 or 4-1BB; Fig. 1b, c), and is not restricted to a particular antigen (either CD19 or CD20; Fig. 1c, d). We also observed the emergence of CARhicells after stimulating CAR-T cells with CD3/CD28 beads (Fig. 1e), indicating that the population bifurcation is not unique to antigen presentation by K562 cells or to the CAR signaling domain. Instead, it also occurs when T cells are stimulated via the endogenous T-cell receptor (TCR)/CD28 machinery. In all instances studied, CARlo cells exhibited low or no expression of the activation marker CD25 while CARhi cells showed robust CD25
upregulation (Fig. 1b–e), suggesting distinct activation states for the CARhiand CARlopopulations.
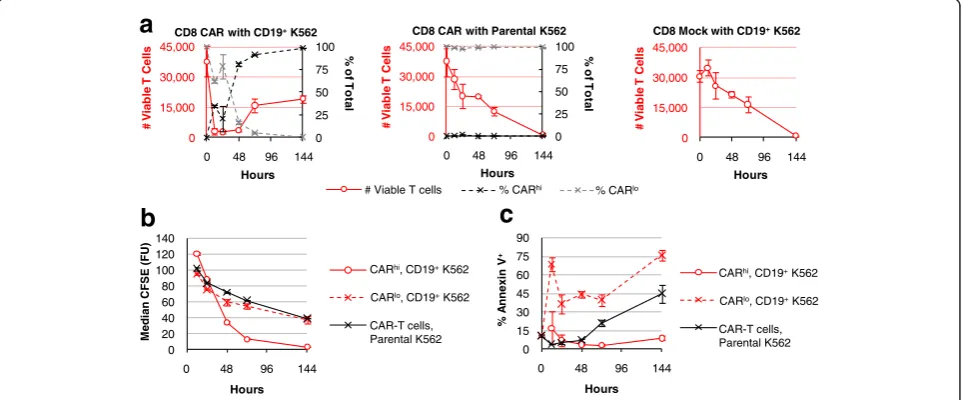
CARhibut not CARlocells exhibit robust T-cell functions Given their differences in CD25 expression, we hypothe-sized that the CARhi subpopulation is productively acti-vated while CARlocells remain inactive or are anergized. During co-incubation with CD19+ target cells in the absence of exogenous cytokines, CD8+ T cells expressing the CD19 CAR undergo a rapid and dramatic initial decline in viable T-cell count, followed by a population rebound in which CARhi cells emerge as the dominant T-cell group (Fig. 2a), consistent with the hypothesis that only CARhi cells are productively activated. In contrast, mock-transduced T cells as well as CAR-T cells co-incubated with parental (CD19−) K562 cells show a gra-dual decline in viable T-cell count without changes in CAR expression level, indicating that the dynamic popula-tion changes observed in Fig. 2a are specifically triggered by antigen stimulation. Primary CD4+CAR-T cells as well as mixed CD4+and CD8+CAR-T cells show the same pat-terns of population dynamics (Additional file 3: Figure S3), demonstrating that the behavior is not unique to the CD8+phenotype and is also representative of mixed CD4+ and CD8+T cells typically used in therapeutic settings.
CFSE dilution and Annexin V staining results demon-strate that CARhicells proliferate robustly with minimal apoptosis; in contrast, CARlocells divide at the same low rate as unstimulated CAR-T cells, and exhibit increased cell death compared to both CARhiand unstimulated cells (Fig. 2b, c). These results further support the hypothesis that the CARlo cells, despite expressing a
second-b
a
d
c
e
CD19+K562
Parental K562
Anti-CD19 (CD28) CAR Anti-CD19 (4-1BB) CAR Anti-CD20 (4-1BB) CAR Anti-CD19 (CD28) CAR
CD19+K562
Parental K562
CD20+K562
Parental K562
Parental K562 + Dynabeads Parental K562
CD25
EGFR
t
CD19 scFv IgG4 Hinge CD28 tm/cyto CD3 ζ T2A EGFRt
RRE
5’ LTR WPRE 3’ LTR
PEF1α
Fig. 1A CARhi/CD25+population emerges upon antigen stimulation of CAR-T cells.aSchematic of the second-generation anti-CD19 CAR with CD28
co-stimulatory domain; cyto: cytoplasmic domain; EGFRt: truncated EGFR peptide; LTR: long terminal repeats; RRE: Rev responsive element; tm: transmembrane
domain; scFv: single chain variable fragment; T2A:Thosea asignavirus 2A peptide; WPRE: woodchuck hepatitis virus posttranscriptional response
element.b-eCD8+T cells expressing various CARs separate into CARhi/CD25+and CARlo/CD25−populations within 24 h of antigen or CD3/CD28
stimulation. T cells expressing anti-CD19 CARs withbCD28 orc4-1BB co-stimulation domain ordan anti-CD20 CAR with 4-1BB all result in population
polarization upon stimulation with K562 target cells expressing cognate antigens.eCAR–T-cell stimulation with magnetic beads coated with anti-CD3
[image:4.595.59.540.89.254.2]generation CAR containing a co-stimulation domain, have not been properly activated.
In addition to differences in proliferative potentials, CARhicells exhibit clearly superior functional profiles com-pared to CARlo cells. The two CD19 CAR-T cell popula-tions were separated by FACS after 20 h of co-incubation with CD19+K562 target cells. Multiplex cytokine measure-ments revealed robust Th1 cytokine production by CARhi cells during the 24-h period following cell sorting (Fig. 3a). In contrast, CARlo cells produced relatively high levels of IFN-γ but not TNF-α or IL-2, consistent with previous study reporting the ability of anergic T cells to produce IFN-γbut not IL-2 [21] (Fig. 3a).
CAR-T cells have been reported to serve as serial killers of tumor cells in successfully treated patients [4], and the ability to maintain functionality in the face of high tumor burden and repeated stimulation is critical to the therapeutic efficacy of CAR-T cells. Upon re-exposure to target cells, sorted CD8+ CARlo T cells showed minimal target-cell lysis (Fig. 3b). In contrast, CD8+ CARhiT cells rapidly eliminated CD19+ K562 tar-gets, achieving even more complete target clearance than unsorted CAR-T cells (Fig. 3b). Both T-cell popula-tions underwent a contraction in viable T-cell count upon antigen exposure, but CARhi cells greatly outper-formed CARlocells in subsequent proliferation (Fig. 3c). 0 20 40 60 80 100 120 140
0 48 96 144
Hours
a
c
b
CD8 CAR with CD19+K562 CD8 CAR with Parental K562 CD8 Mock with CD19+K562
% CARlo
% CARhi
# Viable T cells
CARhi, CD19+K562
CARlo, CD19+K562
CAR-T cells, Parental K562
CARhi, CD19+K562
CARlo, CD19+K562
CAR-T cells, Parental K562 M e di an CFS E (FU) % A nnex in V + 0 15 30 45 60 75 90
0 48 96 144
Hours
0 15,000 30,000 45,000
0 48 96 144
# V iab le T C el ls Hours 0 25 50 75 100 0 15,000 30,000 45,000
0 48 96 144
% of Tota
l # V iab le T C e lls Hours 0 25 50 75 100 0 15,000 30,000 45,000
0 48 96 144
% of Tota
l # V ia b le T C e lls Hours
Fig. 2Antigen-stimulated CAR-T cells undergo selective expansion of the CARhicompartment. CFSE-labeled, CD8+CAR-expressing cells or mock-transduced
(CAR−) T cells were co-incubated with parental (CD19−) or CD19+K562 targets without exogenous cytokines and monitored foratotal T-cell count (left red
axis) and CARhior CARloas a fraction of total CAR-T cells (right black axis),bmedian CFSE intensity, andcAnnexin V staining. Average values of
triplicates are shown with error bars indicating ± 1 standard deviation (s.d.)
0 25,000 50,000 75,000
0 24 48 72 96 120
# V iab le T C e lls Hours 0 10,000 20,000 30,000 40,000
0 24 48 72 96 120
# V ia b le T a rg e t C e lls Hours
CARhi/Parental K562 CARlo/Parental K562
CARhi/CD19+K562 CARlo/CD19+K562
CARhi CARlo
b
CARhi CARlo Unsorted CAR 0 2,000 4,000 6,000IFN-γ TNF-αIL-2 IL-10 IL-6 IL-4
pg/ mL
a
d
c
0 2,000 4,000 6,000IFN-γ TNF-αIL-2 IL-10 IL-6 IL-4
pg/
mL CAR
hi
CARlo
Fig. 3CARhiand CARloT cells exhibit distinct functional capabilities.aCARhiand CARlocells were sorted and subsequently cultured without antigen
stimulation or exogenous cytokines. Cytokine production was measured 24 h post sorting.b-dSorted CARhiand CARlocells were co-incubated with
CD19+K562 targets without exogenous cytokines and monitored forbviable target-cell count,cviable T-cell count, anddcytokine production after
24 h of co-incubation. Sorted CARlovalues inbandcare from single samples due to the rarity of viable cells recovered for this population from cell
[image:5.595.58.540.91.291.2] [image:5.595.58.540.521.675.2]Furthermore, CARhi but not CARlo cells robustly se-creted the Th1 cytokines TNF-α and IL-2 upon antigen re-challenge (Fig. 3d). As previously observed, CARlo cells retained the ability to produce IFN-γ(Fig. 3d). The contrasts between CARhi and CARlo cells described above were also observed among CD4+ CAR-T cells (Additional file 4: Figure S4), indicating the functional disparities observed are intrinsic to CARhi vs. CARlo subpopulations and are not restricted to the CD8+ phenotype. The clear functional superiority of CARhi cells suggests that maximization of CARhicells within a given CAR-T cell preparation may enhance the anti-tumor potential of the cell product. We next explored the source of the CARhi phenotype and methods to direct the T cell population toward this functional subset.
The CARhiphenotype is a transient state of activation
induced by antigen stimulation
Efforts to maximize CARhi cells require knowledge of their origin. One possibility is that CARhicells are gene-tically encoded with higher CAR copy numbers, and their superior proliferative capability enables their rapid enrichment after antigen stimulation, despite their appa-rent absence from the original CAR+ T-cell population. Alternatively, CARhi cells may be genetically similar to CARlo cells, but productive stimulation results in a distinct, activated state. To distinguish between these two possibilities, CD8+ T cells were sorted into three populations with different CAR expression levels prior
to antigen stimulation (Additional file 5: Figure S5). After cell expansion over 9 days in culture, qPCR per-formed on genomic DNA confirmed significant diffe-rences in the copy number of the CAR transgene in the three populations (Fig. 4a). Upon antigen stimulation, all three populations were able to generate CARhicells with clearly elevated CAR expression (Fig. 4b). In fact, T cells with the lowest CAR genomic copy number yielded the highest % CARhiand the highest CD25 expression level among CARhi cells upon antigen stimulation (Fig. 4b), indicating that a high genetic copy number of the CAR transgene is neither essential nor automatically condu-cive to the emergence of the CARhiphenotype.
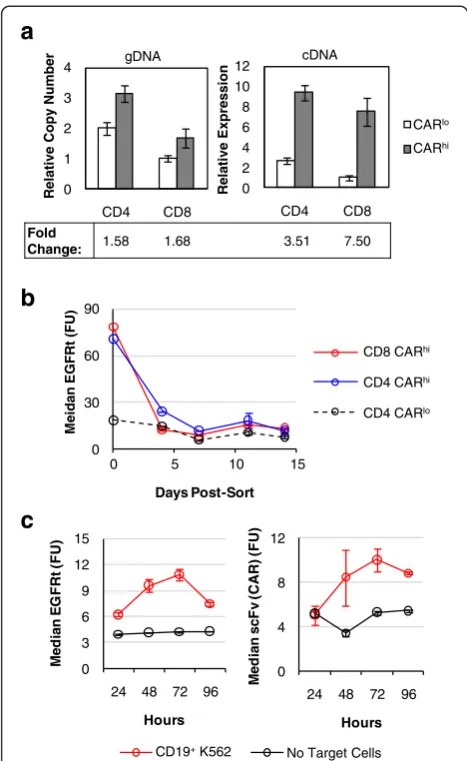
Quantitative PCR performed on sorted CARhi and CARlo cells showed that CARhi and CARlo cells differ slightly in genomic copy numbers of the CAR construct (Fig. 5a). However, the two populations diverge more prominently in CAR transcription levels, with CARhi cells overexpressing the anti-CD19 CAR mRNA by 3.5 folds (CD4+ T cells) or 7.5 folds (CD8+ T cells) com-pared to CARlocells (Fig. 5a). In addition, CAR expres-sion levels in CARhi cells return to baseline (i.e., the same level as unstimulated and CARlocells) within days after the removal of antigen stimulation (Fig. 5b), indi-cating that the CARhiphenotype is predominantly due to transient upregulation of CAR expression. Further-more, antigen-stimulated CAR-T cells upregulate the surface expression of both CAR and EGFRt, which are co-transcribed as one mRNA but translated into two
1.00 x 2.81 x
4.72 x
0 1 2 3 4 5 6 7
Lowest Gate
Middle Gate
Highest Gate
Rel
a
ti
ve G
e
n
o
mi
c
C
opy
#
a
b
Low Copy # Mid Copy # High Copy #CD25
EGFR
t
CD19+K562
No target
Fig. 4CARhiphenotype does not require high genomic copy number of CAR transgene.aRelative genomic CAR copy number in three sorted
CAR–T-cell populations as determined by quantitative PCR relative to the housekeeping geneβ-actin. The lowest copy number is set to 1. Values
are averages of quadruplicates with error bars indicating ± 1 s.d.bCAR–T-cell populations with varying genomic CAR copy number separate into
[image:6.595.55.538.456.681.2]separate proteins (Fig. 5c and Additional file 1: Figure S1D). This result indicates that the increase in CAR sur-face expression is not due to CAR-specific changes in post-translational processes such as surface localization, receptor endocytosis, or protein degradation. Taken to-gether, these data indicate that elevated CAR expression in CARhi cells is mainly a result of transient CAR tran-script upregulation in response to cell activation, and that increasing the copy number of the CAR transgene is un-likely to be the most effective means of promoting the CARhiphenotype.
Overstimulation results in loss of the CARhiphenotype One approach to maximizing CARhicells is to prevent the dysfunctional CARlostate. Given that the CARhi pheno-type is induced by antigen stimulation, we next investi-gated whether the CARlo cells fail to upregulate CAR expression because they experienced inadequate stimula-tion or if they became exhausted due to overstimulastimula-tion. When sorted CARhicells were re-challenged with antigen, the majority retained elevated CAR expression but a small population fell into the CARlogate (Fig. 6), suggesting that repeated antigen exposure anergized a minority of the CARhicells. Meanwhile, a large portion of CARlocells ex-perienced further reduction in CAR expression and no cells moved into the CARhi regime upon antigen re-challenge (Fig. 6). These results support the hypothesis that a sufficiently strong stimulation is required for the CARhi phenotype, but overstimulation results in the ex-haustion of activated cells and a decline into the dysfunc-tional CARlo/CD25−state. Additional antigen challenge to CARlocells would only further decrease CAR expression and T-cell functionality. These results are consistent with our previous observation that T cells with the highest gen-omic copy number of the CAR transgene (and thus the highest capacity to receive antigen stimulation) yielded the largest proportion of CARlocells after antigen stimulation (Fig. 4b). Therefore, maximization of the CARhi popula-tion requires precise calibrapopula-tion of antigen stimulapopula-tion, and a systematic approach to this task would facilitate the optimization of the cell production process.
Persistent antigen stimulation facilitates CARhiexpansion Several stimulation conditions were evaluated to deter-mine an effective protocol for the preparation of T cells with the CARhi phenotype. Since co-stimulation plays a major role in achieving productive T-cell activation, we first examined whether additional co-stimulation could enhance CARhidevelopment and forestall the emergence of non-functional CARlocells. However, supplementing a CD28 agonist antibody to CAR-T cells immediately prior to antigen exposure did not significantly alter the CARhi vs. CARlodistribution dynamics nor impact the absolute CARhicell numbers (Additional file 6: Figure S6).
T-cell expansion with the aid of antigen-presenting feeder cells is a well-established method for CAR-T cell preparation [18, 22, 23]. We next evaluated multiple feeder cell lines for their ability to support CARhi/CD25+ cell generation (Fig. 7a–c). CD8+ CAR-T cells were co-incubated at a 2:1 effector-to-target (E:T) ratio with se-veral CD19+ target cell lines, including naturally CD19+ JeKo-1, Raji, and TM-LCL cells, as well as K562 and H9 cells modified to stably express CD19. Besides JeKo-1 cells, which were depleted rapidly, all target cell lines tested resulted in the emergence of CARhi cells, and CARhi expression was always correlated with CD25 0
30 60 90
0 5 10 15
Days Post-Sort
0 2 4 6 8 10 12
CD4 CD8
0 1 2 3 4
CD4 CD8
a
c
CD19+K562 No Target Cells
M
e
idan
EGFR
t
(FU
)
gDNA
R
e
lative C
opy
N
u
mber
b
cDNA
R
e
la
ti
v
e
Ex
pre
s
s
ion
CD8 CARhi
CD4 CARhi
CD4 CARlo
CARlo
CARhi
Fold
Change: 1.58 1.68 3.51 7.50
0 4 8 12
24 48 72 96
M
e
di
a
n
s
c
Fv
(C
A
R
) (FU
)
Hours
0 3 6 9 12 15
24 48 72 96
M
e
di
a
n
E
G
FR
t (FU
)
Hours
Fig. 5CARhiT cells arise from transient CAR transcript upregulation.
aGenomic copy number and mRNA expression of CARhiand
CARlopopulations as determined by quantitative PCR relative to the
housekeeping geneβ-actin. The lowest expression level or copy
number is set to 1.bEGFRt expression level of sorted cells maintained
in culture with exogenous IL-2 and IL-15 and no antigen stimulation.
cEGFRt and CAR surface expression on CD8+CAR-T cells as measured by
Erbitux and Protein-L staining, respectively, over 4 days of co-incubation
with or without CD19+K562 target cells. Values inbare averages of
[image:7.595.56.290.87.468.2]CAR
lo
CAR
hi
CD19+K562
Parental K562
Normalized to
Mode
Normalized to
Mode
Normalized to
Mode
Normalized to
Mode
EGFRt
EGFRt
EGFRt
EGFRt
Fig. 6Antigen re-challenge results in CAR expression reduction. Sorted CD8+CARhiand CARlocells were assayed for EGFRt surface expression after
24 h of co-incubation. A small fraction of CARhicells becomes CARloupon antigen re-challenge, while a significant reduction in CAR expression is
observed among CARlocells after stimulation
0 10 20 30 40 50 60 70
12 24 48 120
Hours
0 10,000 20,000 30,000 40,000 50,000
0 12 24 48
Hours
0 2,500 5,000 7,500 10,000
12 24 48 120
Hours
a
b
c
d
e
CD19+K562 TM-LCL CD19+H9 Raji JeKo-1
1:2 2:1 5:1 10:1
# CA
R
hi
C
e
lls
# V
iabl
e
T
a
rget
Cel
ls
M
e
di
an C
D
25
(FU)
of
CA
R
hi
C
e
lls
0 20 40 60 80 100 120 140
12 24 48 120
Hours
M
e
di
an C
D
25
(FU)
A
m
ong
CA
R
hi
Cel
ls
0 10,000 20,000 30,000 40,000 50,000 60,000
12 24 48 120
Hours
# CA
R
hi
Cel
ls
Fig. 7Varying CAR-T cell stimulation conditions impacts the dynamics of the CARhiresponse.a-c1 × 105CD8+CAR-T–cells were co-incubated
with various target cell lines at 2:1 E:T ratio and monitored foratarget cell counts,bnumber of CARhiT cells, andcCD25 expression among
CARhicells.d-e2.5 × 105CD8+CAR-T cells were co-incubated with CD19+K562 at various E:T ratios and monitored fordnumber of CARhicells
[image:8.595.57.541.90.352.2] [image:8.595.54.541.391.685.2]upregulation (Additional file 7: Figure S7). However, not all CARhicells upregulated the activation marker equally (Fig. 7c). Considering both the number of CARhi/CD25+ cells and the intensity of CD25 expression (Fig. 7b, c), the results suggest CD19+ K562 and TM-LCL cells are both suitable candidates as feeder cells for CD19 CAR-T cell expansion. Interestingly, these two cell lines are also the most resistant to CAR-T cell–mediated lysis among the target cell lines tested (Fig. 7a). In contrast, antigen ex-pression level on target cells shows no correlation with the target cells’susceptibility to T-cell–mediated lysis or with CARhicell development (Additional file 8: Figure S8). Therefore, it is the persistence of antigen presentation ra-ther than the antigen density on individual target cells that predicts CARhi emergence patterns. The most resilient target cell line, CD19+ K562, resulted in a relatively small CARhipopulation at early time points, but the total num-ber and CD25 expression level of CARhi cells increased steadily throughout subsequent days, confirming CD19+ K562 as an effective trigger for the functional CARhi phenotype (Fig. 7a—c).
To more precisely evaluate the impact of target-cell dos-age on CAR–T-cell bifurcation, we co-incubated CD8+ CAR-T cells with CD19+K562 targets at 1:2, 2:1, 5:1, and 10:1 E:T ratios. Results corroborate the observation that sustained production of CARhicells requires high target-cell inputs that enable persistent antigen presentation (Fig. 7d). CAR-T cells treated with the largest number of antigen-presenting cells ultimately resulted in the highest median CD25 expression level among CARhi cells, but only after a steady rise over time as previously observed (Fig. 7e). These observations hold true regardless of whether the target cells were irradiated prior to co-incubation with CAR-T cells (Additional file 9: Figure S9), confirming the applicability of this evaluation method to CAR-T cell expansion protocols employed in clinical settings.
CARhicells are PD-1+but resist PD-L1-induced dysfunction The observation that sustained antigen stimulation is re-quired for the maintenance of the CARhi phenotype (Figs. 5b and 7b, d) raises the question of whether CARhi cells are at risk of exhaustion, leading to lower the-rapeutic efficacy despite their functional capabilities in vitro. Indeed, surface antibody staining revealed that CARhicells upregulate PD-1, a marker whose sustained expression is generally associated with T-cell dysfunction [24] (Fig. 8). Furthermore, CARhicells generated through stimulation by the most resilient antigen-presenting target cells (CD19+ K562) and the highest antigen concentra-tion (1:2 E:T ratio) also express the highest levels of PD-1 (Fig. 8). Although it is unsurprising that antigen-stimulated cells upregulate PD-1, our target-cell lysis, T-cell proliferation, and cytokine production assay results
did not reveal any sign of dysfunction among the PD-1+ CARhicells (Fig. 3), contrary to previous reports on PD-1+ tumor-targeting T cells [25–28]. One possible expla-nation is that the target cell line used in this study (K562) did not express high levels of PD-L1 (Additional file 10: Figure S10A). To investigate this possibility, the CD19+ K562 target line was engineered to stably over-express PD-L1 (Additional file 10: Figure S10) and used in weeklong co-incubation assays with both CD4+ and CD8+CD19 CAR-T cells.
CD8+ CAR-T cells monitored over seven days of co-incubation in the absence of exogenous cytokines showed no susceptibility to high PD-L1 expression on target cells, demonstrating little to no changes in % CARhi, % Annexin V+, CD25 and Tim-3 expression, T-cell proliferation, and target-cell lysis efficiency (Fig. 9). A small but statistically significant reduction in PD-1 expression was observed in CD8+CAR-T cells upon co-incubation with PD-L1+target cells (Fig. 9e). CARhi expression was consistently corre-lated with increased CD25, PD-1, and Tim-3 expression (Additional file 11: Figure S11), but high levels of PD-L1 on target cells did not result in reduced proliferative or target-cell lysis response by CD8+ CAR-T cells over the 7-day observation period (Fig. 9f, g). It should be noted that since CD8+ CAR-T cells are capable of eliminating
0 10 20 30 40 50 60
12 24 48 120
Hours
Raji
0 20 40 60 80
12 24 48 120
Hours
a
b
% P
D
-1
+A
m
ong C
A
R
hi
C
e
lls
% P
D
-1
+A
m
ong C
A
R
hi
C
e
lls
1:2
2:1
5:1
10:1 CD19+K562
TM-LCL
CD19+H9
Fig. 8PD-1 is upregulated in CARhicells with intensities dependent
upon stimulation conditions. CD8+CAR-T cells were co-incubated
withavarious target cell lines orbCD19+K562 target cells at
various E:T ratios. % PD-1+among CARhicells was determined by
[image:9.595.307.538.87.354.2]CD19+ K562 target cells, additional target cells were added to the co-incubation culture at 48 and 96 h to en-sure sustained expoen-sure of CAR-T cells to PD-L1 presen-tation by target cells. This continuous PD-L1 presenpresen-tation did not result in noticeable impact on CD8+ CAR-T cell function. However, the repeated antigen challenge did re-sult in a decline in CARhicells relative to CARlocells at 144 h (Fig. 9a), consistent with our previous observation that overstimulation contributes to the loss of the func-tional CARhipopulation (Fig. 6).
PD-L1 expression protected target cells from CD4+ CAR–T-cell lysis at early time points (Fig. 9g), potentially due to the higher PD-1 expression level in CD4+ cells compared to CD8+ cells (Additional file 12: Figure S12). However, the resistance to CD4+T-cell–mediated lysis ex-hibited by PD-L1+ target cells appeared to be temporary, and PD-L1 expression on target cells did not impact any of the other T-cell parameters quantified (Fig. 9). No tar-get cells beyond the initial input were added to the CD4+ culture since CD4+ CAR-T cells did not eliminate the original target population. Taken together, the results
indicate that CARhicells persistently upregulate PD-1 ex-pression but are not functionally impaired by PD-L1 pres-entation on K562 target cells.
CAR-T cells generated from TCMsubset are primed for the
CARhi/CD25+phenotype
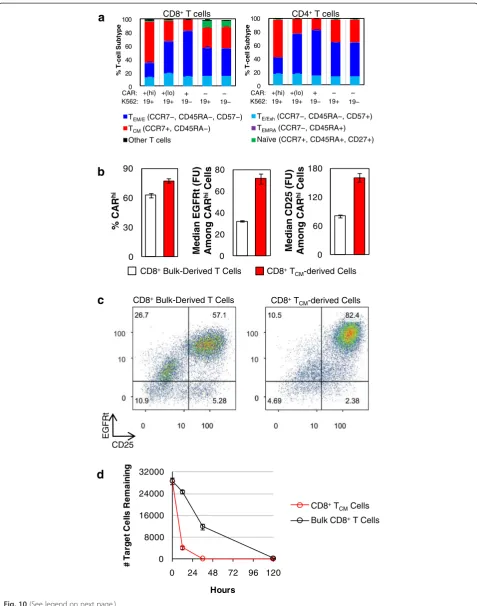
As demonstrated above, antigen stimulation is an integral part of CAR-T cell preparation and its calibration can sig-nificantly influence the efficiency of CARhi generation. Another important parameter in CAR-T cell preparation is the specific subtype of T cells used to make CAR-T cells. Surface antibody staining revealed that the CARhi popula-tion is enriched in central memory T (TCM) cells while the CARlopopulation consists of predominantly effector (TE) and effector memory T (TEM) cells (Fig. 10a). We thus in-vestigated whether enrichment for TCMcells prior to CAR transgene transduction may increase the CAR-T cells’ po-tential to attain the CARhiphenotype.
From the same healthy donor’s blood sample, bulk CD8+ T cells and CD8+ TCM (CCR7+/CD45RA−) cells were isolated separately (Additional file 13: Figure S13A),
0 10,000 20,000 30,000 40,000 50,000 60,000
0 48 96 144
Ta rg e t C e ll # Hours 0 20 40 60 80 100
0 48 96 144
Hours 0 20 40 60 80
0 48 96 144
Hours 0 10 20 30 40 50 60
0 48 96 144
Hours 0 10 20 30 40 50
0 48 96 144
Hours 0 10 20 30 40 50
0 48 96 144
Hours 0 20 40 60 80
0 48 96 144
Hours 0 20 40 60 80 100
0 48 96 144
Hours 0 10 20 30 40 50 60
0 48 96 144
Hours 0 10 20 30 40 50 60
0 48 96 144
Hours 0 10 20 30 40
0 48 96 144
Hours 0 5 10 15 20 25
0 48 96 144
Hours 0 5 10 15 20
0 48 96 144
Hours 0 10,000 20,000 30,000 40,000 50,000
0 48 96 144
Ta rge t C e ll # Hours
a
b
c
d
e
f
g
% CA R hi % CA R hiCD8+CAR-T Cells CD4+CAR-T Cells
% CD25 + % CD25 + % Ti m -3 + % Ti m -3 + % P D -1 + % P D -1 +
CD19+PD-L1+K562
CD19+K562
% A nnex in V + % A nnex in V + *
CD8+CAR-T Cells CD4+CAR-T Cells
CD8+CAR-T Cells CD4+CAR-T Cells
CD8+CAR-T Cells CD4+CAR-T Cells
CD8+CAR-T Cells CD4+CAR-T Cells
CD8+CAR-T Cells CD4+CAR-T Cells
CD8+CAR-T Cells CD4+CAR-T Cells
* M e di an CFS E (FU) M e di an CFS E (FU)
Fig. 9CAR-T cells are minimally impacted by PD-L1 expression on target cells. CD8+and CD4+CAR-T cells were co-incubated with CD19+or CD19+/
PDL1+K562 target cells without exogenous cytokines and monitored fora% CARhi,b% Annexin V+,c% CD25+,d% Tim-3+,e% PD-1+,fCFSE intensity,
andgtarget cell count. An asterisk indicates significant differences comparing co-incubations with CD19+versus CD19+/PDL1+K562 target cells at that
time-point as determined by two-tailed unpaired Student’sttests with the Bonferroni correction (p= 0.00019 ineandp= 0.00076 ing). Black arrows
[image:10.595.59.539.89.412.2]0 30 60 90
a
c
0 20 40 60 80 100
0 20 40 60 80 100
b
K562:
+(hi) +(lo) + −
19+ 19+ 19− 19+ 19−
−
CD4+T cells
CD8+T cells
TEM/E(CCR7−, CD45RA−, CD57−)
TCM(CCR7+, CD45RA−)
Other T cells
TE/Exh(CCR7−, CD45RA−, CD57+)
TEMRA(CCR7−, CD45RA+)
Naïve (CCR7+, CD45RA+, CD27+)
% T
-c
e
ll S
u
bty
p
e
%
T
-cell
S
u
b
ty
p
e
CAR: K562:
+(hi) +(lo) + −
19+ 19+ 19− 19+ 19−
−
CAR:
CD25
EGFR
t
CD8+Bulk-Derived T Cells CD8+T
CM-derived Cells
0 8000 16000 24000 32000
0 24 48 72 96 120
#
T
a
rg
et
Cel
ls
Remai
n
in
g
Hours
CD8+T CMCells
Bulk CD8+T Cells
d
%
CA
R
hi
0 20 40 60 80
0 60 120 180
Median EGFRt
(FU)
A
m
ong CA
R
hi
Cells
M
e
dian CD25
(FU)
A
m
ong
CA
R
hi
Cells
CD8+Bulk-Derived T Cells CD8+T
[image:11.595.59.537.87.694.2]CM-derived Cells
stimulated with CD3/CD28 beads, lentivirally transduced with CD19 CAR transgene, and sorted for CAR+ expres-sion (Additional file 13: Figure S13B). Without further ex-pansion, sorted CAR+cells were co-incubated with CD19+ K562 target cells for 36 h. CARhi/CARlobifurcation was observed in both T-cell populations, but the TCM-derived population yielded more CARhicells, and its CARhicells had higher CAR and CD25 expression levels (Fig. 10b). Consistent with all previous experiments, which were per-formed using bulk CD8+ T cells, CARlo cells from the bulk CD8+-derived CAR-T sample were CD25−. In con-trast, CARlocells from the TCM-derived sample had par-tially upregulated CD25 (Fig. 10c), indicating that the TCM-derived cells are both primed for the CARhi pheno-type and able to retain activation status even when CAR expression levels are low. This conclusion is further sup-ported by the observation that the TCM-derived cells were much more effective at lysing the target cells (Fig. 10d).
We monitored the TCM status of the two populations throughout the cell preparation process as well as after antigen stimulation. Surface staining of CCR7 and CD45RA revealed that most cells in the TCM-enriched population had lost CCR7 expression by the time of cell sorting for CAR expression (Additional file 14: Figure S14A), a pro-gression that is consistent with previous reports ofex vivo TCMcell expansion [15, 16]. However, antigen stimulation caused a re-enrichment of the CCR7+/CD45RA− pheno-type, particularly among CARhi cells (Additional file 14: Figure S14B). In contrast, the bulk CD8+T cell population enriched for CCR7 expression through the course of CD3/CD28 bead stimulation, and further increased CCR7 expression upon antigen stimulation (Additional file 14: Figure S14CD). Taken together, these results indicate the use of TCMcells as the starting population is conducive to the production of functionally superior CAR-T cells, even though the dominant phenotype remains fluid throughout the course of T-cell expansion and antigen stimulation.
Discussion
Recent successes in CD19 CAR–T-cell trials have demon-strated the remarkable therapeutic potential of CD19 CAR-T cells and fueled intense interest in the development of CAR–T-cell therapies against additional tumor targets. As CAR–T-cell technology moves beyond experimental status, it is critical that effective cell-manufacturing
protocols and characterization methods are developed to ensure robust and reproducible generation of CAR-T cells. The various clinical trials completed thus far have employed different T-cell manufacturing protocols unique to each research group, and the relative merits of each have been judged based on overall clinical outcome rather than a detailed examination of differences in T-cell characteris-tics. It is also difficult to elucidate whether any particular step in the preparation process may have affected the phenotype and functionality of the resulting CAR-T cells. As a result, efforts to improve cell preparation protocols remain empirically driven, with few guiding cues on which parameters to modify.
Here, we presented a systematic study on the pheno-typic and functional changes of CAR-T cells after T-cell activation. We demonstrated that activated T cells show a clear pattern of population bifurcation into CARhi/CD25+ vs. CARlo/CD25− groups. This bifurcation appears to be general to T cells activated in vitro, as it is observed in both CD4+and CD8+T cells, in T cells stimulated through either TCRs or CARs targeting different antigens, and in T cells expressing CARs that contain either CD28 or 4-1BB co-stimulatory signals. The transient increase of CAR expression upon antigen stimulation has been ob-served in previous studies [29, 30], but to our knowledge, no detailed characterization of the difference between CARhiand CARlocells has been performed. In this study, we discovered that CARhicells consistently upregulate ex-pression of the activation marker CD25, and target-cell lysis, cytokine production, and T-cell proliferation assays demonstrate that CARhi/CD25+ cells are functionally su-perior to their CARlo/CD25−counterparts. In fact, CARlo/ CD25− cells show multiple signs of anergy and are un-able to execute anti-tumor functions. This observation is of practical importance because the CARlo/CD25− popu-lation is CAR+with similar CAR genomic copy numbers as CARhicells; thus, they would have satisfied the release criteria typically applied in CAR–T-cell trials [4, 31] des-pite their lack of effector functions. The ability to distin-guish and characterize this population was contingent upon the detailedin vitroexamination of T-cell phenotype changes post stimulation.
Our results show that the CARhi/CD25+ phenotype is a transient response to antigen stimulation rather than a genetically hard-wired population destined for superior
[image:12.595.62.541.90.103.2](See figure on previous page.)
Fig. 10TCM-derived CAR-T cells produce more CAR
hi
T cells.aBulk T-cell–derived CD4+and CD8+CAR-T cells were co-incubated with CD19+
K562 target cells without exogenous cytokines, and T-cell subtype distribution was quantified after 24 h. TCM: central memory T cells; TEM: effector
memory T cells; TEMRA: effector memory-CD45RA
+
T cells; TE: effector T cells; TExh: exhausted T cells.bBulk- and TCM-derived CD8
+
CAR-T cells
were co-incubated with CD19+K562 target cells, and the % CARhiand EGFRt and CD25 expression levels among CARhicells were quantified.
cBoth the bulk- and TCM-derived populations separated into CAR
hi
/CD25+and CARlo/CD25−, with the TCM-derived sample showing higher CD25
expression overall. In both samples, a subpopulation of contaminating CAR−cells was also CD25+, possibly due to paracrine stimulation from CAR+
function. Past studies have demonstrated that T-cell ac-tivation can temporarily enhance transgene expression from constitutive promoters, but have not revealed the underlying mechanisms [32, 33]. A scan of the EF1α promoter used in the current study and in multiple clin-ical trials [31, 34, 35] reveals binding sequences for TFII-I and Sp1, both widely employed transcription fac-tors. In particular, TFII-I has been shown to be rapidly phosphorylated upon CD3 crosslinking and upregulated in activated CD4+ T cells [36, 37]. It is possible that T-cell signaling increases the level of these transcription factors and results in the upregulation of CAR expres-sion from the EF1αpromoter. Further investigations are necessary to conclusively elucidate the mechanism of transient CAR upregulation upon antigen stimulation.
Although CARhi/CD25+ cells eventually return to a CARlo/CD25− phenotype after antigen removal, they mount a robust cytolytic and cytokine-production re-sponse when re-challenged with antigen-expressing tar-gets. This is in stark contrast to CARlo/CD25− cells, which remain non-functional upon re-exposure to anti-gen. Therefore, the ability to bias CAR-T cells toward the CARhi/CD25+phenotype during the cell-preparation stage has the potential to increase the therapeutic cap-ability of T cells against targeted tumor cells. We dem-onstrated that, for a second-generation CAR containing CD28 co-stimulatory domain, the application of extra co-stimulation via agonistic CD28 antibody does not alter the relative distribution of the CARhi vs. CARlo subpopulations, but sustained antigen stimulation shows strong correlations with CARhi cell generation. Interes-tingly, the absolute density of antigen on target cells did not correlate with the intensity of T-cell response or the effectiveness of CARhi cell generation. Among the antigen-presenting cells tested, CD19+K562 and TM-LCL appear to present levels of antigen stimulation that are conducive to robust CARhi/CD25+ cell production, con-sistent with TM-LCL’s successful use in clinical protocols [23, 38]. It remains possible that characteristics in addition to persistence, such as co-stimulatory signals present on the target cell surface, contribute to the effectiveness of CD19+ K562 and TM-LCL in supporting the generation of CARhicells. Given the apparent sensitivity of CARhicell production to the type and duration of antigen presenta-tion, and the multiple degrees of variability that exist among potential feeder cell lines used inex vivoT-cell ex-pansion, the detailed in vitro characterization approach described in this study may be used to systematically fine-tune the antigen-presenting cell type and E:T ratio required for the efficient production of functionally superior CAR-T cells.
In addition to the type and degree of antigen stimulation used to expand CAR-T cells, the specific T-cell subtype used to generate CAR-T cells also greatly influences the ef-ficiency of CARhicell generation. Our study demonstrated
that CARhicells are enriched in the TCM phenotype, and TCM-derived CAR-T cells are functionally superior to those made from bulk CD8+T cells. These observations are con-sistent with the previously reported observation that TCM cells are superior to TEMcells in establishing long-term per-sistence in primates [15]. In this and most other CAR– T-cell characterization studies, in vivo results are viewed as the most relevant and credible proof of CAR function. Al-though the value of in vivo data is clear, many important features of CAR-T cell biology—particularly dynamic changes over time in phenotype and function—are impos-sible to obtain at high enough resolution in vivo. Features such as CARlocells cannot be detected in animal models or patients because they are quickly depleted in vivo, but the knowledge of their existence and detailed in vitro charac-terizations of such populations provide valuable informa-tion on how to improve CAR-T cell producinforma-tion so as to maximize the number of cells that will persist and execute antitumor functions upon adoptive transfer.
mouse tumors [46], suggesting the PD-1 pathway does play a role in maintaining the dysfunction of exhausted CAR-T cells. Since PD-1 blockade can indirectly impact CAR-T cell function (e.g., by reducing the prevalence of myeloid derived suppressor cells in the tumor micro-environment [47]), co-administration of CAR-T cell therapy with CTLA-4 or PD-1 blockade remains an intriguing therapeutic option. Nevertheless, our results suggest that PD-1 upregulation—even when sustained over days in the presence of PD-L1–expressing target cells—does not automatically relegate CAR-T cells to anergy or exhaustion.
Conclusions
In this study, we have identified and characterized a pat-tern of population bifurcation that results in two distinct T-cell groups with dramatic differences in proliferative and anti-tumor capacities post antigen stimulation. The com-bination of CAR and CD25 expression levels reliably pre-dicts the functionality of a given T-cell population, thus providing a convenient and robust set of phenotypic markers that can aid future efforts to optimize T-cell manufacturing protocols. Characterization results in our study indicate that starting with an enriched TCM popula-tion and carefully tuning the persistence of antigen stimu-lation during the manufacturing stage may direct the T-cell population toward the functionally superior phenotype, and minimize a source of variability in T-cell quality that is largely undetectable through standard product-release testing and in vivo models. As adoptive T-cell therapy makes strides in clinical outcomes, it is increasingly im-portant that robust and reproducible T-cell manufacturing protocols be optimized in a systematic manner. Additional in-depth characterization studies on the phenotypic changes experienced by T cells throughout the manufacturing and post-infusion period will yield valuable information and guide the continuing effort to improve adoptive T-cell therapy.
Additional files
Additional file 1: Figure S1.EGFRt expression directly correlates with
CAR expression. CD8+T cells were transduced with acd19 car-t2a-egfrt
construct containing the CH2 and CH3 domains in the IgG4 spacer to allow for anti-Fc antibody binding. (A) Unsorted transduced cells, (B) sorted, resting CAR-T cells, (C) CAR-T cells co-incubated with parental
K562 cells, and (D) CAR-T cells co-incubated with CD19+K562 targets
cells were co-stained with Erbitux and anti-Fc antibodies that bind to EGFRt and the CAR extracellular spacer, respectively.
Additional file 2: Figure S2.CD4+CAR-T cells polarize into CARhiand
CARlopopulations. CD4+T cells bifurcate into CARhi/CD25+and CARlo/CD25−
populations upon co-incubation with on-target K562 cells for 24 h.
Additional file 3: Figure S3.Antigen-stimulated CD4+as well as mixed
CD4+and CD8+CAR-T cells demonstrate an initial population crash
followed by selective expansion of CARhicells. (A) CD4+or (B) mixed
CD4+and CD8+CAR-T cells were co-incubated with parental and CD19+K562
targets without exogenous cytokines and monitored for total T-cell count (left
axis) and CARhior CARloas a proportion of total CAR-T cells (right axis).
Average values of triplicates are shown with error bars indicating ± 1 s.d.
Additional file 4: Figure S4.CD4+CARhiand CARloT cells exhibit
distinct functional capabilities. Sorted CD4+CARhiand CARlocells were
co-incubated with CD19+K562 targets without exogenous cytokines and
monitored for (A) viable target-cell count, (B) viable T-cell count, and (C)
cytokine production after 24 h of co-incubation. Sorted CARlovalues are
from single samples due to the rarity of viable cells recovered for this population from cell sorting. For all other samples, average values of triplicates are shown with error bars indicating ± 1 s.d.
Additional file 5: Figure S5.Isolation of CAR-T cell populations with
different CAR expression levels. Transduced, non–antigen-stimulated
CD8+T cells were sorted by FACS into three populations with different
EGFRt expression levels (Low, Mid, and High). The y-axis is an irrelevant channel and cells were not stained with DAPI.
Additional file 6: Figure S6.Additional CD28 co-stimulation does not
impact the CARhiresponse. CD8+CAR-T cells co-incubated with CD19+
K562 target cells at 2:1 E:T ratio with or without CD28 agonist were monitored
for proportion and total number of CARhicells. Average values of triplicates
are shown with error bars indicating ± 1 s.d. The difference in the number of
CARhicells at 120 h was determined to be not significant (n.s.) by the
two-tailed unpaired Student’sttest with the Bonferroni correction (p= 0.0376,
which is greater than the 0.0125 significance level after the Bonferroni correction for multiple comparisons).
Additional file 7: Figure S7.CAR and CD25 upregulation are directly
correlated in antigen-stimulated T cells. CAR-T cells bifurcate into CARhi/
CD25+and CARlo/CD25−subpopulations upon co-incubation with CD19+
K562, TM-LCL, CD19+H9, and Raji target cells for 24 h. JeKo-1 cells were
rapidly eliminated and did not elicit a CARhiresponse.
Additional file 8: Figure S8.CD19 expression levels of various target
cell lines. CD19+H9, CD19+K562, Raji, JeKo-1, TM-LCL, and parental K562
cell lines were stained with an anti-CD19 antibody or an isotype control. Numbers above each plot indicate the fold difference in median fluorescence intensity between CD19 and isotype control staining.
Additional file 9: Figure S9.Stimulating CAR-T cells with varying
amounts of irradiated CD19+K562s impacts the dynamics of the CARhi
response. (A) Number of CARhiand (B) median CD25 expression among
CARhicells in a co-incubation of CD8+CAR-T cells with irradiated CD19+
K562 cells at various E:T ratios. Average values of triplicates are shown with error bars indicating ± 1 s.d.
Additional file 10: Figure S10.PD-L1 can be overexpressed on
otherwise PD-L1−K562 target cells. (A) Various K562 target cell lines were
stained with PD-L1 antibody. (B) K562 lines were also cross-stained for both PD-L1 and CD19 to verify antigen expression.
Additional file 11: Figure S11.CARhicells upregulate CD25, Tim-3, and
PD-1 regardless of PD-L1 expression on target cells. CD8+CAR-T cells were
co-incubated with CD19+or CD19+PD-L1+target cells without exogenous
cytokines and surface-stained with EGFRt, CD25, Tim-3, and PD-1 antibodies.
Additional file 12: Figure S12.CD4+CARhiT cells express higher levels
of PD-1 than CD8+CARhiT cells. CD4+and CD8+CAR-T cells were
co-incubated with CD19+target cells without exogenous cytokines
and monitored by surface antibody staining for (A) % PD-1+among
CARhicells and (B) median PD-1 fluorescence among PD-1+cells.
Average values of triplicates are shown with error bars indicating ± 1 s.d.
Additional file 13: Figure S13.Isolation of TCM-derived CAR+cells. (A)
The TCMsubset (CD45RA−, CCR7+) was enriched from bulk CD8+T cells.
(B) Both TCMand bulk CD8+cells were transduced with CAR and sorted
for the EGFRt+fraction. Both positive (solid gray) and negative (dotted
open) fractions were collected by magnetic bead sorting. Numbers
shown indicate the frequency of EGFRt+cells within the positive fraction.
Additional file 14: Figure S14.Phenotypic shifts in the TCM- and
bulk-CD8–derived cells. (A) CD45RA and CCR7 surface expression was
monitored for TCM-derived cells prior to sorting for EGFRt+cells, 4 days
after sorting (immediately before co-incubation with target cells), and
after 36 h of co-incubation with CD19+target cells. (B) EGFRt and CCR7
surface expression after 36 h of co-incubation with CD19+target cells.