promoting access to White Rose research papers
White Rose Research Online [email protected]
Universities of Leeds, Sheffield and York
http://eprints.whiterose.ac.uk/
This is an author produced version of a paper published in International Journal of Operations & Production Management.
White Rose Research Online URL for this paper:
Published paper
Baldwin, J.S., Allen, P.M., Ridgway, K. (2010) An evolutionary complex systems decision-support tool for the management of operations, International Journal of Operations & Production Management, 30 (7-8), pp. 700-720
An evolutionary complex systems decision-support tool for the management of operations Baldwin, J. S., Allen, P. M. & Ridgway, K.
Abstract
Purpose – This research aimed to add both to the development of complex systems thinking in the subject area of
Operations and Production Management and to the limited number of applications of computational models and simulations from the science of complex systems. The latter potentially offer helpful decision-support tools for operations and production managers.
Design/methodology/approach – A mechanical engineering firm was used as a case study where a combined
qualitative and quantitative methodological approach was employed to extract the required data from four senior managers. Company performance measures as well as firm technologies, practices and policies, and their relation and interaction with one another, were elicited. The data were subjected to an evolutionary complex systems model resulting in a series of simulations.
Findings – The findings highlighted the effects of the diversity in management decision-making on the firm’s
evolutionary trajectory. The CEO appeared to have the most balanced view of the firm, closely followed by the Marketing and Research and Development Managers. The Manufacturing Manager’s responses led to the most extreme evolutionary trajectory where the integrity of the entire firm came into question particularly when considering how employees were utilised.
Research implications – By drawing directly from the opinions and views of managers, rather than from logical
‘if-then’ rules and averaged mathematical representations of agents that characterise agent-based and other self-organisational models, this work builds on previous applications by capturing a micro-level description of diversity that has been problematical both in theory and application.
Practical implications – This approach can be used as a decision-support tool for operations and other managers
providing a forum with which to explore a) the strengths, weaknesses and consequences of different decision-making capacities within the firm; b) the introduction of new manufacturing technologies, practices and policies; and, c) the different evolutionary trajectories that a firm can take.
Originality/value – With the inclusion of ‘micro-diversity’, evolutionary complex systems modelling moves beyond
the self-organisational models that populate the literature but has not as yet produced a great many practical simulation results. This work is a step in that direction.
Keywords – Evolutionary complex systems, modelling and simulation, support tools, management
decision-making, organisational evolution
Paper type – Case study
Acknowledgement – This article originally featured in:
Baldwin, J. S., Allen, P. M. & Ridgway, K. (2010). An evolutionary complex system’s decision-support tool for the management of operations. International Journal of Operations and Production Management, Vol. 30, No. 7, pp.700-720.
Introduction
Supply networks, organisations, individuals and even their decision-making processes are increasingly being viewed and treated as complex systems (Choi et al., 2001; Frizelle and Woodcock, 1995; Macbeth, 2002; MacIntosh and MacLean, 2001; McCarthy, 2003). There has also been a growing trend recently, and particularly during the last decade or so, in the modelling and simulation of such systems (Chaharbaghi, 1991; Islo, 2001; Li et al., 2003; Lim and Zhang, 2003; Nilsson and Darley, 2006; Zhou et al., 2003). However, such work has been somewhat neglected in the subject area of Operations and Production Management. This research builds on the few studies that have attempted to address this, and endeavours to form a basis with which to develop a decision-support tool offering managers practical assistance during, for example, a change management programme. The paper begins by highlighting, in the context of recent advances in complex systems thinking, modelling and simulation, the need for decision-support tools in the management of operations whilst drawing attention to a particularly problematic case, i.e., the sometimes conflicting interests, motivation and concerns of different functional managers and the potential advantages and disadvantages of these diverse priorities in terms of overall firm performance. After introducing a hierarchy of systems approaches based on modelling assumptions, an evolutionary complex systems (ECS) simulation model is then proposed. Unlike others, this approach has the capability to explore the consequences of the diversity in management decision-making processes of managers from different functional areas and the effects on the potential evolutionary trajectories that a firm can take. Following an account and justification of both the research methods that were employed and the simulation model, outcomes of management decision-making are then presented along with a discussion of the significance both in their own right and in the context of the Operations and Production Management literature. The paper concludes with some closing remarks on the research and practical implications of this work, and further research recommendations and directions.
(Malhotra and Sharma, 2002). This has prompted calls for decision-support tools that increase understanding of the underlying processes in the adoption and implementation of new technologies (Baldwin et al., 2005; Das and Narasimhan, 2001; Klassen and Whybark, 1999), practices (Cua et al., 2001; McKone et al., 2001; Zhu and Cote, 2004; Zhu et al., 2008) and policies (McCarthy, 2004; O'Leary-Kelly and Flores, 2002) within the context of the firm’s strategic emphasis both corporate and functional (Brown et al., 2007; Leachman et al., 2005). The role and importance of management decision-making in organisational evolution can not be underestimated. Raymond et al (1996), for example, whilst investigating technology adoption in SMEs, identified the decision-making process as one of three main profiles of strategic advantage along with technological expertise and organisational capabilities.
Whilst acknowledging that management decision-making is central to any organisational change/transformation, there is also rising awareness of the impact of diversity in the decision-making process (Allen et al., 2006; Poundarikapuram and Veeramani, 2004). Diversity, in the context of this research, refers not only to the different decisions that can and are made but to the range of approaches taken when decision-making due to individuals’ different perspectives, beliefs, attitudes and information-processing capacities/abilities (Allen et al., 2006). Simon’s (1955; 1983) notion of bounded rationality from the cognitive sciences and more recently evolutionary economics, which refers to the incomplete knowledge that people have and use (and misuse) when decision-making, is also relevant here (Nilsson and Darley, 2006). Getting a balance is key, as diversity is seen as being hugely advantageous in terms of innovative capabilities if set within a conducive organisational culture (Jarratt, 1999). It also has the potential to radically affect the evolution of a company particularly in times of change, for example, when introducing a new technology, practice or policy (Baldwin et al., 2005; Jarratt, 1999). However, capturing this level of diversity has been problematical not only in terms of theory (but see, for example, Holland, 1995; Jantsch, 1980; Prigogine and Stengers, 1987) but also, and perhaps more evidently, in application.
ECS modelling departs from the other computational modelling techniques, such as system dynamics, agent-based and other self-organisational models, as it incorporates the role and influence of micro-diversity along with experiential learning which are arguably the driving forces and impetus behind evolutionary, rather than adaptive, change (Allen et al., 2006). ECS theory is a European branch of complexity thinking stemming from Prigogine’s (1973) Nobel Prize winning work. The approach has now been successfully applied to ecosystems, urban systems, economic markets and, more recently, in evolving an entire industry (Allen et al., 2005; 2006; 2007; Baldwin et al., 2005).
To illustrate the differences between the different systems models a consideration of underlying assumptions is needed. Modelling assumptions create a hierarchy of models from known certainties and perfect prediction through to explorations of the unknown and the least-likely of potentialities (Allen et al., 2007). All systems models have at least two assumptions: 1) that a boundary exists between the system, in this case the firm, and its environment, and 2) that the system’s components, e.g., the firm’s technologies, practices and policies, can be classified to produce a taxonomy.
complete understanding and knowledge, and in turn perfect predictability. But what do average components and interactions actually mean when applied to a firm? Take, for example, the implementation of line-balancing or empowering employees. Not every firm has the same approach. Indeed, if every firm’s approach was scrutinised, there would be a high degree of idiosyncrasy. Furthermore, and in terms of interaction with other components (e.g. quality or inspection policies), not all implementations of line-balancing and/or empowering employees have the same outcomes. That is, what would work in one organisation, or even one point in time, may not necessarily work in another.
By introducing the non-average, the nature of the model begins to change from certainty and prediction to exploration and potentialities. Through the inclusion of all the potential types of interactions that can occur, models can begin to explore and reach many possible future scenarios through self-organisational processes (e.g. the different outcomes of line-balancing or employee empowerment implementation in the example above). The few complex system computational models found in the literature are of this type (see, for example, Chaharbaghi, 1991; Islo, 2001; Kaihara, 2003; Li et al., 2003; Lim and Zhang, 2003; Meade et al., 2006; Nilsson and Darley, 2006; Zhou et al., 2003). Although highly useful both practically and intellectually, there is, nonetheless, a limitation to these models particularly in their application to social systems. To represent diversity, these models have a stochastic mechanism that generates ‘noise’, which is perhaps more realistic than assuming only average conditions and interactions. However, whilst these models introduce non-average interactions, the components or, in another word, agents are still of an average type that are subject to a pre-defined, ‘if-then’ rule-based system. The noisy interaction of ‘average’ elements does not have the same outcome, or spread of outcomes as the interaction of diverse, heterogeneous individual elements. In the former case we may see different configurations or regimes of operation appearing, but in the latter case, new combinations of different elements leading to new, emergent capabilities and dimensions of performance can occur. This is the essential characteristic of evolutionary change – a process of qualitative, not just quantitative, change.
their performance and success relative to others within the system; evolution proceeds through fully de-centralised, rather than centralised, decision-making. In addition, evolution, being an open process, ensues through a combination of not only the determinism of the individuals’ purposefulness but also by chance events. The intake of new kinds of individuals, or the changing views and thoughts that they may have is not a rational, calculated process because the implications of any particular heterogeneity is not known until after an evolutionary step has occurred in system behaviour. In this way, the evolution that does occur is not really predictable but results from the interplay of individual heterogeneity and the differential performances of the resulting organisations. This is largely characterised by an inevitable lack of pre-existing knowledge of the link between individual and system behaviour and can be thought of as resulting from a degree of ‘error-making’ (Allen et al., 2006). The role of chance is fundamental, however, creating a rich medium for experiential learning through continuing experiments in behaviour space (Allen et al., 2007). As the approach incorporates diversity at all levels of description, it is appropriate when trying to attain a better understanding of the role of diversity in decision-making and the impacts on a firm’s evolutionary trajectories.
Research Methods and Preliminary Results
The development of the ECS model, which simulated a firm’s evolutionary trajectory reflecting management assumptions, was achieved by: a) building a profile of a firm through a case-study approach involving observation and simple semi-structured interviews; and then b) gauging, via a quantitative questionnaire, the managers’ perception of how the firm’s technologies, practices and policies (also referred to as ‘character-states’) interacted with one another in the context of their overarching operations strategy. In so doing, it was possible to compare and contrast different decision-making capacities, which enabled an exploration of decision-making consequences resulting from potentially diverse information sources and assumptions.
Interviews were based on a simple, semi-structured, qualitative questionnaire, which was sent to each participant prior to the interview, and was accompanied by pre-prepared paper-based check-list of common operations practices and policies, which was not made known to the participants to avoid interviewer bias. To maximise internal validity (Saunders et al., 2007), the interview schedule and practice check-list was first piloted on two industrialists and an academic familiar with Operations and Production Management after which small adjustments were made. Interviewer and interviewee biases were minimised through the selection of neutral settings for interviews and through a standardised presentation of non-leading questions (Saunders et al., 2007). Interviews were recorded but due to the basic nature of this part of data collection and analysis, were not transcribed. They were instead directly interpreted and coded using the pre-prepared practice list as a guide. Essentially, if the practices from the list were mentioned then it was marked for inclusion for the next quantitative questionnaire phase plus any additional practices and policies identified. This was conducted during the interview. There was then a post-interview analysis of the recordings to verify the list of practices. No further practices were added at this stage.
The interview firstly encouraged a discussion of the firm’s operations strategy, by asking participants what they deemed important for the survival of the company in terms of performance, using as the basis for discussion both the Four Competitive Priorities (cost, quality, time and flexibility), from Hayes and Wheelwrights (1984) and the Five Performance Objectives (quality, speed, dependability, flexibility and cost), from Slack et al (2007). These performance criteria were familiar with the interviewees and are consistent with both the literature and previous empirical research on manufacturing performance (see, for example, Brown et al., 2007; Cua et al., 2001; Das and Narasimhan, 2001; Fynes et al., 2005). From the interviews, four main performance criteria, i.e., product quality, cost efficiency, customer relationship, and schedule adherence, were found to be relevant and there was also an indication that they had differing degrees of importance which is consistent with the literature (Hayes and Wheelwright, 1984; Skinner, 1969). Three out of the four performance criteria, i.e., product quality, cost efficiency and schedule adherence, directly mapped on to Hayes & Wheelwrights’ (1984) Competitive Priorities and Slack et al’s (2007) Performance Objectives. Customer relationship although alluding to aspects of flexibility and dependability, had a much more informal element relating to social relationships of trust building, which is more relevant to aligning organisational cultures and corporate strategies.
check-list consisted of 47 practices (see appendix) which were elicited from the literature particularly from Womack et al’s (1990) and McCarthy et al’s (1997; 2000) work on the evolution and development of the automotive industry supported by the generic manufacturing practices alluded to in Kinni (1996), Schonberger (2008) and Slack et al (Slack et al., 2007). Although, this level of data collection is fairly basic and could have been achieved using a questionnaire survey based on generic operations technologies, practices and policies, a better understanding of the idiosyncrasies of the firm was attained through interviews. Furthermore, different descriptors, which were more relevant to that particular organisation, were identified, along with additional technologies, practices and policies (i.e., not on the pre-prepared check list). The interviews also ensured both participation in the next quantitative questionnaire phase and more importantly it gave participants a better understanding of their requirements in this phase. Twenty-five character-states (listed in table 1) were identified as the most important technologies, practices and policies for continued successful firm performance providing the basis for the quantitative questionnaire.
The quantitative questionnaire was designed to gather the managers’ views of how the 25 character-states interacted with one-another in relation to the overall performance of the firm. To achieve this, the questionnaire had three parts. The first asked participants to rank the overall importance of the four performance criteria to the company, for example, 1st: customer relationship; 2nd: schedule
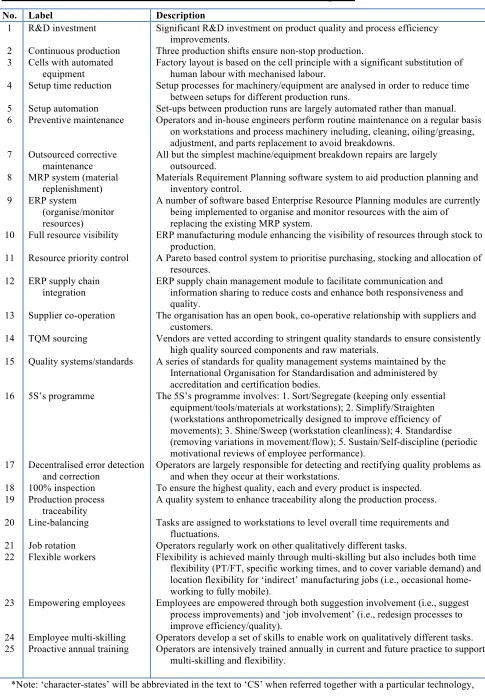
Table 1 - Firm character-states (CSs): Number, label and description
No. Label Description
1 2 3 4 5 6 7 8 9 10 11 12 13 14 15 16 17 18 19 20 21 22 23 24 25 R&D investment Continuous production Cells with automated
equipment Setup time reduction
Setup automation Preventive maintenance
Outsourced corrective maintenance MRP system (material
replenishment) ERP system
(organise/monitor resources)
Full resource visibility
Resource priority control
ERP supply chain integration
Supplier co-operation
TQM sourcing
Quality systems/standards
5S’s programme
Decentralised error detection and correction 100% inspection Production process traceability Line-balancing Job rotation Flexible workers Empowering employees Employee multi-skilling Proactive annual training
Significant R&D investment on product quality and process efficiency improvements.
Three production shifts ensure non-stop production.
Factory layout is based on the cell principle with a significant substitution of human labour with mechanised labour.
Setup processes for machinery/equipment are analysed in order to reduce time between setups for different production runs.
Set-ups between production runs are largely automated rather than manual. Operators and in-house engineers perform routine maintenance on a regular basis
on workstations and process machinery including, cleaning, oiling/greasing, adjustment, and parts replacement to avoid breakdowns.
All but the simplest machine/equipment breakdown repairs are largely outsourced.
Materials Requirement Planning software system to aid production planning and inventory control.
A number of software based Enterprise Resource Planning modules are currently being implemented to organise and monitor resources with the aim of replacing the existing MRP system.
ERP manufacturing module enhancing the visibility of resources through stock to production.
A Pareto based control system to prioritise purchasing, stocking and allocation of resources.
ERP supply chain management module to facilitate communication and information sharing to reduce costs and enhance both responsiveness and quality.
The organisation has an open book, co-operative relationship with suppliers and customers.
Vendors are vetted according to stringent quality standards to ensure consistently high quality sourced components and raw materials.
A series of standards for quality management systems maintained by the International Organisation for Standardisation and administered by accreditation and certification bodies.
The 5S’s programme involves: 1. Sort/Segregate (keeping only essential equipment/tools/materials at workstations); 2. Simplify/Straighten (workstations anthropometrically designed to improve efficiency of movements); 3. Shine/Sweep (workstation cleanliness); 4. Standardise (removing variations in movement/flow); 5. Sustain/Self-discipline (periodic motivational reviews of employee performance).
Operators are largely responsible for detecting and rectifying quality problems as and when they occur at their workstations.
To ensure the highest quality, each and every product is inspected. A quality system to enhance traceability along the production process.
Tasks are assigned to workstations to level overall time requirements and fluctuations.
Operators regularly work on other qualitatively different tasks.
Flexibility is achieved mainly through multi-skilling but also includes both time flexibility (PT/FT, specific working times, and to cover variable demand) and location flexibility for ‘indirect’ manufacturing jobs (i.e., occasional home-working to fully mobile).
Employees are empowered through both suggestion involvement (i.e., suggest process improvements) and ‘job involvement’ (i.e., redesign processes to improve efficiency/quality).
Operators develop a set of skills to enable work on qualitatively different tasks. Operators are intensively trained annually in current and future practice to support
multi-skilling and flexibility.
The final part of the questionnaire asked participants to gauge the interactions between each of the character-states in terms of the overall performance of the firm. The answer options were based on a 7-point Likert scale (-3 to +3) determining the degree of positive/neutral/negative interactivity. That is, for example, participants could indicate say a moderately synergistic interaction between CS1 and CS2 as ‘+2’ and a strongly antagonistic interaction between CS1 and CS3 as ‘-3’ and so on. These scores were weighted in accordance with their impact on the ranked performance criteria. The ECS model drew directly from these weighted scores. Piloting for the questionnaire, involving two academics and two industrialists, was in two stages after which minor/incremental adjustments were made to the questionnaire to ensure construct validity (Saunders et al., 2007).
The Simulation Model
With ECS modelling, structures and the organisation of different practices may be explored. The work presented here traces its origins back to the insights expressed in the works of Prigogine (1973), colleagues (Glansdorff and Prigogine, 1971; Kondepudi and Prigogine, 1998; Nicolis and Prigogine, 1977; 1989; Prigogine and Stengers, 1987), and others (Allen, 1982; 1984; Haken and Mikhailov, 1993; Jantsch, 1980) who have all demonstrated how complex systems evolve through the emergence of fluctuations and instabilities within a system. Prigogine (1973) developed a simple model, known as the ‘Brusselator’ (after the Brussels’ School of Thermodynamics), which described how non-equilibrium systems become unstable and begin oscillating. The conditions to be met are that the system is open, that the gradient (i.e. flow of matter and energy) creates a far-from-equilibrium state, and that there are autocatalytic steps in the reaction chain. Autocatalysis is the process where molecules participate in reactions necessary for molecules of their own kind (Jantsch, 1980) and can create both positive and negative feedback (Atkins, 1984). The scheme is as follows:
A → X B + X → Y + D
2X + Y → 3X
X → E
Building on these principles, Allen (1976) developed a mathematical expression describing the introduction and growth of new ‘behaviours’ into a system, such as new species in a natural ecosystem. The ECS model developed for this study was adapted from this and was designed to simulate the interaction between the firm’s character-states drawing directly from the four decision-makers’ questionnaire data. In terms of manufacturing, the behaviours/species and their interactions represent the manufacturing firm’s technologies, practices and policies and how they work together. Biological evolution, through selection, surrounds the diffusion and proliferation of innovative behaviours determined by their success, or relative performance, in birth and death rates. Birth and death rates represent, for example, the performance in the competition for resources, mating success, avoiding/catching prey, and rearing offspring. In terms of manufacturing, the success of character-states reflects the importance of the character state to the organisation in terms of, for example, product quality, schedule adherence and cost efficiency. Successful bundles of practices and behaviours will experience positive feedback and growth when their particular characteristic performances correspond to that which the selection environment requires.
The model is based on the equations given in Allen et al (2007), developed in Turbo Basic® and run in the Microsoft Dos® operating system. The mathematical model describes the growth in the total health of a manufacturing firm, which is seen as the sum of the activities of its constituent practices. It is the synergy, neutrality or conflict between its practices that affects the size of each one, and therefore the total output or sum of them all. The model uses a pair matrix defined from the questionnaire data from the four senior managers concerning their view of the synergy, neutrality or conflictual nature of the 25 practices, which defines how each of the 25 practices impinges on each other (a 25 by 25 matrix). The degree of synergy is taken into in the internal practices present in the firm. For a firm with a given set of practices the pair matrix of synergy and conflict is used to construct the net synergy encountered by each of the particular practices in the presence of the others. For each practice of the firm, the net effect (synergy or conflict) of the other practices actually present can be calculated which leads to a net synergy:
Where h is an individual character-state; k is the population of character-states; and, P is the overall ‘health’ or ‘survival’ of the system. This gives an indication of the overall survival or health of the system/firm. The limits to ‘health’ however will be set by the size of the practices already present:
Building on these principles, Allen (1976) developed a mathematical expression describing the
introduction and growth of new ‘behaviours’ into a system, such as new species in a natural
ecosystem. The ECS model developed for this study was adapted from this and was designed to
simulate the interaction between the firm’s character-states drawing directly from the four
decision-makers’ questionnaire data. In terms of manufacturing, the behaviours/species and their interactions
represent the manufacturing firm’s technologies, practices and policies and how they work together.
Biological evolution, through selection, surrounds the diffusion and proliferation of innovative
behaviours determined by their success, or relative performance, in birth and death rates. Birth and
death rates represent, for example, the performance in the competition for resources, mating
success, avoiding/catching prey, and rearing offspring. In terms of manufacturing, the success of
character-states reflects the importance of the character state to the organisation in terms of, for
example, product quality, schedule adherence and cost efficiency. Successful bundles of practices and behaviours will experience positive feedback and growth when their particular characteristic
performances correspond to that which the selection environment requires.
The model is based on the equations given in Allen et al (2007), developed in Turbo Basic® and
run in the Microsoft Dos® operating system. The mathematical model describes the growth in the
total health of a manufacturing firm, which is seen as the sum of the activities of its constituent
practices. It is the synergy, neutrality or conflict between its practices that affects the size of each
one, and therefore the total output or sum of them all. The model uses a pair matrix defined from
the questionnaire data from the four senior managers concerning their view of the synergy,
neutrality or conflictual nature of the 25 practices, which defines how each of the 25 practices
impinges on each other (a 25 by 25 matrix). The degree of synergy is taken into in the internal
practices present in the firm. For a firm with a given set of practices the pair matrix of synergy and
conflict is used to construct the net synergy encountered by each of the particular practices in the
presence of the others. For each practice of the firm, the net effect (synergy or conflict) of the other
practices actually present can be calculated which leads to a net synergy:
!"#$%&'(() =) *+,-.(/,()0 1(2) (1 +3456((,7) 8
9
Where h is an individual character-state; k is the population of character-states; and, P is the overall
‘health’ or ‘survival’ of the system. This gives an indication of the overall survival or health of the
A dynamic equation is then calculated representing the growth (b)or decline (m) of each practice in the presence of the others (summing from 1 to 25):
After each time step the size of the different practices are updated and the total health of the system/firm is calculated as the sum of the P(h):
For the running of the ECS model, several variables can be manipulated and calibrated, three of which require more explanation. The first is the running time of the simulation. This may be adjusted to permit finding stable solutions which are typically found within 10-50,000 arbitrary time units. The second variable is the number of character-state initiations in the model that allows exploration of particular organisational forms. The third is the performance value of the character-state. Performance may lie between 0-30 arbitrary units. The higher the value, the better the performance and importance within the organisation. The simulations presented here launched the character-states with a starting value of 5 performance-units.
Before the results are presented there are two qualifications that need to be highlighted. The first is that the particular simulations presented here are among many possible trajectories dependent on initial conditions. All simulations of the different managers, however, begin with identical initial conditions. However, selecting particular solutions is somewhat problematical when dealing with evolutionary systems as an infinite number of possible evolutionary trajectories are possible. Nonetheless, the simulations selected for presentation were deemed fairly representative of a series of repeat simulations. The second qualification is that, unlike reality, the simulations depict an evolution of the firm with all character-states starting as equal (with 5 performance-units). Nonetheless, the results from this procedure do highlight differences (and similarities) between the different decision-makers.
Simulation Results and Discussion
To fully appreciate the effects of diverse decision-making capacities, five simulations are presented and discussed. Figure 1 depicts, in simplified form, five separate evolutionary trajectories of the
!"#$%&'()()) =* +(1 +./01,(-)(),2))3
A dynamic equation is then calculated representing the growth (b) or decline (m) of each practice in
the presence of the others (summing from 1 to 25):
4P(h)=(b(h)*P(h)*(1+.01*P(h))*(1+.2*Synergy(h))* 1- MaxHealth(h) -m*P(h)
dt N
After each time step the size of the different practices are updated and the total health of the
system/firm is calculated as the sum of the P(h):
56789:;()) =< =()) >
For the running of the ECS model, several variables can be manipulated and calibrated, three of
which require more explanation. The first is the running time of the simulation. This may be
adjusted to permit finding stable solutions which are typically found within 10-50,000 arbitrary
time units. The second variable is the number of character-state initiations in the model that allows
exploration of particular organisational forms. The third is the performance value of the
character-state. Performance may lie between 0-30 arbitrary units. The higher the value, the better the
performance and importance within the organisation. The simulations presented here launched the
character-states with a starting value of 5 performance-units.
Before the results are presented there are two qualifications that need to be highlighted. The first is
that the particular simulations presented here are among many possible trajectories dependent on
initial conditions. All simulations of the different managers, however, begin with identical initial
conditions. However, selecting particular solutions is somewhat problematical when dealing with
evolutionary systems as an infinite number of possible evolutionary trajectories are possible.
Nonetheless, the simulations selected for presentation were deemed fairly representative of a series
of repeat simulations. The second qualification is that, unlike reality, the simulations depict an
evolution of the firm with all character-states starting as equal (with 5 performance-units).
Nonetheless, the results from this procedure do highlight differences (and similarities) between the
different decision-makers.
Simulation Results and Discussion
To fully appreciate the effects of diverse decision-making capacities, five simulations are presented
and discussed. Figure 1 depicts, in simplified form, five separate evolutionary trajectories of the
firm. The first line, to the front of the graph, represents the results of a simulation in which all the !"#$%&'()()) =* +(1 + ,(-)
./01(),2))3
A dynamic equation is then calculated representing the growth (b)or decline (m) of each practice in
the presence of the others (summing from 1 to 25):
4P(h)=(b(h)*P(h)*(1+.01*P(h))*(1+.2*Synergy(h))* 1- MaxHealth(h) -m*P(h)
dt N
After each time step the size of the different practices are updated and the total health of the
system/firm is calculated as the sum of the P(h):
56789:;()) =< =()) >
For the running of the ECS model, several variables can be manipulated and calibrated, three of
which require more explanation. The first is the running time of the simulation. This may be
adjusted to permit finding stable solutions which are typically found within 10-50,000 arbitrary
time units. The second variable is the number of character-state initiations in the model that allows
exploration of particular organisational forms. The third is the performance value of the character-state. Performance may lie between 0-30 arbitrary units. The higher the value, the better the
performance and importance within the organisation. The simulations presented here launched the character-states with a starting value of 5 performance-units.
Before the results are presented there are two qualifications that need to be highlighted. The first is
that the particular simulations presented here are among many possible trajectories dependent on
initial conditions. All simulations of the different managers, however, begin with identical initial conditions. However, selecting particular solutions is somewhat problematical when dealing with
evolutionary systems as an infinite number of possible evolutionary trajectories are possible.
Nonetheless, the simulations selected for presentation were deemed fairly representative of a series
of repeat simulations. The second qualification is that, unlike reality, the simulations depict an
evolution of the firm with all character-states starting as equal (with 5 performance-units).
Nonetheless, the results from this procedure do highlight differences (and similarities) between the
different decision-makers.
Simulation Results and Discussion
To fully appreciate the effects of diverse decision-making capacities, five simulations are presented
and discussed. Figure 1 depicts, in simplified form, five separate evolutionary trajectories of the firm. The first line, to the front of the graph, represents the results of a simulation in which all the
!"#$%&'()()) =* + ,(-)
(1 +./01(),2))3
A dynamic equation is then calculated representing the growth (b) or decline (m) of each practice in
the presence of the others (summing from 1 to 25):
4P(h)=(b(h)*P(h)*(1+.01*P(h))*(1+.2*Synergy(h))* 1- MaxHealth(h) -m*P(h)
dt N
After each time step the size of the different practices are updated and the total health of the
system/firm is calculated as the sum of the P(h):
56789:;()) =< =()) >
For the running of the ECS model, several variables can be manipulated and calibrated, three of
which require more explanation. The first is the running time of the simulation. This may be
adjusted to permit finding stable solutions which are typically found within 10-50,000 arbitrary
time units. The second variable is the number of character-state initiations in the model that allows
exploration of particular organisational forms. The third is the performance value of the
character-state. Performance may lie between 0-30 arbitrary units. The higher the value, the better the
performance and importance within the organisation. The simulations presented here launched the
character-states with a starting value of 5 performance-units.
Before the results are presented there are two qualifications that need to be highlighted. The first is
that the particular simulations presented here are among many possible trajectories dependent on
initial conditions. All simulations of the different managers, however, begin with identical initial
conditions. However, selecting particular solutions is somewhat problematical when dealing with
evolutionary systems as an infinite number of possible evolutionary trajectories are possible.
Nonetheless, the simulations selected for presentation were deemed fairly representative of a series
of repeat simulations. The second qualification is that, unlike reality, the simulations depict an
evolution of the firm with all character-states starting as equal (with 5 performance-units).
Nonetheless, the results from this procedure do highlight differences (and similarities) between the
different decision-makers.
Simulation Results and Discussion
To fully appreciate the effects of diverse decision-making capacities, five simulations are presented
and discussed. Figure 1 depicts, in simplified form, five separate evolutionary trajectories of the
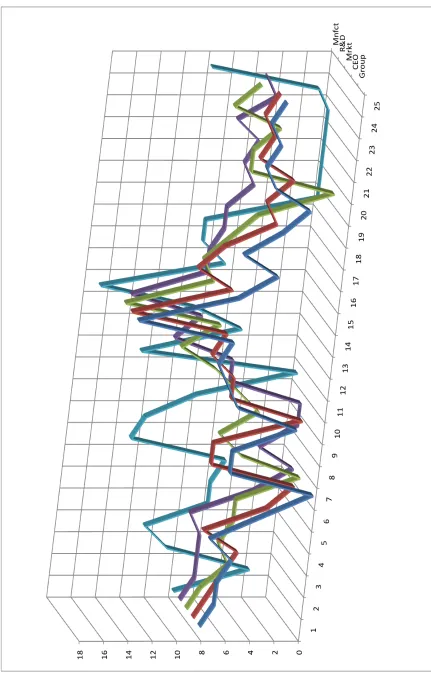
firm. The first line, to the front of the graph, represents the results of a simulation in which all the managers’ scores were averaged out – the group simulation. The second, third, fourth and fifth lines represent the results of simulations based individually on the CEO’s, Marketing, R&D, and Manufacturing Managers’ scores, respectively. Each point of the line represents a character-state’s ‘performance’; the number indicated below each point on the line corresponds to the character-state numbers in the list of practices in table 1. The height of the line in the line graph is an indication of the performance or the value to the firm of that particular character-state relative to the other character-states in terms of the performance criteria (i.e., customer relationship, product quality, schedule adherence and cost efficiency). The presentation of results has been simplified using Microsoft Excel®.
There are several general points to discuss here. The first is that the simulations reveal several potential management concerns, both collectively (in terms of group decision-making) and individually, that can then be flagged up for further discussion and exploration, similar to the ‘what-if’ scenario building of Nilsson and Darley’s (2006) work. Taking the collective concerns as an illustration, when the managers’ opinions are aggregated (the first line, to the front of the graph in figure 1), CS7, outsourced corrective maintenance, fails, indicating a consensus that this practice is problematical. The simulation also flags up concerns over CS6, preventive maintenance, CS20, line-balancing and CS10, full resource visibility, which were low performers relative to other character-states. Overall, the integrity of the organisation was very good, however, signifying that as a decision-making group the managers are more complementary than not.
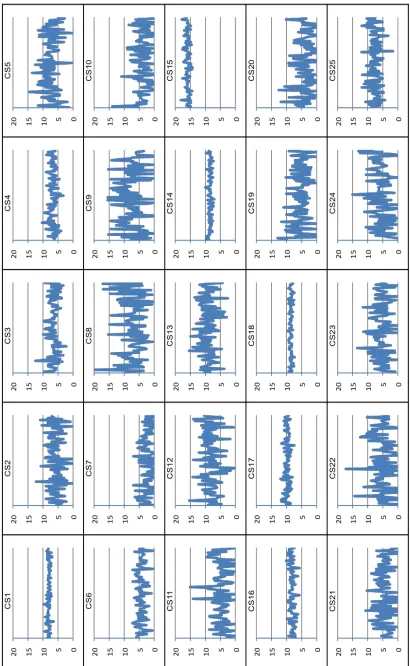
This limitation exists in previous research (see, for example, Baldwin et al., 2005) where opinions of manufacturing managers, operations managers, CEOs and company managers were averaged out. As such, significant information is lost. In Baldwin et al’s (2005) study, there was an indication that the informants had very diverse views of how technologies and practices interacted with one another. Unfortunately, the methodology prevented a thorough analysis of views of the individual respondents. This was due to the large numbers of characteristics; that is, the survey instrument had to be divided into four parts with one informant only giving their opinions on a quarter of the total number of characteristics. To further illustrate this limitation, the means and standard deviations of the character-state performances resulting from the grouped managers’ opinions are presented in table 2.
Table 2 – Means and standard deviations of the character-state performances
CS Mean SD CS Mean SD CS Mean SD
1 8.00 0.60 10 3.25 3.59 18 8.50 0.58
2 5.75 2.50 11 4.75 3.20 19 4.75 3.40
3 6.75 1.71 12 8.50 3.11 20 3.00 3.46
4 6.75 1.50 13 9.00 2.83 21 4.50 3.32
5 7.25 2.63 14 8.50 0.58 22 5.00 3.37
6 4.25 1.50 15 16.00 0.82 23 4.75 3.40
7 1.50 2.38 16 8.25 0.96 24 5.50 3.42
8 7.25 4.35 17 9.75 0.96 25 7.25 1.89
9 6.75 4.99
An important point to make here is that the degree of failure rate in the simulations is not a sufficient indicator of a problem in actual practice, if, for example, it is accompanied with high variability which is an indicator of management disagreement. However, if a high failure rate in combination with low variability is found then the likelihood of a genuine problem in practice is high. This is most evident with CS7, outsourced corrective maintenance, which has the highest failure rate together with only low-to-moderate variability.
Figure 1 portrays the Marketing Manager’s simulation at the final solution (the third line in the graph). This begins to demonstrate the significant role that individual differences or diversity has in the management decision-making process and adds support to the arguments of Allen et al (2006), Poundarikapuram and Veeramani (2004), and O’Leary-Kelly and Flores (2002). In the Marketing Manager’s simulation there are several differences that need to be highlighted. The first is that only seventeen of the twenty-five character-states improved on their starting value. This is in contrast to the first two simulations where there were improvements for twenty of the aggregated scores and nineteen of the CEO’s scores. However, seven of the nine character-states that surpassed 8 performance-units agreed with the CEO. The main difference, particularly in terms of the CEO’s results, was that two character-states, CS7, outsourced corrective maintenance, and CS20, line-balancing, failed altogether. Although the performance of the former character-state reflects the aggregated results and to a degree the CEO’s simulation, the latter is opposed to the opinion of the CEO. The Marketing Manager’s negative impression of line-balancing may be a symptom, for example, of functional barriers (Malhotra and Sharma, 2002; Rhee and Mehra, 2006) and is another area for further management analysis.
The R&D Manager’s simulation at closing is shown in figure 1 (fourth line in the graph). The results largely agreed with the latter two managers but with obvious exceptions. Agreement surrounded CS15, quality systems/standards, CS17, decentralised error detection and correction, CS16, 5S’s programme, CS13, supplier co-operation, and CS1, R&D investment, which all had good performances with end values of over 8 performance-units (that is, eight out of ten character-states in agreement with the CEO). Furthermore, both CS7, outsourced corrective maintenance and CS10, full resource visibility, failed for the R&D Manager – the CEO and Marketing Manager’s simulations also resulted in low scores for the latter with 1 and 4 performance-units, respectively. The point of divergence concerns both CS9, ERP system, which had no place in the final solution, and, CS8, MRP system, which had a very weak performance relative to most other character-states. In this instance, a plausible explanation is the fact that the firm has both ERP and MRP systems running simultaneously, where the former should be in replacement of the latter. However, no other managers’ simulation flagged this.
character-states failed with an additional two barely surviving, finishing with less than 2 performance-units. Of the eight character-states that failed or underperformed, six surrounded policies concerning employees (i.e. employee multi-skilling, line-balancing, job rotation, flexible workers, empowering employees, and continuous production). This pattern indicates that the Manufacturing Manager has issues with the way the workforce is utilised. Suggested reasons could be that the employee policies are not working as intended or that the manager has different preferences. With only fifteen character-states gaining on the original values, it was, however, interesting that twelve of these reached or exceeded 8 performance-units, which was the most out of all simulations. With both the failures and high scoring character-states, this simulation represents the most extreme potential evolutionary trajectory of the firm out of the five presented here. This simulation when compared to the other simulations also lends significant support for a long standing call voiced by O’Leary-Kelly and Flores’ (2002) and Malhotra and Sharma (2002) for more integration and understanding between functional areas and particularly between operations and other functions.
On a general reflection, a consensus is evident among all managers surrounding the importance of a good proportion of character-states including (indicated by 8 performance-units or above in the majority of simulations): CS15, quality systems/standards, CS14, TQM sourcing, CS18, 100% inspection, CS17, decentralised error detection and correction, CS7, 5Ss programme, CS5, setup automation, CS12, ERP supply chain integration, CS13, supplier co-operation, and CS1, R&D investment. The practical usefulness perhaps lies more in the exploration of the more problematical areas (Nilsson and Darley, 2006). Character-states in need of review and discussion (signified by multiple failures) include CS7, outsourced corrective maintenance (3 failures) and CS20, line-balancing (2 failures). The results suggest that the policies concerning employees may also need revisiting, as a good proportion faired relatively poorly rarely breaching 8 performance-units. In terms of methodology, the findings also strengthen the consistency/reliability of the data collection procedure adapted from previous work (Allen et al., 2005; 2006; 2007; Baldwin et al., 2005).
Closing Remarks
Manufacturing Manager’s simulation took the most extreme evolutionary trajectory and highlighted the potentially disastrous effects of diversity in decision-making.
On a more academic note, further case studies are still required; firstly, to strengthen the reliability and validity of the methods employed; and, secondly, to encompass more management decision-making scenarios. In future research, clarification could be sought into the potential underlying reasons and consequences for the successes and failures of particular technologies, practices and policies. Unfortunately, in this instance, the empirical setting could not be re-visited. Not long since the main investigation was conducted the case study firm ran into difficulties and ceased operations, approximately a year after the questionnaire survey (late 2006). There are several other avenues for future research that builds on and can extend this work. Firstly, the approach may be used to explore underlying opinions, beliefs and attitudes along with their potential consequences on the evolutionary trajectory of a firm when introducing an entirely new manufacturing technology, practice or policy. At the time of this study, a new ERP system was being implemented and the simulations revealed particular synergies as well as conflicts with other practices. Ideally, this modelling approach should have been applied prior to implementation, perhaps with the input of external experts, and would have perhaps highlighted the most prevalent issues and potential pitfalls. Alternatively, firms may explore a significant change in operations strategy, say from low cost strategy to a high quality or differentiation strategy. The ECS model could then explore the performance of current practice and how new practices could further help (or hinder) the firm. There is also a possibility to model at a level of aggregation above, i.e., the supply chain or perhaps an industrial sector. With the former, supply chain practices in the context of supply chain strategies may be simulated highlighting both what practices (and individual firms) would help or hinder the overall performance of the supply chain.
References
1. Allen, P. M. (1976), "Evolution, population dynamics, and stability", Proceedings of the National Academy of Science (USA), Vol. 73, No. 3, pp. 665-668.
2. Allen, P. M. (1982), "The genesis of structure in social systems: The paradigm of self-organisation", in Renfrew, C. (Eds.), Theory and Explanation in Archaeology, New York: Academic Press, pp. 347-374.
3. Allen, P. M. (1984), "Self-organisation and evolution in urban systems", in Crosby, R. (Eds.), Cities and Regions as Non-Linear Decision Systems, AAAS Selected Symposia 77, Westview Press, Boulder Colorado, pp. 29-62.
4. Allen, P. M., Boulton, J., Strathern, M. and Baldwin, J. S. (2005), "The implications of complexity for business process and strategy." in Richardson, K. (Eds.), Managing Organizational Complexity: Philosophy, Theory and Application, Information Age Publishing Inc., Greenwich, CT, pp. 397-418. 5. Allen, P. M., Strathern, M. and Baldwin, J. S. (2006), "Evolution, diversity and organisations", in
Garnsey, E. and McGlade, J. (Eds.), Complexity and Co-Evolution, Edward Elgar, Cheltenham, England, pp. 22-60.
6. Allen, P. M., Strathern, M. and Baldwin, J. S. (2007), "Complexity and the limits to learning",
Journal of Evolutionary Economics, Vol. 17, No. 4, pp. 401-431.
7. Atkins, P. W. (1984), The Second Law, New York: W. H. Freeman and Company.
8. Baldwin, J. S., Allen, P. M., Winder, B. and Ridgway, K. (2005), "Modelling manufacturing evolution: thoughts on sustainable industrial development", Journal of Cleaner Production, Vol. 13, No. 9, pp. 887-902.
9. Brown, S., Squire, B. and Blackmon, K. (2007), "The contribution of manufacturing strategy involvement and alignment to world-class manufacturing performance", International Journal of Operations and Production Management, Vol. 27, No. 3-4, pp. 282-302.
10. Chaharbaghi, K. (1991), "DSSL II: A powerful tool for modelling and analysing complex systems",
International Journal of Operations and Production Management, Vol. 11, No. 4, pp. 44-88.
11. Choi, T. Y., Dooley, K. J. and Rungtusanatham, M. (2001), "Supply networks and complex adaptive systems: control versus emergence", Journal of Operations Management, Vol. 19, No. 3, pp. 351-366.
12. Cua, K. O., McKone, K. E. and Schroeder, R. G. (2001), "Relationships between implementation of TQM, JIT, and TPM and manufacturing performance", Journal of Operations Management, Vol. 19, No. 6, pp. 675-694.
13. Das, A. and Narasimhan, R. (2001), "Process-technology fit and its implications for manufacturing performance", Journal of Operations Management, Vol. 19, No. 5, pp. 521-540.
14. Eisenhardt, K. M. (1989), "Building theories from case study research", Academy of Management Review, Vol. 14, No. 4, pp. 532-550.
15. Frizelle, G. and Woodcock, E. (1995), "Measuring complexity as an aid to developing operational strategy", International Journal of Operations and Production Management, Vol. 15, No. 5, pp. 26-39.
16. Fynes, B., Voss, C. and de Burca, S. (2005), "The impact of supply chain relationship dynamics on manufacturing performance", International Journal of Operations and Production Management,
Vol. 25, No. 1, pp. 6-19.
17. Glansdorff, P. and Prigogine, I. (1971), Thermodynamics of Structure, Stability and Fluctuations, New York: Wiley Interscience.
18. Haken, H. and Mikhailov, A., Eds. (1993), "Interdisciplinary Approaches to Nonlinear Complex Systems", New York: Springer.
19. Hayes, R. H. and Wheelwright, S. C. (1984), Restoring Our Competitive Edge: Competing Through Manufacturing John Wiley and Sons, New York.
20. Holland, J. (1995), Hidden Order: How Adaptation Builds Complexity, Addison-Wesley, Reading (MA).
21. Islo, H. E. (2001), "Simulation models of organizational systems", International Journal of Technology Management, Vol. 21, No. 3-4, pp. 393-419.
22. Jantsch, E. (1980), The Self-Organizing Universe: Scientific and Human Implications of the Emerging Paradigm of Evolution, Pergamon Press, Oxford, England.
24. Kaihara, T. (2003), "Multi-agent based supply chain modelling with dynamic environment",
International Journal of Production Economics, Vol. 85, No. 2, pp. 263-269.
25. Karkkainen, H. and Hallikas, J. (2006), "Decision making in inter-organisational relationships: implications from systems thinking", International Journal of Technology Management, Vol. 33, No. 2-3, pp. 144-159.
26. Kinni, T. B. (1996), America's Best: IndustryWeek's Guide to World-Class Manufacturing Plants, John Wiley and Sons, New York.
27. Klassen, R. D. and Whybark, D. C. (1999), "The impact of environmental technologies on manufacturing performance", Academy of Management Journal, Vol. 42, No. 6, pp. 599-615.
28. Kondepudi, D. and Prigogine, I. (1998), Modern Thermodynamics: From Heat Engines to Dissipative Structures, John Wiley & Sons Chichester.
29. Leachman, C., Pegels, C. C. and Shin, S. K. (2005), "Manufacturing performance: evaluation and determinants", International Journal of Operations and Production Management, Vol. 25, No. 9-10, pp. 851-874.
30. Li, S. L., Loulou, R. and Rahman, A. (2003), "Technological progress and technology acquisition: Strategic decision under uncertainty", Production and Operations Management, Vol. 12, No. 1, pp. 102-119.
31. Lim, M. K. and Zhang, Z. (2003), "A multi-agent based manufacturing control strategy for responsive manufacturing", Journal of Materials Processing Technology, Vol. 139, No. 1-3, pp. 379-384.
32. Macbeth, D. K. (2002), "Emergent strategy in managing cooperative supply chain change",
International Journal of Operations and Production Management, Vol. 22, No. 7-8, pp. 728-740. 33. MacIntosh, R. and MacLean, D. (2001), "Conditioned emergence: researching change and changing
research", International Journal of Operations and Production Management, Vol. 21, No. 9-10, pp. 1343-1357.
34. Malhotra, M. K. and Sharma, S. (2002), "Spanning the continuum between marketing and operations", Journal of Operations Management, Vol. 20, No. 3, pp. 209-219.
35. McCarthy, I. P. (2003), "Technology management - a complex adaptive systems approach",
International Journal of Technology Management, Vol. 25, No. 8, pp. 728-745.
36. McCarthy, I. P. (2004), "Manufacturing strategy: understanding the fitness landscape", International Journal of Operations and Production Management, Vol. 24, No. 1-2, pp. 124-150.
37. McCarthy, I. P., Leseure, M., Ridgway, K. and Fieller, N. (1997), "Building a manufacturing cladogram", International Journal of Technology Management, Vol. 13, No. 3, pp. 269-286.
38. McCarthy, I. P., Leseure, M., Ridgway, K. and Fieller, N. (2000), "Organisational diversity, evolution and cladistic classifications", The International Journal of Management Science, Vol. 42, No. 28, pp. 77-95.
39. McKone, K. E., Schroeder, R. G. and Cua, K. O. (2001), "The impact of total productive maintenance practices on manufacturing performance", Journal of Operations Management, Vol. 19, No. 1, pp. 39-58.
40. Meade, P., Rabelo, L. and Jones, A. (2006), "Applications of chaos and complexity theories to the technology adoption life cycle: case studies in the hard-drive, microprocessor, and server high-tech industries", International Journal of Technology Management, Vol. 36, No. 4, pp. 318-335.
41. Meredith, J. (1998), "Building operations management theory through case and field research",
Journal of Operations Management, Vol. 16, No. 4, pp. 441-454.
42. Nicolis, G. and Prigogine, I. (1977), Self-Organisation in Non-Equilibrium Systems, New York: Wiley Interscience.
43. Nicolis, G. and Prigogine, I. (1989), Exploring Complexity, New York: Freeman.
44. Nilsson, F. and Darley, V. (2006), "On complex adaptive systems and agent-based modelling for improving decision-making in manufacturing and logistics settings - Experiences from a packaging company", International Journal of Operations and Production Management, Vol. 26, No. 11-12, pp. 1351-1373.
45. O'Leary-Kelly, S. W. and Flores, B. E. (2002), "The integration of manufacturing and marketing/sales decisions: impact on organizational performance", Journal of Operations Management, Vol. 20, No. 3, pp. 221-240.
47. Poundarikapuram, S. and Veeramani, D. (2004), "Distributed decision-making in supply chains and private E-marketplaces", Production and Operations Management, Vol. 13, No. 1, pp. 111-121. 48. Prigogine, I. (1973), "Irreversibility as a symmetry-breaking process", Nature, Vol. 246, No. 5428,
pp. 67-71.
49. Prigogine, I. and Stengers, I. (1987), Order out of Chaos, Bantam Books, New York.
50. Raymond, L., Julien, P. A., Carriere, J. B. and Lachance, R. (1996), "Managing technological change in manufacturing SMEs: A multiple case analysis", International Journal of Technology Management, Vol. 11, No. 3-4, pp. 270-285.
51. Rhee, M. and Mehra, S. (2006), "Aligning operations, marketing, and competitive strategies to enhance performance: An empirical test in the retail banking industry", Omega-International Journal of Management Science, Vol. 34, No. 5, pp. 505-515.
52. Saunders, M., Lewis, P. and Thornhill, A. (2007), Research Methods for Business Students, 4th edition, FT Prentice Hall, Harlow, England.
53. Schonberger, R. J. (2008), World Class Manufacturing: The Lessons of Simplicity Applied Free Press.
54. Simon, H. A. (1955), "A behavioral model of rational choice", Quarterley Journal of Economics,
Vol. 6, No. 1, pp. 99-118.
55. Simon, H. A. (1983), Reason in Human Affairs, Stanford University Press, Stanford, California. 56. Skinner, W. (1969), "Manufacturing: missing link in corporate strategy", Harvard Business Review,
Vol. 47, No. 3, pp. 136-45.
57. Slack, N., Chambers, S. and Johnston, R. (2007), Operations Management, 5th edition, Prentice Hall, Harlow, England.
58. Womack, J. P., Jones, D. T. and Roos, D. (1990), The Machine that Changed the World, MacMillan Publishing, New York.
59. Zhou, Z. D., Wang, H. H., Chen, Y. P., Ai, W., Ong, S. K., Fuh, J. Y. H. and Nee, A. Y. C. (2003), "A multi-agent-based agile scheduling model for a virtual manufacturing environment",
International Journal of Advanced Manufacturing Technology, Vol. 21, No. 12, pp. 980-984. 60. Zhu, Q. and Cote, R. P. (2004), "Integrating green supply chain management into an embryonic
eco-industrial development: a case study of the Guitang Group", Journal of Cleaner Production, Vol. 12, No. 8-10, pp. 1025-1035.
Appendix 1
Pre-prepared check list of operations management technologies, practices and policies (adapted from McCarthy et al., 1997; Womack et al., 1990).
TECHNOLOIES, PRACTICES AND POLICIES TECHNOLOGIES, PRACTICES AND POLICIES
1. Standardisation of parts 29. U-shape layout
2. Assembly time standards 30. Preventive maintenance
3. Assembly line layout 31. Individual error correction; products are not re-routed
4. Reduction of craft skills to a special fixing station
5. Automation (machine paced shop) 32. Sequential dependency of workers
6. Pull production system 33. Line balancing
7. Reduction of lot size 34. Team policy (motivation, pay and autonomy for team
8. Pull procurement 35. Groups Vs teams
9. Operator based machine maintenance 36. Job enrichment
10. Quality circles 37. Manufacturing cells
11. Employee innovation prizes 38. Concurrent engineering
12. Job rotation 49. ABC costing
13. Large volume production 40. Excess capacity
14. Suppliers selected primarily on price 41. Flexible automation for product versions
15. Exchange of workers with suppliers 42. Agile automation for different products
16. Socialisation training (master/apprentice) 43. Insourcing
17. Proactive training programmes 44. Immigrant workforce
18. Product range reduction 45. Dedicated automation
19. Autonomation 46. Division of labour
20. Multiple sub-contracting 47. Employees are system tools and simply operate machines
21. Quality systems (tools, procedures, ISO9000) 48. Employees as system developers; value adding
22. Quality philosophy (TQM, culture) 49. Product focus
23. Open book policy with suppliers; cost sharing 50. Parallel processing
24. Flexible multi-functional workforce 51. Dependence on written rules; unwillingness to change
25. Set-up time reduction rules as the economic order quantity
26. Kaizen change management 52. Further intensification of labour; employees are considered
27. TQM sourcing; suppliers selected on quality part of the machine to be replaced by machines