Implication of MPPT on Converter Reliability for PV
Systems
J. Dong, S. Lyden
School of Engineering and ICTUniversity of Tasmania Hobart, Australia
Abstract—With the increasing use of renewable energies around the world, particularly photovoltaic (PV) systems, considerable research efforts have been dedicated to achieving maximum efficiency. Maximum Power Point Tracking (MPPT) techniques are proposed for PV systems to increase the energy capture. The type of MPPT method utilized in a system can directly influence the energy capture positively, however may also have an unwanted side effect in causing voltage stresses in the converter components which may effect the overall reliability of the system. This paper provides a preliminary investigation of the impact of the choice of MPPT method on the voltage fluctuations in the DC-link and PV-side capacitor of a PV system. The investigation is a first step in working towards a method for assessing the impact of the choice of MPPT method on the reliability of the converter.
Index Terms— Converter, Maximum Power Point Tracking, Photovoltaic, Power electronics, Stress
I.INTRODUCTION
Renewable energy integration is increasing all around the world. Many residential households in Australia and other countries now have Photovoltaic (PV) Systems installed on their rooftops to generate energy which can be consumed within the house or exported to the grid. One key area of research is improving the energy capture from such systems through the development of PV cells with greater sunlight conversion efficiencies [1], the development of advanced power electronics interfaces [2]–[4], and through the development of Maximum Power Point Tracking (MPPT) methods to overcome the non-linear, potentially multi-peak, and constantly varying power-voltage (P-V) characteristic under typical residential environmental conditions [5]–[7]. The focus of most MPPT studies is on achieving global peak tracking under non-uniform environmental conditions, or on improving the overall energy capture from the PV system [5]–[7]. These studies infrequently consider the efficiency of the power electronics interface in the evaluation of the method and never consider the impact that the selected method may inadvertently have on the reliability of the converter components.
Many of the conventional MPPT methods are designed for uniform operating conditions, and are based on a perturbation and observation method or on key characteristics of the PV system. Such conventional techniques that are most commonly utilized in commercial inverters are Perturb and Observe (P&O)
and Incremental Conductance (IncCond) [8], [9]. These techniques however do not perform effectively when partial shading conditions (PSC) arise across a PV system resulting in a multi-peak P-V characteristic.
To address PSC, many newer, advanced, global MPPT (GMPPT) methods have been proposed [10]–[12]. One of these, Particle Swarm Optimization (PSO) is a technique based on the behavior of birds flocking and fish schooling [13], [14]. A limitation of this method is that the search points that need to be sampled may occur at voltages and duty cycles that are dramatically different to each other. This means that unlike the smooth almost predicable change in duty cycle that occurs for a method like P&O, the duty cycle for a GMPPT method like PSO may vary quite rapidly. Studying the impact of this variation on the voltage fluctuations across the PV-side and DC-link capacitor is the subject of this paper. The presented study is a preliminary investigation into the impact that the MPPT method has on the potential reliability of the power electronics.
The PV system is generally highly reliable, however some failure factors of the power electronics may result in serious damage to the system [15]. A PV system may fail due to complex climatic environmental conditions and vulnerable components such as the capacitor and semiconductors in the power electronics interface [16].
In Section II, MPPT for PV systems is further described and the key MPPT methods considered in this paper outlined. Section III, contains a brief literature review of existing reliability studies on power electronics for PV system and other renewable energy applications. In Section IV, the method and simulation model are introduced, with results and discussion presented in Section V. Finally, conclusions and future work are presented in Section VI.
II.MAXIMUM POWER POINT TRACKING METHODS
methods designed for uniform conditions become trapped in local maxima during PSC leading to a considerably lower efficiency when the captured power is compared with the potential available power. However, as described in Section I, many of these GMPPT methods do acquire more output power from the system, although they often rely on rapidly and distinctly changing duty cycles in the search process. The P&O and PSO methods are utilized in this research.
A.P&O
The P&O method is designed to follow a curve to locate the maxima. The operating point is incrementally increased/decreased and the corresponding change in power measured. When the change in power is no longer increasing, the perturbation in the operating point is applied in the opposite direction. Depending on the step size of the perturbation the method may quickly track to the peak and then oscillate widely around that point, or it may slowly track and then exhibit a small oscillation around the peak. This tradeoff between step size and steady-state oscillation has led to a number of variable step size P&O methods being proposed [17]–[19]. The standard P&O method with a fixed step size is applied in this research.
B.PSO
The PSO method is based on the behavior of birds and fish in collectively solving a problem such as locating food. There are a number of particles defined in this method that will move through the search space and usually converge to a global maxima [11], [14]. Each particle has a position and velocity, as well as its own best location and global best location which all feature in the determination of a new operating point.
III.POWER ELECTRONICS RELIABILITY STUDIES FOR
RENEWABLE APPLICATIONS
Several surveys of reliability assessment for power electronic components such as IGBTs, capacitors and inverters have been reported recently [21]–[23]. These studies highlight that the converter is responsible for the majority of failures of a PV system, and that most of these converter failures are due to the capacitors used in the DC-link. The converter usually has an operational life of 5 to 10 years, with a mean time between failures (MTBF) of between 1 and 16 years [24]. This is in contrast with the PV modules themselves, which typically have a warranty for 20-25 years and a MTBF of 520 years [24].
Capacitors are widely used as energy storage elements in a PV system to balance the mismatch between the DC power produced from PV panels and AC power injected into the grid. There are two important capacitors in a PV conversion system: one on the PV-side of the DC-DC convertor, and one on the inverter side (the DC-link capacitor). The main functions that the capacitor at the DC-link provide are power balancing and limiting the DC-link voltage ripple [20]. As mentioned in [28], the MPPT efficiency can be increased by choosing an appropriately sized PV-side capacitor. A relatively small value of capacitor could attenuate the high frequency voltage ripple at the DC-DC converter input. The PV-side capacitor is actually a filtering capacitor to reduce the power oscillation by maintaining
capacitor is not included, a significant voltage oscillation caused by the large current ripple of the converter’s inductor will be observed. By adding a small filter capacitor, the voltage ripple on the PV-side can be reduced dramatically [28].
Generally electrolytic capacitors can be modeled by an equivalent ideal capacitor in series with an equivalent series resistor (ESR) and equivalent series inductor (ESL). It can be observed that the ESR is a frequency dependent. The DC-link double-line frequency components and the impact of the mission profile on the PV-side capacitor will cause power losses in the capacitor due to the high frequency pulses [25]. The power losses may heat up the capacitor leading to a hot spot. The failure mechanism of the capacitor is mainly caused by the internal hot-spot temperature [25], [26], so this effect is significant.
In the single-phase grid-connected PV system, the injected current and voltage to the grid can be assumed to be [20]:
= ( ) (1)
= ( ) (2)
where, is the fundamental frequency of the grid and and are the amplitude of the grid current and voltage, respectively.
The instantaneous power to the grid can be calculated as
( ) = 1
2 cos(2 ) +
1
2 (3)
As illustrated in (3), ( ) has a double frequency
fluctuating power which should be decoupled by using a large value of capacitor. The frequency oscillation could also cause double-line-frequency voltage ripple at the DC-link capacitor [20]. The voltage ripple and rms current through the capacitor can be estimated as
∆ ≈ (4)
, =
√2 (5)
where = is the average power generated by the solar
panels.
As can be seen from (4) and (5), there is a trade-off between voltage ripple and thermal stress, which should be considered in the design process [20]. The DC-link voltage ripple could be reduced, although not fully eliminated, by adding a larger capacitor [27]. However, this would increase the cost and size of the system.
IV.METHOD AND SIMULATION MODEL
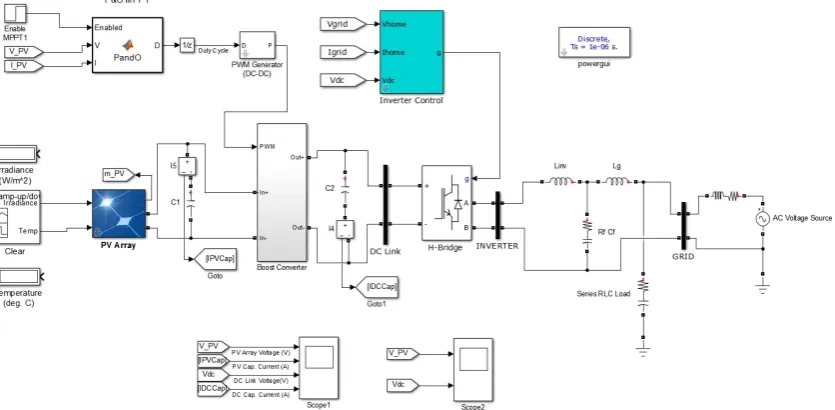
The modeled systems is a 3 kW single-phase two stage grid-connected PV system that would be suitable to be placed in a residential environment. The standard MATLAB/Simulink PV module model was utilized with SunPower SPR-305-WHT modules. The PV modules are connected via a boost converter which executes the MPPT function. The two stage conversion system consists of the DC-DC boost converter and a DC-AC inverter. A PV-side and DC-link capacitor are included in the system for the reasons described above. The DC power extracted from the PV module is stepped up by a boost converter to 400 V. The output voltage of the inverter is AC 230 V rms. Figure 1, shows the complete PV power system with P&O MPPT method. In order to analyze the impact of MPPT on reliability of the capacitors in the system, the voltage and current ripple of the capacitors is calculated for different mission profiles. Due to space, only the voltage stresses are depicted in this paper. The electrical stresses translated from mission profile on the capacitors are discussed in Section V.
The implementations considered include P&O method with two different duty cycle step sizes, of ∆ 1 = 5 − 3 and
∆ 2 = 5 − 4 . The parameters of the PSO MPPT controller
are learning factor 0.4, acceleration coefficients of 1.2 and 1.6 [13]. A power deviation and voltage deviation are also defined in addition to a range of voltage giving the likely location of the MPP between 150 and 300 V.
The double-line-frequency oscillation already described in the output power causes the same double-line-frequency ripple
at the DC-link voltage. The DC-link capacitor starts to discharge to fulfill the additional output power when is larger than . After the capacitor has been charged by input power, less power will be sent to the grid. It is found that the DC-link voltage ripple ∆ is determined by the DC-link capacitance and power generated by the PV panel. In order to achieve a small voltage ripple, the size of capacitor should be relatively large.
V.RESULTS AND DISCUSSION
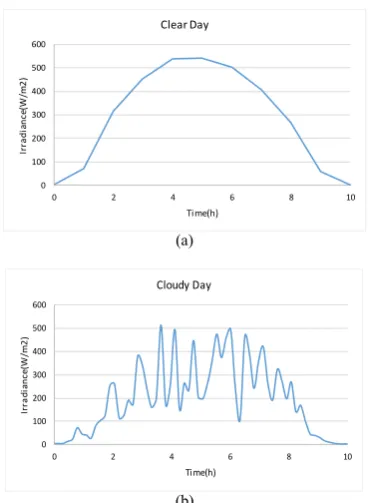
The model described in Section IV is utilized to determine the impact of mission profiles, determined by the choice of MPPT method, on the capacitors. Two different irradiance conditions are considered, one clear and one cloudy, which are shown in Fig. 2. The solar irradiance data is obtained from Bureau of Meteorology [29], with data for the clear day coming from May 13, 2015, and the cloudy day from May 26, 2015. Note that the jagged pattern in the cloudy day shows the increased variability in irradiance caused by clouds.
A.Clear day
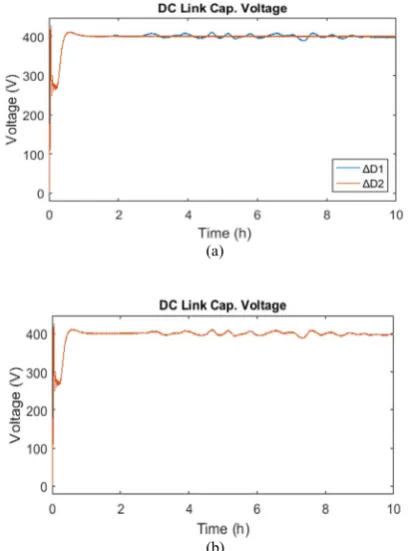
[image:3.595.92.510.400.605.2]The voltage stresses on the PV-side and DC-link capacitor for the clear day are shown in Fig. 3 and Fig. 4, respectively. It can be observed from Fig. 3 that the PV-side capacitor experienced a wider range of voltage variations compared to the DC-link capacitor as the PV-side capacitor has more ‘exposure’ to the mission profile and more ‘connection’ to the MPPT.
The DC-link voltage ripple of the capacitor in steady-state is approximately 1.5V for both the P&O and PSO methods. The transient voltage variation of the PSO method is larger than the P&O method. In order to characterize the voltage and current ripples on the capacitors, Table I is presented. The transient and steady state voltage and current ripple for each implementation is given for both the PV-side and DC-link capacitors.
B.Cloudy day
The voltage stresses on the PV-side and DC-link capacitor for the cloudy day are shown in Fig. 5 and Fig. 6, respectively. As shown in Fig. 5, the voltage variation at the PV-side caused by variable solar irradiance has an impact during the whole period. The steady-state voltage and current (not shown) ripples are also higher for the cloudy case than for the clear day for both MPPT methods considered. In the case shown here, the P&O method failed to continuously track the voltage of the MPP when there was a rapid change in irradiance due to the clouds.
This result is consistent with other studies that have shown that conventional techniques often fail under rapidly changing and non-uniform environmental conditions [5].
Table I. Voltage and current ripples of capacitors for clear day. Clear Day PV Cap.
Voltage Ripple (V)
PV Cap. Current Ripple (A)
DC Cap. Voltage Ripple (V)
DC Cap. Current Ripple (A)
P&O
∆D=5e-3
Transient 300 (max) 3 (max) 415 (max) 560 (max)
Steady-State 25 3.8 1.5 40
P&O
∆D=5e-4
Transient 310 (max) 0.6 (max) 410 (max) 560 (max)
Steady-State 25 0.5 1.5 40
PSO
Transient 100 11 41 0(max) 560 (max)
Steady-1.5 1.2 1.5 40
(a)
[image:4.595.329.525.56.317.2](b)
Fig. 2 Irradiance data used in simulations (a) clear day, (b) cloudy day. 0
100 200 300 400 500 600
0 2 4 6 8 10
Ir
ra
d
ia
n
ce
(W
/m
2
)
Time(h) Clear Day
0 100 200 300 400 500 600
0 2 4 6 8 10
Ir
ra
d
ia
n
ce
(W
/m
2
)
Time(h) Cloudy Day
(a)
(a)
[image:4.595.69.254.73.325.2](b)
Fig. 4 Clear day DC-link capacitor voltage stresses (a) P&O, (b) PSO.
[image:4.595.53.260.346.620.2](b)
In order to characterize the voltage and current ripples on the capacitors for the cloudy day, Table II is presented. It can be observed that the P&O method failed to track to the MPP under cloudy environmental conditions, which means that the output voltages of the capacitors never truly reached a steady state.
Table II. Voltage and current ripples of capacitors for cloudy day. Cloudy Day PV Cap.
Voltage Ripple (V)
PV Cap. Current Ripple (A)
DC Cap. Voltage Ripple (V)
DC Cap. Current Ripple (A)
P&O
∆D=5e-3
Transient 310 (max) 2.9 (max) 410 (max) 560 (max)
Steady-State - 4.2 1.5 40
P&O
∆D=5e-4
Transient 270 (max) 0.3 (max) 410 (max) 560 (max)
Steady-State - 0.6 - 40
PSO
Transient 170 14 410 (max) 560 (max)
Steady-State 25 2 1.5 40
C.Summary of results
It can be concluded from the two cases studies that the PV-side capacitor experiences voltage and current ripples induced by the mission profile (solar irradiance). The voltage stresses are mainly determined by the power level and MPPT algorithm. By using the P&O method, a larger voltage perturbation step size causes larger PV-side voltage and current ripples and thus more power losses. In the case of the cloudy day, the PV-side capacitor experienced more obvious voltage variation. Meanwhile the transient voltage ripples induced by the mission profile were also observed at the DC-link capacitor, which can affect the capacitors lifetime and cause operation failure of the capacitors.
Generally, the transient voltage variation for the PSO method was larger than for the P&O method, however the steady-state voltage variation was typically smaller with the PSO method.
VI. CONCLUSION AND FUTURE WORK
This paper has presented a preliminary study into the impacts of the chosen MPPT method on the reliability of the power electronic converter by consideration of the PV-side and DC-link capacitor voltage and current variations. The results have shown that less transient voltage ripple on capacitors is observed when the P&O method is applied, thus the P&O algorithm can cause lower voltage stress (electrical stress) compared with the PSO algorithm. From a system design point of view, the PV-side capacitor should have the ability to deal with a wide range of voltage variations caused by the impact of the mission profile and MPPT algorithm. The inverter controller parameters should also be adjusted to reduce voltage and current ripples on the DC-link capacitor [20], [30]. The implementation of the MPPT method has been shown to lead to electrical stresses on power electronics due to the additional measurements of voltage and current [31]. This has the implication that MPPT methods should be designed to both achieve global peak tracking while minimizing the stresses on the elements of the power electronic converter. From the reliability point of view, advanced MPPT methods such as the PSO method, may not have a great performance compared with conventional techniques in practice. Future work is required to determine indices to quantify the impact of the voltage stresses on the lifetime of the components and to determine if the extra energy capture provided from advanced MPPT methods overcomes the limitation of reduced reliability of the power electronics interface.
(a)
(b)
Fig. 6 Cloudy day DC-link capacitor voltage stresses (a) P&O, (b) PSO. (a)
[image:5.595.54.259.133.381.2](b)
[image:5.595.55.262.407.683.2]Future work will involve extending the analysis to focus on the other key components in the converter, consideration of other MPPT methods, and a more extensive investigation of the performance of the MPPT methods and associated converter stresses under simulated non-uniform environmental conditions.
REFERENCES
[1] M. A. Green, K. Emery, Y. Hishikawa, W. Warta, and E. D. Dunlop, “Solar cell
efficiency tables (Version 45),” Prog. Photovoltaics Res. Appl., vol. 23, no. 1, pp. 1–
9, Jan. 2015.
[2] I. Abdalla, J. Corda, and L. Zhang, “Multilevel DC-link inverter and control algorithm
to overcome the PV partial shading,” IEEE Trans. Power Electron., vol. 28, no. 1, pp.
14–18, 2013.
[3] H. Abu-Rub, A. Iqbal, S. Moin Ahmed, F. Z. Peng, Y. Li, and G. Baoming, “Quasi-Z-Source Inverter-Based Photovoltaic Generation System With Maximum Power
Tracking Control Using ANFIS,” IEEE Trans. Sustain. Energy, vol. 4, no. 1, pp. 11–
20, Jan. 2013.
[4] C. L. Trujillo, D. Velasco, G. Garcera, E. Figueres, and R. Ortega, “Reconfigurable control scheme for a microinverter working in both grid connected and island mode,” in 2011 IEEE International Symposium on Industrial Electronics, 2011, pp. 1477– 1481.
[5] S. Lyden and M. E. Haque, “Maximum Power Point Tracking techniques for
photovoltaic systems: A comprehensive review and comparative analysis,” Renew.
Sustain. Energy Rev., vol. 52, pp. 1504–1518, Dec. 2015.
[6] W. Xiao, A. Elnosh, V. Khadkikar, and H. Zeineldin, “Overview of maximum power
point tracking technologies for photovoltaic power systems,” in 37th Annual
Conference of the IEEE Industrial Electronics Society, 2011, pp. 3900–3905. [7] B. Subudhi and R. Pradhan, “A comparative study on maximum power point tracking
techniques for photovoltaic power systems,” IEEE Trans. Sustain. Energy, vol. 4, no.
1, pp. 89–98, Jan. 2013.
[8] D. Sera, L. Mathe, T. Kerekes, S. V. Spataru, and R. Teodorescu, “On the
Perturb-and-Observe and Incremental Conductance MPPT Methods for PV Systems,” IEEE
J. Photovolt., vol. 3, no. 3, pp. 1070–1078, Jul. 2013.
[9] Kok Soon Tey and S. Mekhilef, “Modified Incremental Conductance Algorithm for
Photovoltaic System Under Partial Shading Conditions and Load Variation,” IEEE
Trans. Ind. Electron., vol. 61, no. 10, pp. 5384–5392, Oct. 2014.
[10] T. L. Nguyen and K. S. Low, “A global maximum power point tracking scheme
employing DIRECT search algorithm for photovoltaic systems,” IEEE Trans. Ind.
Electron., vol. 57, no. 10, pp. 3456–3467, 2010.
[11] M. Miyatake, M. Veerachary, F. Toriumi, N. Fujii, and H. Ko, “Maximum power
point tracking of multiple photovoltaic arrays: a PSO approach,” IEEE Trans. Aerosp.
Electron. Syst., vol. 47, no. 1, pp. 367–380, 2011.
[12] S. Lyden and E. Haque, “A Simulated Annealing Global Maximum Power Point
Tracking Approach for PV Modules under Partial Shading Conditions,” IEEE Trans.
Power Electron., vol. PP, no. 99, pp. 1–1, 2015.
[13] K. Ishaque, Z. Salam, M. Amjad, and S. Mekhilef, “An improved particle swarm
optimization (PSO)- based MPPT for PV with reduced steady state oscillation,” IEEE
Trans. Power Electron., vol. 27, no. 8, pp. 3627–3638, 2012.
[14] K. Ishaque and Z. Salam, “A deterministic particle swarm optimization maximum
power point tracker for photovoltaic system under partial shading condition,” IEEE
Trans. Ind. Electron., vol. 60, no. 8, pp. 3195–3206, 2013.
[15] A. B. Maish, C. Atcitty, S. Hester, D. Greenberg, D. Osborn, D. Collier, and M. Brine,
“Photovoltaic system reliability,” in Conference Record of the Twenty Sixth IEEE
Photovoltaic Specialists Conference - 1997, pp. 1049–1054.
[16] P. Lall, “Tutorial: temperature as an input to microelectronics-reliability models,” IEEE Trans. Reliab., vol. 45, no. 1, pp. 3–9, Mar. 1996.
[17] S. K. Kollimalla and M. K. Mishra, “Variable Perturbation Size Adaptive P&O MPPT
Algorithm for Sudden Changes in Irradiance,” IEEE Trans. Sustain. Energy, vol. PP,
no. 99, pp. 1–1, 2014.
[18] M. A. Elgendy, B. Zahawi, and D. J. Atkinson, “Assessment of perturb and observe
MPPT algorithm implementation techniques for PV pumping applications,” IEEE
Trans. Sustain. Energy, vol. 3, no. 1, pp. 21–33, Jan. 2012.
[19] S. Kabir, R. Bansal, and M. Nadarajah, “Effects of partial shading on Photovoltaic
with advanced MPPT scheme,” in IEEE International Conference on Power and
Energy (PECon), 2012, pp. 354–359.
[20] Y. Yang, K. Ma, H. Wang, and F. Blaabjerg, “Mission profile translation to capacitor
stresses in grid-connected photovoltaic systems,” in 2014 IEEE Energy Conversion
Congress and Exposition (ECCE), 2014, pp. 5479–5486.
[21] A. K. Abdelsalam, A. M. Massoud, S. Ahmed, and P. N. Enjeti, “High-performance adaptive perturb and observe MPPT technique for photovoltaic-based microgrids,” IEEE Trans. Power Electron., vol. 26, no. 4, pp. 1010–1021, Apr. 2011.
[22] M. G. Villalva and E. R. F., “Analysis and simulation of the P&O MPPT
algorithm using a linearized PV array model,” in 2009 35th Annual Conference of
IEEE Industrial Electronics, 2009, pp. 231–236.
[23] V. Smet, F. Forest, J.-J. Huselstein, F. Richardeau, Z. Khatir, S. Lefebvre, and M. Berkani, “Ageing and Failure Modes of IGBT Modules in High-Temperature Power
Cycling,” IEEE Trans. Ind. Electron., vol. 58, no. 10, pp. 4931–4941, Oct. 2011.
[24] H. S. Chung, H. (Professor in energy technology) Wang, F. Blaabjerg, and M. Pecht, Reliability of power electronic converter systems. Institution of Engineering and Technology, 2016.
[25] K. Lee, T. M. Jahns, G. Venkataramanan, and W. E. Berkopec, “DC-Bus Electrolytic Capacitor Stress in Adjustable-Speed Drives Under Input Voltage Unbalance and Sag
Conditions,” IEEE Trans. Ind. Appl., vol. 43, no. 2, pp. 495–504, 2007.
[26] K. Lee, T. M. Jahns, T. A. Lipo, G. Venkataramanan, and W. E. Berkopec, “Impact of Input Voltage Sag and Unbalance on DC-Link Inductor and Capacitor Stress in
Adjustable-Speed Drives,” IEEE Trans. Ind. Appl., vol. 44, no. 6, pp. 1825–1833,
2008.
[27] H. Wang and F. Blaabjerg, “Reliability of Capacitors for DC-Link Applications in
Power Electronic Converters: An Overview,” IEEE Trans. Ind. Appl., vol. 50, no. 5,
pp. 3569–3578, Sep. 2014.
[28] Feng Gao, Ding Li, Poh Chiang Loh, Yi Tang, and Peng Wang, “Indirect dc-link
voltage control of two-stage single-phase PV inverter,” in 2009 IEEE Energy
Conversion Congress and Exposition, 2009, pp. 1166–1172.
[29] Bureau of Meteoroloy, “One Minute Solar Data,” 2012. [Online]. Available: http://www.bom.gov.au/climate/data/oneminsolar/about-IDCJAC0022.shtml. [30] Huai Wang, H. S.-H. Chung, and Wenchao Liu, “Use of a Series Voltage
Compensator for Reduction of the DC-Link Capacitance in a Capacitor-Supported
System,” IEEE Trans. Power Electron., vol. 29, no. 3, pp. 1163–1175, Mar. 2014.
[31] M. Andresen, G. Buticchi, and M. Liserre, “Thermal stress reduced maximum power
point tracking for two stages photovoltaic converters,” in 2015 IEEE Energy