www.electrochemsci.org
Design, fabrication and performance characterization of a
miniature PEMFC stack based on MEMS technology
Xigui Zhang1,2,*, Tao Wang1,2 , Dan Zheng1,3, Jian Zhang1 , Yao Zhang1, Ling Zhu1, Cong Chen1, Jian
Yan1, Haohan Liu1, Yuwan Lou1, Xinxin Li1, Baojia Xia1
1Shanghai Institute of Microsystem and Information Technology, Chinese Academy of Sciences,
Shanghai 200050, China
2Shanghai Institute of Shanghai 200381, China
3Shanghai Institute of Technology, Shanghai 200233, China *E-mail: [email protected]
Received: 10 June 2007 / Accepted: 9 July 2007 / Published: 1 August 2007
In this study, the design, fabrication and performance characterization of a miniature 6-cell PEMFC stack based on MEMS technology was carried out. A novel type of Z-type anode flow field plates were applied to replace the full pin-type ones used previously and all the single cells were assembled in the same plane with a fuel buffer/distributor as their support. Operating on dry H2 and air-breathing
conditionsat 20±3oC and 50±3% RH, the stack produced the peak power of 1.34W and the estimated
maximum power density of the stack could reach 335W/L when the stack’s volume of 4.0ml was considered. Meanwhile, all the single cells in the stack performance well and even based on V-I and internal resistance measurement (EIS).The results suggested that the stack’s performance was greatly improved compared with the previous work. The novel Z-type anode flow field leading to more even fuel distribution among each cell probably had the greatest contribution for the improvement.
Keywords: PEMFC stack design; MEMS technology; Fuel buffer/distributor; Z-type anode flow field; Air-breathing
1. INTRODUCTION
Int. J. Electrochem. Sci., Vol. 2, 2007
619 constraints, especially when it comes to the one or less Watt of FCs. Thanks to Micro-Electronic-Mechanical-System (MEMS) technology, micro-channel patterns of FCs bipolar plates into which reactants are fed and other components (such as micro fuel reformers/processors [7,12,13] and micro pumps[3]) can be fabricated on a silicon wafer with high resolution and good reproducability. It has been demonstrated that MEMS technology is one of the most promising technologies for fuel cell miniaturization and integration. However, a lot of work was focused only on using such technology for fabrication of the single cell [2, 8, 9]. In fact, for the practical uses, several or even hundreds of single cells needed to be serially grouped or integrated to offer the required voltage and power. From our knowledge, there were only a few of stacks fabricated by MEMS technology were reported or proposed [14-16]. For example, Lee et al. [14] reported a micro fuel cell stack in which a planar array of cells is serially connected in a “flip-flop” configuration. The peak power in a 4-cell silicon assembly was reported to reach 40 mW/cm2 using hydrogen and oxygen as fuel and oxidizer. Yu et al. [15]
fabricated a miniature twin fuel cells connected in series by sandwiching two membrane-electrode assemblies between two silicon micro-machined plates. The electricity interconnection from the cathode of one cell to the anode of another cell is made in the same plane and the interconnectionwas fabricated by sputtering a layer of copper over a layer of gold on the top of the silicon wafer. The measured peak power density was 190.4mW/cm2 at 270mA/cm2 when operating on dry H
2 / O2 at
25°C and atmospheric pressure.
In this study, Design, fabrication and performance characterization of a MEMS-based 6-cell PEMFC stack was investigated. A novel anode flow field plates for the stack and a fuel buffer/distributor were fabricated by a classical MEMS etching and silicon-glass bonding technologies respectively. Each cell was made by sandwiching a membrane-electrode-assembly (MEA) between two flow field plates and they were assembled in the same plane with a fuel buffer/distributor as their support. Performance and electrochemical resistance characterization of the stack were done by the linear polarization and Electrochemical Impedance spectroscopy (EIS) under dry hydrogen and air-breathing conditions for the cathode.
2. EXPERIMENTAL PART
2.1. Design of the stack
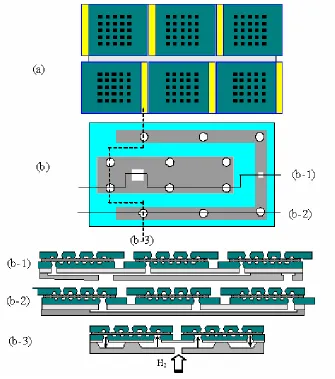
The MEMS-based 6-cell stack was made by assembling the 6 cells in the same plane with a fuel buffer/distributor as their support. The fuel buffer/distributor was fabricated by a silicon-glass bonding technology. Each cell was fabricated by sandwiching the home-made MEA between two silicon wafer-based flow field plates with active area of 1.44cm2. Two strips of the cells were arranged
Figure 1. The schematic structure diagram of the 6-Cell MEMS-based PEMFC stack
2.2. Fabrication of the flow field plates of Z-type anode and air-breathing cathode
A 4 inch, 525±20 m-thick N-type <1 0 0> silicon wafer with resistance ratio ranging from 1.5 to 2.5 ·cm was used as the original material in this work. The fabricating processes was briefly introduced as follow: (1) Heat deposit of a silicon dioxide layer on the wafer used as a silicon etch mask; (2) Photolithography of the mask windows on the back of the wafer; (3) Heat deposit of a silicon dioxide layer again to form the different thick layers on the back of the wafer; (4) Photolithography of the mask windows on the front of the wafer; (5) Etch of the front wafer in 40wt% KOH solution at 50 and the etching depth was controlled at 100µm±2µm; (6) Wash the wafer in BOE solution (4 portions of 40% NH4F and 6 of 49% HF mixture solution); (7) Double sides wet etch
Int. J. Electrochem. Sci., Vol. 2, 2007
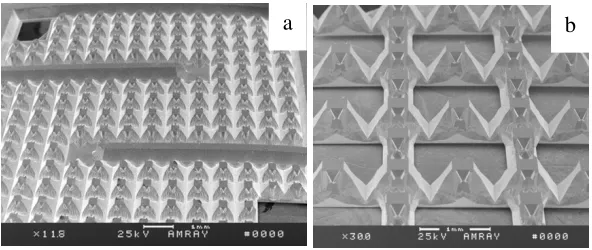
621 Remove the residual silicon dioxide on the surface of the wafer; (9) Heat deposit of continuous silicon dioxide layers for electrical insulation; (10) Sputtering a Ti/Pt/Au composite metal layers on the wafer surface to act as conductive layer and ensure the metal layers would bond well in contact with the silicon wafer. The thickness of Ti, Pt and Au layer was controlled at 0.1µm. 0.3 µm and 0.5µm respectively. The flow field patterns of the anode are a array of pin-type isolated ‘isles’ and two through pseudo-square holes for fuel in and out. The isle is about 293×293µm2 on top and 300µm in
depth. Note that two pieces of micro grooves measuring 8cm were formed simultaneously (Fig. 2a).The through hole for hydrogen in is about 1.5×1.5mm2 and that for hydrogen out is about
0.5×0.5mm2 respectively. The flow field pattern of the cathode is an array of pin-type isolated through
‘isles’ using for air-breathing (Fig. 2b). The dimension of the flow field plate is about 1.6×1.8cm2 with
active area of 1.2×1.2cm2. Note that width and length of the two plates is not equal and about
0.2×1.6cm2 free spaces was used for spot welding between the adjacent cells. In total, ten anode flow
field plates and ten cathode flow field plates were formed on the silicon wafer.
Figure 2. The SEM pictures of the anode and cathode flow field plates fabricated. (a) anode, (b) cathode
2.3. Make of the fuel buffer/distributor
A MEMS etching and bonding technology were applied to make the fuel buffer/distributor. First, using the similar wet etching method described above, a strip chamber with dimensions of about 43mm long, 11mm wide and 100µm deep was formed on the front side of another piece of silicon wafer with 350µm thickness. This chamber will act as fuel (hydrogen) buffer/distributor. A C-type channel, a fuel feed hole and a square outlet hole were fabricated at the same time. The C-type channel is about 3mm wide and 100µm deep. The C-type channel will collect exhaust gases from the 6 cells and drain them out from the outlet hole. The fuel feed hole and outlet hole are 2.5mm wide. Second, a single side polished. A piece of Pyrex glass with 500µm thickness was ultrasonically drilled to form 12 through holes with 2mm in diameter. The silicon/glass bonding was applied then in the bonding machine with 400V working voltage for about 15minutes, and the bonding temperature was controlled at about 800oC. Note again that 6 of the 12 through holes were designed to act as the single cells’ feed hole and the remains outlet holes respectively. The picture of the final bonded fuel buffer/distributor is given in Fig. 3.
[image:4.612.162.458.293.418.2]Figure 3. Image of the fuel buffer/distributor fabricated based on MEMS silicon-glass bonding technology
2.4. Assembly of the stack
Prior to assemble the single cells, a homemade membrane-electrode-assembly (MEA, with Pt loading 0.3mg/cm2 for anode and 0.5mg/cm2 for cathode respectively; Nafion112 was used as separate
membrane) was cut into 6 pieces with the dimension of 1.4cm×1.4cm. In order to prevent short-circuited, the cut MEAs were ultrasonically agitated in deionized water for several seconds to remove the residential conductive materials on the cut sides.
To assemble the single cell, a MEA was sandwiched between the anode and cathode plates and pressed for about 12 hours by an electronic spiral micrometer. A kind of Epoxy resin was used to seal the cell and act as a bonding agent between the MEA and the plates.
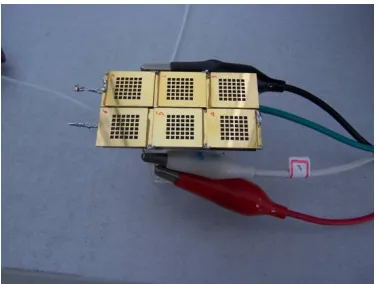
[image:5.612.145.464.82.245.2]The assembled cells were then one by one mounted on the fuel buffer/distributor with the cathode facing up. All the void space between the cells and the glasses was filled with epoxy resin seals to guarantee no gas leakage and good sealing. Work of assembling the 6-cell stack was finally completed by spot welding the adjacent cells to make them electrically conductive. The stack is about 4.0ml in volume. The picture of the finally assembled stack is shown in Fig. 4.
Figure 4. Image of the assembled stack under testing
Exhaust gases outlet from the stack
Fuel inlet from the canister Fuel chamber
C-type channel
Fuel inlet for the cell
[image:5.612.213.403.560.702.2]Int. J. Electrochem. Sci., Vol. 2, 2007
623 2.5. Performance and electrochemical resistance characterization of the stack
Performance characterization was carried out through the Arbin FCTs fuel cell instrument. Before collecting data, the stack was allowed to be activated for at leat one hour at a current density of 35mA/cm2. The stack was operated on dry hydrogen at atmospheric pressure and air-breathing at
20±3°C and 50±3% RH.
Impedance measurements were carried out using a Solartron SI 1287 electrochemical analyzer combined with a Solartron 1255B frequency interface and Zview 3.0 software. The instrument used in potentiostatic mode with amplitude 40mV over a frequency range from 0.1 Hz to 100,000Hz, covered with 10 points per decade. Nyquist plot in our impedance measurement exhibited a typical semi-circle behavior. The left point of intersection with x axis corresponds to ohmic resistance.
3. RESULTS AND DISCUSSION
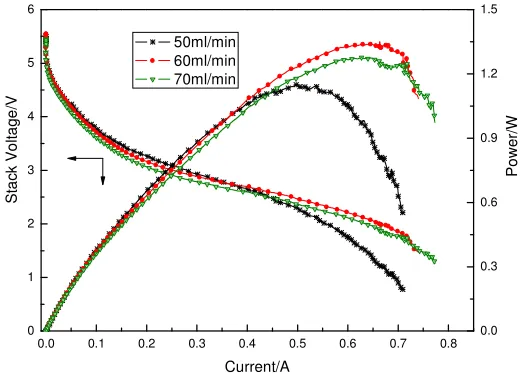
Fig. 5 shows the linear polarization curve of the stack at a different hydrogen flow rates of 50, 60 and 70ml/min respectively (scan rate: = 0.005A/s). It can be seen that the shape of stack voltage versus current curve is similar as compared with the other PEMFC stack. Usually, the curve is divided into three segments by its different voltage drop rates, which correspond to the different electrochemical processes [17]. The initial drop of the polarization curve at a very low current was due to the electrochemical activation process, which was caused by the sluggish kinetics of oxygen reduction at the cathode. The subsequent linear decrease of the polarization curve was due to an ohmic loss which is attributed to the ion flow through the electrolyte membrane, the electron flow through the electrode materials, flow field plates and current collector. The last drop was due to a diffusive loss caused by mass transfer difficulty of reactants, oxygen in most cases. However, it also can be seen
0.0 0.1 0.2 0.3 0.4 0.5 0.6 0.7 0.8
0 1 2 3 4 5 6 0.0 0.3 0.6 0.9 1.2 1.5 S ta ck V ol ta ge /V Current/A 50ml/min 60ml/min 70ml/min P ow er /W
Figure 5. The linear polarization curve of the stack with different hydrogen flow rates under conditions: An/Ca = 0.3/0.5mg Pt/cm2, T
cell = 20±3 @ 50±3% RH, P = atmospheric, and
[image:6.612.191.451.471.658.2]from Fig. 5 that the stack’s performance had some discrepancy with different hydrogen flow rates. When current is less than 0.1A, the corresponding output power had little difference; but such is not the case with further current increase, that is, at the region of 0.45~0.73A, the difference became more obvious and bigger. This could be explained by the following two negative/positive factors combined that the inner pressure of the stack and the diffusive rate of fuel for reaction went up simultaneously with the flow rate increase. So as can be expected, the moderate flow rate of 60ml/min gave the highest output power of 1.34W. The peak power density of 335W/l can be calculated out based on the volume of the stack.
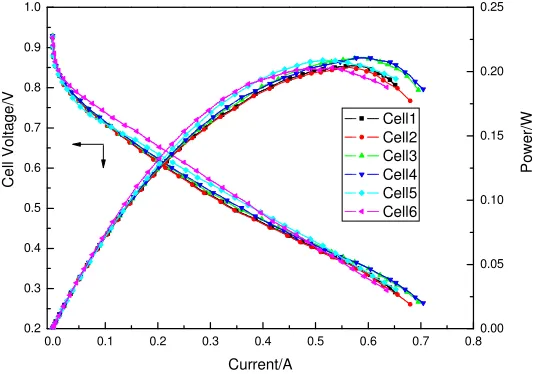
Figure 6. The linear polarization curve of the stack with different hydrogen flow rates under conditions: An/Ca = 0.3/0.5mg Pt/cm2, T
cell = 20±3 @ 50±3% RH, P = atmospheric, and
air-breathing for Cathode
[image:7.612.175.443.215.402.2]Fig. 6 shows the single cells’ performance under the same conditions of Fig. 5. It is evident that all the 6 cells had a similar performance which is attributed to the even fuel distribution among each cells benefiting from the novel structure design of the stack. Table 1 list out internal resistances and peak power density of the 6 cells. Also, it can be seen that they were even distributed.
Table 1. Internal resistance and peak power density of the single cells
Factor calculated value
Resistance, 0.5087 0.5100 0.4910 0.4995 0.5028 0.5123 Peak power
density, W/cm2 142.4 141.7 147.2 145.8 145.1 141.0
0.0 0.1 0.2 0.3 0.4 0.5 0.6 0.7 0.8
[image:7.612.102.508.612.701.2]Int. J. Electrochem. Sci., Vol. 2, 2007
625
Figure 7. The schematic diagram of fuel flow road in Z-type and full pin-type anode flow field plates (a) full pin-typed, (b) Z-typed
Performance improvement of the sack using the novel Z-type anode flow field plates was schematically shown in Fig. 7 (b). Compared with the full pin-type flow field of anode we previously designed (see Fig. 7 (a)), the novel type flow field can make fuel flow forcedly along Z-type road. This could mean that the fuel can reach the corner of the cells to the greatest extent, while the red circle marked place in Fig. 7 (a) probably not. Under the similar conditions of operation, the stack’s output peak power had about 49% enhancement when the novel Z-type anode flow field plates were used to assemble the stack. More even fuel distribution among each cell probably had the greatest contribution for the improvement. Further work is to confirm the consequence and investigate other detailed information such as heat and water management.
4. CONCLUSIONS
Design, fabrication and performance characterization of a miniature 6-cell PEMFC stack with volume of 4.0ml was presented. The stack based on MEMS technology had a novel structure. A novel type of Z-type anode flow field plates were applied to replace the full pin-type ones used previously and all the single cells were assembled in the same plane with a fuel buffer/distributor as their support. Operating on dry H2 and air-breathing conditionsat 20±3 and 50±3% RH, the stack produced the
peak power of 1.34W and the estimated maximum power density of the stack could reach 335W/L when the stack’s volume of 4.0ml was considered. Meanwhile, all the single cells in the stack performance well and even based on V-I and internal resistance measurement (EIS). The results suggested that the stack’s performance was greatly improved. The novel flow field leading to more even fuel distribution among each cell probably had the greatest contribution for the improvement.
ACKNOWLEDGEMENTS
The authors gratefully acknowledge financial support from the National ‘863’ High Technology program (No.2006AA04Z342), China.
References
[image:8.612.208.442.69.189.2]2. G..Q. Lu, C.Y. Wang, T.J. Yen, X. Zhang, Electrochimica Acta 49 (2004) 821.
3. S.C. Yao, X.D. Tang, C.C. Hsieh, Y. Alyousef, M. Vladimer, G.K. Fedder, H.Cristina, Energy 31 (2006) 636.
4. J. Yeom, R.S. Jayashree, C. Rastogi, M.A. Shannon, P.J.A. Kenis. J Power Sources 160 (2006)1058.
5. M. Shinji, M. Mohamed, M. Toshiyuki, S. Shuichi, O. Tetsuya. Electrochemistry Communications 6 (2004) 562.
6. H.L. Maynard, J.P. Meyers, J. Vac. Sci. Technol. B 20 (2002) 1287.
7. S. Tanaka, K.S. Chang, K.B. Min, D. Satoh, K. Yoshida, M. Esashi, Chemical Engineering J 101(2004) 143.
8. S.C. Kelley, G..A. Deluga, W.H. Smyrl. AICHE J. 48 (2002) 1071. 9. J.R. Yu, P. Cheng, Z.Q. Ma, B.L. Yi, J Power Sources 124 (2003) 40.
10. S.C. Kelley, G..A. Deluga, W.H. Smyrl. Electrochem. Solid State 3 (2000)407.
11. A. Heinzel, C. Hebling, M. Müller, M. Zedda, C. Müller, J Power Sources 105 (2002) 250. 12. T. Kim, S. Kwon, Chemical Engineering J 123 (2006) 93.
13. J.D. Holladay, E.O. Jones, M. Phelps, J.L. Hu, J Power Sources 108 (2002) 21.
14. S.J. Lee, A. Chang-Chien, S.W. Cha, R. O' Hayre, Y.I. Park, Y. Saito, F.B. Prinz, J Power Sources 112 (2002)410.
15. J.R. Yu, P. Cheng, Z.Q. Ma, B.L. Yi, Electrochimica Acta 48 (2003) 1537. 16. R. Hahn, S. Wagner, A. Schmitz, H. Reichl, J Power Sources 131 (2004)73.
17. J. Larminie and A. Dicks, Fuel Cell System Explained, 2nd ed. New York, Wiley, 2002.