International Journal of Innovative Technology and Exploring Engineering (IJITEE) ISSN: 2278-3075, Volume-8 Issue-12, October, 2019
Abstract—Currently the Biggest threat to environment and public health is Air Pollution which is caused by emissions of hydrocarbons, nitrogen oxides, carbon oxides and sulphur oxides by burning of fossil fuels. In recent years consumption of fossil fuels by various factories has rapidly increased that has let for the search of alternative fuels. These fuels are also known as non-conventional fuels which can be used as a substitute for conventional fuels Algae oil is one of the promising potential sources of bio-fuels generated from microbes. It is generally preferred because it is sustainable and environment-friendly oil which have numerous advantages. So the algae oil has used for performance and emission test on a diesel engine. The blends have been made for testing B5, B10. In which 5% of methanol has mixed and others are raw algae oil (5% for B5 and 10% for B10) and Diesel (90% for B5 and 85% for B10). The Kirlosker Engine with 6.97 HP (5.2KW)@1500rpm is used for Performance analyzing. Parallels AVL emission analyzer and smoke detector were connected with the exhaust of the engine. All values of gases were displayed and compared.
Keyword- Biodiesel, algae oil, Methanol, performance and Emission Characteristics
I. INTRODUCTION
Now a days the demand of the fossil fuel is very high because the increase in the number of the vehicles. The research on the biodiesel as an alternative fuel is continuously increasing. Biodiesel is one of the renewable fuels and it emits very less amount of carbon dioxide (CO2)
and carbon monoxide (CO) and high amounts of nitrogen oxides (NOx). It can be effectively used in compression ignition engine. The biodiesels are from the animal’s fats and plants like algae, neem, soybean, safflower, jatrophacurcas, common flower, camelina sativa and its effect reduces in the exhaust emission system in CI engine. Biofuels are liquid fuels made from esters, alcohols, and other biomass chemicals.
II. PROCEDURE A. Algae oil extraction:
Algae naturally produced oil as away to store chemical energy. Small numbers of algae are then put into a tank with water and nutrients similar to those in thousands of fertilizers. Algae is then kept under the sunlight then it rapidly reproduces and undergoes photosynthesis, converting carbon dioxide into sugar into lipids or oil, cell
Revised Manuscript Received on August 05, 2019.
Mr.V.Kumar*Sr.G, Mechanical Engineering Department, SRM Institute of Science and Technology, Chennai, India.
(Email: [email protected])
Dr. ParthaSarathiChakraborty, Department of Adult, Continuing Education and Extension, Jadavpur University, Kolkata, India.
(Email:[email protected])
Dr.Dulal Krishna Mandal, Mechanical Engineering Department,
cavity fills with as much as six percent of its weight in oil. Some companies press the algae like olive, physically squeezing the oil out. Other companies compress the carbon dioxide which vaporizes the lipid until the press is lower and the oil condensed from the remaining cell. Then the oil is stored in isolated cylindrical metal bottles.
Table-I: Properties of extracted Algae oil
B. Preparation of blends:
The Viscosity of Algae Oil is too high to be mixed with diesel. The spark ignition won’t work with high viscous Blends. So to decrease high viscosity of algae oil, a catalyst has been used named as Methanol(CH3OH). The methanol
is highly flammable and it is having flash point of 120 C. The methanol is also having low viscosity which is around 0.6906 CST at 25.00C. And it’s never been used with Algae oil before for performance test. So four blend were prepared for the Viscosity test and flash and fire point test.
B5 = 100ml Algae oil and 5ml Methanol B10 = 100ml Algae oil and 10ml Methanol B15 = 100ml Algae oil and 15ml Methanol B20 = 100ml Algae oil and 20ml Methanol
All these blends are going to be tested for viscosity test and flash and fire point so that we can find out whether there properties get along with the CI engine.
The conditions are:
The flash and fire point should be under 900C and Viscosity should be less than 8 CentiStokes.
C. Viscosity Test:
For viscosity test Redwood and Say bolt viscometers used. The comparison has done between them with comparing a single blends curve. In final comparison result, Redwood is having more accurate values and curve than the Say bolt equipment. So other blends were calculated on Redwood equipment.
Performance and Emission Test on a CI Engine
By using Algae Oil as an Alternative Fuel
Table II: Say bolt reading
SAYBOLT B5
TEMPERATURE OF OIL
TIME KINEMATIC
VISCOSITY
DENSITY ABSOLUTE
VISCOSITY
0C. SEC. M2/Sec. Kg/Lit M2/Sec.
67 128 30.942 0.64 19.761
72 123 29.704 0.608 17.972
77 118 28.595 0.575 16.409
Figure 1: Saybolt Viscosity graph for blend B5 Table-III: Redwood B5 reading
Figure 2: Redwood viscosity graph for blend B5 Table IV: Redwood B10 reading
Figure 3: Redwood viscosity graph for blend B10
Table V:Redwood B15 reading
Figure 4: Redwood viscosity graph for blend B15
Table VI: Redwood B20 reading
Figure 5 Redwood viscosity graph for blend B20 The readings are not in accordance with the given viscosity condition . So the flash and fire point test was conducted for the blends to check the condition.
C. Flash and Fire Point Test:
The close cup apparatus has been used for flash point and fire point. Because it gives the minimum value of flash and fire point and works better then the Open cup apparatus. So, the results of the closed cup apparatus are:
Table VII: Flash, fire point Table VIII: Flash, fire
International Journal of Innovative Technology and Exploring Engineering (IJITEE) ISSN: 2278-3075, Volume-8 Issue-12, October, 2019
Even these flash and fire point readings were not in accordance with the expected conditions.
So the final ratio of algae oil, Methanol and Diesel should be less than 2:1:17.
D. Final Blends Preparation:
For the final blends the expected ratio should be under 2:1:17. So there are 2 types of blends:
5% Algae oil + 5% Methanol + 90% Diesel 10% Algae oil + 5% Methanol + 85% Diesel
The blend were prepared for performance and emission test. There are two types of blends with new names are there
Blend B5 = Algae oil 5% + Methanol 5% + Diesel 90% = A5M5D90
Blend B10 = Algae oil 10% + Methanol 5% + Diesel 85% = A10M5D85
Before making the blends, Properties were found for pure algae oil. Then the oil was mixed in a beaker with Methanol and diesel with above given ratios. Then the magnetic stirrer was done on the both blends and contained them in a isolated container.
For performance test the engine is selected as per the following properties:
Make: Kirloskar No. Of cylinders: 1 No. Of strokes: 4 Fuel type: diesel
Related Power: 6.97HP(5.2KW) @1500rpm
The blend B5 filled into the engine’s fuel tank and Engine’s all connections were checked including AVL Exhaust gases analyser and Smoke detector. The Engine started manually. The load was give gradually and output was taken as per the load. The same was done for B10 blend.
After putting each load on the engine, the pipe of AVL exhaust analyzer is tuck in the exhaust of engine and removes it after getting readings. Then smoke detectors pipe is tuck in for the total smoke in ppm value from the exhaust. All the values were directly calculated by the computer.
The final tables for blends are:
Table XI: Blend B5 performance Blend B5 Performance
LOAD(k
g) IP(KW) BP(KW) FP(KW)
0 4.61 -0.06 4.66
4 6.04 1.15 4.96
8 6.11 2.29 3.75
[image:3.595.294.563.45.462.2]16 7.06 4.39 2.67
Table XII: Blend B5 performance
Blend B5 Performance IThEf f (%) BThEf f (%) SFC
(kg/kWh) Mech
Eff (%)
VolE ff (%)
83.72 -1.05 0 -1.25 75.0
2
69.38 13.08 0.63 18.85 74.5
1
52.25 19.8 0.41 37.9 73.7
5
44.64 22.6 0.36 50.63 73.7
1
35.66 22.18 0.37 62.2 72.7
7
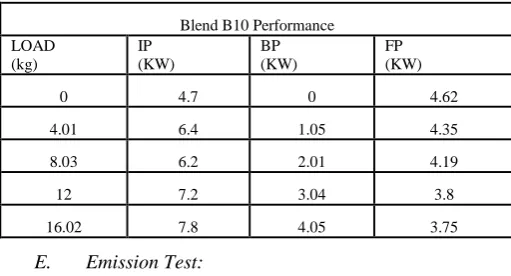
[image:3.595.64.285.50.196.2]Table XIII: Blend B10 performance
Table XIV: Blend B10 performance
Blend B10 Performance LOAD (kg) IP (KW) BP (KW) FP (KW)
0 4.7 0 4.62
4.01 6.4 1.05 4.35
8.03 6.2 2.01 4.19
12 7.2 3.04 3.8
16.02 7.8 4.05 3.75
E. Emission Test:
The exhaust gases passes through the AVL Exhaust analyzer and smoke detector. All gases are calculated in % and smoke is calculated in ppm. So the output has been tabulated:
Table XV: Emission for blend B5 Blend B10 Performance
IThEff (%)
BThEff (%)
SFC
(kg/kWh) MechEff (%)
VolEff (%)
[image:3.595.298.554.465.603.2]70.2 12.04 0.64 16.41 76.26
54.1 18.04 0.43 32.41 74.38
45.76 21.3 0.36 42.22 73.98
36.89 20.89 0.38 51.92 70.76
TABLE XVI: Emission For Blend B10
III. RESULT A. For performance:
After doing performance test and emission analysis of two blends, the comparison is done between both the blends and diesel. Here’s the result:
[image:4.595.49.288.45.335.2]In load vs Indicated power, brake power and frictional power, the garph shows the perfomance of Diesel and Blend B5 are similare or almost same but B10 is far from Diesel properties as compare to B5.The graphical comarison is given below
[image:4.595.333.530.51.172.2]Figure 6: Graph Load vs Indicater Power
Figure 7: Graph Load vs Brake power
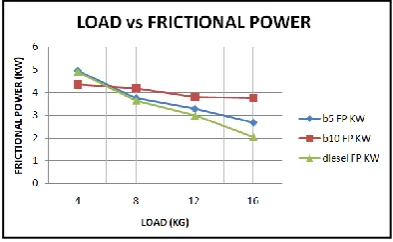
Figure 8: Graph Load vs Frictional Power In load vs Indicated thermal efficiency & Brake thermal efficiency, the garph shows the perfomance of Diesel and Blend B5 are similare or almost same but B10 is far from Diesel properties as compare to B5.The graphical comarison is given below:
[image:4.595.340.522.244.347.2]Figure 9: Graph Load vs Indicater Thermal Efficiency
[image:4.595.324.535.377.497.2]Figure 10: Graph Load vs Break Thermal Efficiency In load vs Spacific fuel consumption and mechanical efficiency, the garph shows the perfomance of Diesel and Blend B5 are similare or almost same but B10 is far from Diesel properties as compare to B5.The graphical comarison is given below
[image:4.595.66.284.439.562.2] [image:4.595.333.532.586.701.2]International Journal of Innovative Technology and Exploring Engineering (IJITEE) ISSN: 2278-3075, Volume-8 Issue-12, October, 2019
Figure 12: Graph Load vs Mechanical efficiency B. For emission:
[image:5.595.64.283.53.183.2]The exhaust output has been analysed between different blends and fuel with respect to single component or gas or output matter. In exhaust the B10 has the bad result and are not even close to diesel’s output results. But B5 has given a good output than compare to diesel. Carbon monoxide has given a quite similar for both diesel and B5. But the hydrocarbons are less for B5 than the diesel which is a positive output.
[image:5.595.316.547.60.292.2]Figure 13: Graph Load vs Carbon monoxide
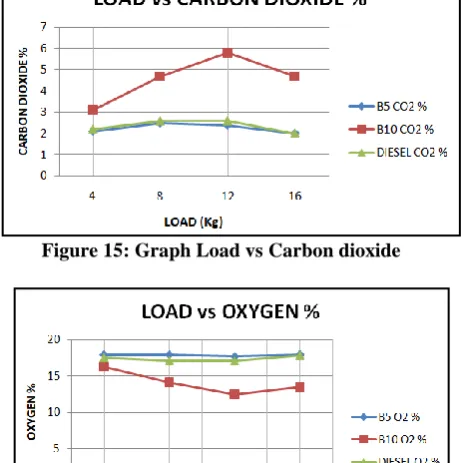
Figure 14: Graph Load vs Hydrocarbon The comparison between b5 and diesel for carbon dioxide is similar. But still B5 emits less carbon dioxide. The comparison between b5 and diesel for oxygen is similar. But still B5 emits more oxygen which is good for environment.
Figure 15: Graph Load vs Carbon dioxide
Figure 16: Graph Load vs Oxygen
[image:5.595.67.283.317.462.2]The result for NOx is totally different. Because Diesel has the lower emission of NOx, but B5 and B10 has similar and high emission of NOx.
Figure 17: Graph Load vs Nitrogen oxide
So for emission test, only NOx comparison failed. Others gases and matter are better in B5 then the diesel. B10 completely failed the test.
IV. CONCLUSION
[image:5.595.317.543.390.519.2] [image:5.595.73.276.485.607.2]In case of B10 blend, due to increase in the quantity of the algae oil, it caused a decline in performance index. Hence it can also be concluded the quantity of algae oil has to be just right, that is, it can neither be too high nor too low, for optimum performance and B5 blend proved to have the apt quantity of algae oil.
The catalyst used with both B5 and B10 blends was methanol. The use of a better catalyst in future may help in improving the performance of B10 blend, enabling us to use more and more organic algae oil instead of the non-renewable diesel.
REFERENCES
1. J. Kuberan, N. Alagumurthi, (2016) “Performance and
Emission Characteristics of Algae Bio-fuelled Diesel Engine”, Int J. Chem. Sci.: 14(4), 2973-2980, ISSN 0972-768X,
2. Ramón Piloto-Rodrígueza, Yisel Sánchez-Borrotoa,
Eliezer Ahmed Melo-Espinosaa, Sebastian Verhelstb, (2016) “Assessment of diesel engine performance when fueled with biodiesel from algae and microalgae”, 1364-0321, Elsevier Ltd.,
3. Panayiotis Tsaousisa, YaodongWanga, Anthony
P.Roskillya, Gary S. Caldwellb, (2014) “Algae to energy: Engine performance using raw algal oil”, The 6th
International Conference on Applied Energy –
ICAE2014
4. RachanKarmakar, KrishnenduKundu, Anita Rajor,
(2018) “Fuel properties and emission characteristics of biodiesel produced from unused algae grown in India”, Petroleum Science (2018) 15:385-395, Spriger
5. Jitesh Singh Patel, Naveen Kumar, Amar Deep,
Abhishek Sharma, Dhruv Gupta, (2014)"Evaluation of Emission Characteristics of Blend of Algae Oil Methyl Ester with Diesel in a Medium Capacity Diesel Engine," SAE Technical Paper 2014-01-1378, doi:10.4271/2014-01-1378
6. Ashokkumar A, Vishnu Padmanaban, and
ThirumaliniSubramaniam,(2013) “A Comparison of Fuel Properties Between Fractionated and Non-Fractionated Composition of Micro Algae Based Biodiesel”, 2013-01-2814, SAE International
7. G. Ospina, Mohamed Y.E. Selim, Salah A.B. Omari,
Mohamed I. Hassan Ali, Adel M.M. Hussien (2018), “Engine roughness and exhaust emissions of a diesel engine fuelled with three biofuels”, 0960-1481, Elsevier Ltd.,https://linkinghub.elsevier.com/retrieve/pii/S096014 8118311091
8. R. Velappan, S. Sivaprakasam, M. Kannan (2015),
“Study the Performance of Algae Oil in Diesel Engine with Various Injection Pressure”,International Research
Journal of Engineering and Technology(IRJET),
Volume: 02 Issue: 05
VI. AUTHORS PROFILE
Mr.V.Kumar, Assistant Professor, Mechanical Engineering Department at SRM Institute of Science and Technology has extensive research experience in bio-fuels and emission control sciences.
Dr.ParthaSarathiChakraborty, Professor, Department of Adult Continuing
Education & Extension at
JadavpurUniversity.
Dr.Dulal Krishna Mandal,, Department of Mechanical