ARCHIVES
Record Copy
VT.
16S.
NOISE IN DELTA MODULATION
by
F.R. D'Emden B.E.(Hons.)
Submitted in partial fulfilment of the
requirements for the degree of
Master of Engineering Science
University of Tasmania
Hobart
ACKNOWLEDGEMENTS
This work was carried out in the Electrical Engineering
Department of the University of Tasmania. The author wishes to
thank all members of the engineering staff and research students
with whom he was associated for their assistance and
encourage-ment. In particular the author wishes to thank Professor
C.H. Miller, Professor of Electrical Engineering, and Mr. P. Watt,
his supervisor, for their help and encouragement. The author also
thanks the Public Service Board for its financial assistance and .
Miss. C. Byard for her perseverance with the typing.
I hereby declare that, except as stated herein, this
thesis contains no material which has been accepted for the
award of any other degree or diploma in any University or College,
and that, to the best of my knowledge this thesis contians no copy
or paraphrase of material previously published or written by another
SUMMARY
An ivestigation of the noise which is an inherent part of delta modulation due to the nature of the modulation process is presented. A large part of the examination of the noise consists of an investigation of the noise performance of delta modulation. In order to limit unwanted paramenters, the study has been mainly confined to an ideal delta modulator with a perfect, single
integration feedback network. The investigation presented is restricted to the modulation - demodulation process in the main, with emphasis on voice communication usage. The feasability of a computer simuation of delta modulation and the design and
construction of an experimental modulator is presented. Analysis and comment on the qualitative and quantitative aspects of noise in delta modulation is included with reference to measurements taken,
19
19
suoTutaapTsuop u2Tsaa 2Tn3113 Z",
u032onp012oI T./
acne-
mow
ulTaa Tu3uawTaadxa lazdeqosTpsau aamod asTom
suoTutaapTsuop pazoads pus 29140d OSTON
ssauaAT33a;;a uovasinmTs suoT2e4Twri pus sulaiqoad - ausima2ola Jo watuqsTiqs4sa uoTl3npo13u1 mass uoT4sInpox s3Iaa aidulTs s ;o uopsimuTs aaandmoD
S'E
t
i
c
h'E
Z . E
T i E
E
aeuisq3• LE
sTsgsuv asToN paqsrminsa Jo AaTAauAastumns
sicz
Aouanbaaa 2uplooTO
OTH It
Jo 300JJaaqjh*E . Z
uopouna AzTsuaa AlTITqsqoaa aoaaa aqz Jo 33a;ga
rcz
uoTutiaaaop IsugTs aoaaa
;0
30a,JJaet
Z . E . Z
uoTzsaapTsuop IsT3Tui Ticz sTsgsuy asTom
9Z
as•om aql Jo aan3smSZ uoTzonpollui
8wa3sAs uoT4sInpoig ea a uT auaaaqui asToN Jo uoT4s2T4saitoI
TZ .sma3s4ts uoTzsinpok s2Taa
pompom 5 • 1
uoTleinpox
In -
pa JoS39
314
anbTuaNioAlaN xosqpaaa ummTldo
uo.pea2a4u1 avinou
uoT3sTnpom sTraa Jo sTstm aqy uoTwinpoki uoTleTnpow asina TelTSTa uoTzwinpom asind an2oIsuy uoTwinpoH aAsm snonuT2uoD
17.47°T
E . tei
VV -E
I . v . I
tmaaE'E'T
Z . E . I
I . E'T
hit •
sadity uoTlsinpow Jo uosTiedwoo uoTloInpokt Jo sadAy
soTzpripoalui
swe2sAs uoTwmpolg Is3TVTa Jo luamdoiaitaa aqy T aa2deqD
u0p3np0a3ui
sImalNoo
9E ;
a8ed
Page
4.3 Circuit Realization 62
4.3.1 Reversible Counter
4.3.2 Digital to Analogue Converter
4.4 Practical System Considerations 66
4.5 Noise Measurement 67
4.5.1 Method of Noise Measurement 4.5.2 Results
4.6 'Observation and Discussion of Results 69
4.6.1 Constant Clock Frequency 4.6.2 Constant Input Signal
Chapter
5 Conclusion5.1 Introduction 77
5.2 Theoretical Considerations of Slope Overload 77
5.3 A Comparison of Experimental and Computer.
Simulation Results 79
5.4 A Comparison of Measured Results with Established
Theory 81
• 5.5 The Value of a Sinusoid as a Test Signal 84
5.6 Conclusions on the Nature of the Noise 85
5.7 Optimum Operating Conditions 86'
Appendix A 88
Appendix B 90
Appendix C 93:
INTRODUCTION
In the current state of voice and video telecommunication the use of analogue methods for new communication channels is still
dominant. In particular, amplitude modulation, frequency modulation, and direct analogue transmission are most frequently used. With current trends in technology and service requirements, the use of digital
communication systems is showing itself to be preferable to analogue methods in many circumstances.
The most developed, and at present the preferred type of digital communication system is pulse code modulation (PCM) which is in commercial use in many technologically advanced countries. Digital modulation
systems have the advantages over analogue systems of: the capacity for regeneration with amplification (thus preventing the accumulation of noise over long routes); compatability with digital data transmission; use with time division multiplexing (TDM); and lower power consumption by virtue of the two state nature of the transmitted signal.
The other basic form of digital modulation, which uses a
simpler principle of operation, is delta modulation. By virtue of the quantization in time and amplitude of the signal to be modulated by a digital method, some information is discarded in the modulation process.
This gives rise to a type of noise intrinsic to the modulation process,
and it is an investigation of this type of noise for delta modulation which forms the basis of this thesis.
In the first chapter a brief review is made of continuous
carrier modulation and analogue pulse modulation, leading up to digital pulse modulation. This provides a basis for the introduction of delta modulation with discussion of its origin and operating principles. A review of the modifications, improvements and current state of develop-ment of delta modulation is contained and a comparison with pulse code . modulation is made.
The second chapter consists of an investigation into the nature and magnitude of the noise which is inherent in the delta modulation process for simple, non-companded systems. A review of existing noise analysis with investigation into the factors and definitions involved
. is made.
In the third chapter the establishment of a computer simulation (using an Elliott 503 computer) for a single perfect integration,
simple delta modulator is presented. The noise power results obtained from various simulations are discussed along with the factors
2
.The design, realization and performance of an experimental . delta modulator are described in the fourth chapter. Discussion of the method of noise measurement, the accuracy and repeatability of results and limitations of the circuitry is also included.
In the fifth chapter the experimental and computer simulation estimates of the performance of delta modulation are compared and any discrepancy is explained in terms of the different conditions applying to each. The results obtained from the measurements are discussed
and analysed relative to the expected performance and the
established theoretical descriptions. Where discrepancy between the various performance descriptions is observed it is explained in terms of either; the limitations of the theory, the lack of relevance of the conditions considered to the theory, or inaccuracies in the results due to limitations in the conditions under which the performance results were obtained.
It is shown in this thesis that no theoretical analysis yet
determined gives an accurate description of delta modulation performance
for all ranges of operating conditions. (ie. for a given set of system parameters; for a full range of input signal values and a representative range of expected input signal types). It has been demonstrated that the most accurate and useful description for a range of input loadings is that
of Abate17, which is empirically derived and gives estimates for the
non-overload performance which are close to the theory of O'Neal35 (derived
from van de Weg34).
It has been demonstrated in this thesis that simple delta modulation performance can be described by four regions of performance. These regions
are clearly distinguishable for sinusoidal inputs but the region of
part-ial slope overload is not readily distinguished from the slope overload region wherea broadband input signal is being considered. The performance region of partial slope overload is defined, analysed and confirmed by experimental and computer simulation results for a sinusoidal input. Previously this region of performance has only been referred to
descript-ively; as for example by O'Nea135: "as if the basic granular quantizing
noise has been supplemented by furthur noise, due to the onset of the slope overload condition." The performance region of minimum quantizing noise for high clock frequencies has also been described, analysed and
con-firmed by experimental and computer simulation results. Discussion of the noise power spectrum and its variation with the input signal loading is
included along with discussion of the effect of variation in the probability density function of both the error signal and the
3
.CHAPTER
THE DEVELOPMENT OF DIGITAL MODULATION SYSTEMS
1.1
Introduction
The era of electrical communication commenced in 1838 when Samuel Morse conveyed information over a distance using the variation of electrical parameters in an electrical transmission medium. This
first electrical communication system was the telegraph in which information., in the form of an input message was coded into pulses, using a binary code, which were converted to electrical pulses for transmission by wire to be dectected and decoded at the receiving end.
From this date the demand for electrical communication has soared due to the high speed of information transmission inherent in electrical communication. With the perfection of a transducer for the conversion of sound to a time varying electrical signal directly related to the sound, telephony for direct voice communication resulted. The discovery of the possibility of using electromagnetic radiation as the transmission medium led, with wireless telegraphy, to modulation. A high frequency carrier wave more suited to the transmission medium is modulated by the • systematic variation of the carrier in accordance with the input signal. Modulation must be performed in such a way that an acceptable approxi-mation to the input signal can be reconstituted at the receiving end.
Modulation has developed into a vital process in electrical communication systems because of various demands which are satisfied, and benefits which result from modulation. The. main benefits of
modulation result from the shift in the natural frequency range of the information to a much higher frequency. Among the benefits are:
Ease of electro magnetic radiation at higher frequencies. The allocation of different signals to different carrier frequencies. This allows many communication paths, each separable from the others, to use a common transmission medium. Thus a single channel with a wide bandwidth can be fully untilized by the simultaneous transmission of many narrow bandwidth signals.
Transmission at higher frequencies allows greater power
transmission and the facility to select the frequency of transmission most suited to available equipment and to the transmission medium.
4.
1.2 Types of Modulation
The various methods of modulationcan be divided into roughly three categories. Such division is useful in describing the basic principles of any type of modulation. However some commercial communication systems may contain characteristics of more than one , type of modulation.
Continuous Wave Modulation
Continuous wave or continuous carrier modulation has a sinu-soidal wave as the carrier. Some parameter of this Carrier is varied in a continuous fashion by the signal to be transmitted (i.e. the modulating signal). The frequency of the sine wave carrier must be
greater than the maximum signal frequency designed to be transmitted, and in general the carrier frequency is many times the maximum signal . frequency.
Amplitude modulation (AM) in which the amplitude of the carrier sinusoid is the continuously varied paramenter was the. first modulation •
method used. Amplitude modulation and various modifications of AM
remain the dominant methods of modulation in electrical communication.
The other parameters of a sinusoid carrier which can be varied as a function of modulating signal are the phase, which gives phase modulation (PM), and the time derivative of the phase or the
instant-aneous frequency, which gives frequency modulation (FM). Both these
continuous wave modulations are closely allied and are known as angle modulation.
Pulse Modulation
The carrier for pulse modulation is a train of periodic pulses. Some parameter of each pulse is varied by the modulating signal: Clearly • any pulse modulation system, since it transmits information only at the .
instant of the pulse, is a discrete or non-continuous system, For the transmission of non-continuous information the only requirement, would be that the pulse rate is matched' to the rate of information. The use of pulse modulation for a continuously time varying signal depends on the theory of sampling. By sampling at a rate of at least twice the maximum signal frequency (f m) all the information of the continuous. signal is contained in the samples.
As the pulse rate, is determined by the above considerations the parameters of . the pulse train carrier suitable for variation are the height, width or position of each pulse. This gives respectively, pulse amplitude modulation (PAM)., pulse width modulation (PWM) and
Input
Signal
LP
Filter
Quantizer
(q levels)
Sampler
Input
Signal
Channel
Alternative
Positions
[image:10.563.20.532.36.873.2]LP
Filter
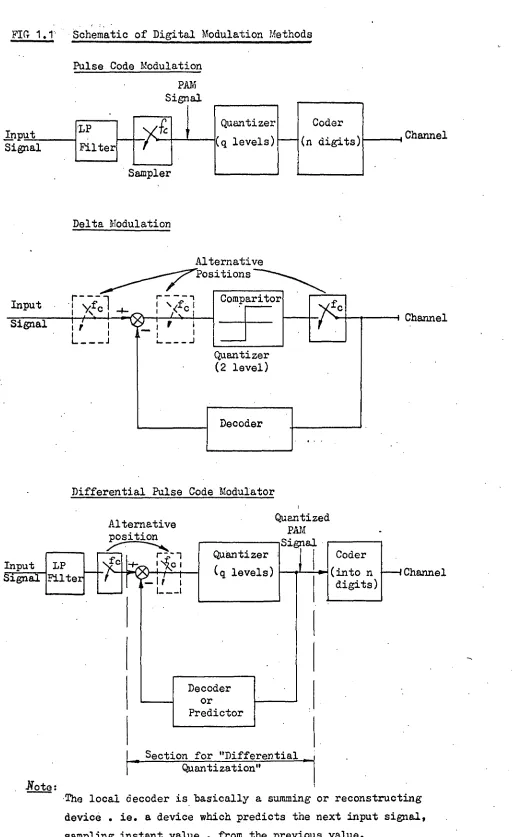
FIG 1.1' Schematic of Digital Modulation Methods
Pulse Code Modulation
PAM
Signal
Coder
n digits)
Channel
Delta Modulation
Differential Pulse Code Modulator
Input
Signal
Alternative
position
r
fc
1* 1
-
Quantizer
( q
levels)
Quantized
PAM
Signal
.r
Coder
into n
digits)
—.1 Channel
Decoder
or
Predictor
Note:
The local decoder is basically a summing or reconstructing
device . ie. a device which predicts the next input signal,
sampling instant value , from the previous value.
5
.of pulse modulation are analogue in nature in common with continuous wave modulation. This distinction can be made because the variable paramenter is being changed directly and continuously be the modulating. signal.
Digital Pulse Modulation
The feature of digital pulse modulation which makes it markedly different from the other modulation methods is that the periodic pulse train carrier has standard pulses. There is no variation of any pulse' parameter with the modulating signal. Instead the information is con-veyed by the pulses being assigned one of several states. In general digital pulse modulation systems are binary systems. Hence it is merely
the determination of the presence or absence of a pulse which conveys the information.
Because of the discrete nature of the information (either 1 or 0) contained in each pulse, the signal sample values must have discrete values. Thus quantization - the assignment to each sample value of a discrete value - is necessary. In addition, to convey the information of the quantized signal value to one or more pulses some coding is required.
Pulse code modulation (PCM) was the originally conceived method for the digital transmission of continuous time varying signals.
Although the concept of PCM was fully defined by A. H. Reeves in 1938
it was not until the last decade that the advances in semiconductor switching elements made PCM links feasable for commercial use. The process of modulation using PCM (see Fig. 1.1) consists of: sampling the analogue signal at the rate required for reconstruction, quantizing the sampled values, and finally coding the quantized amplitudes into a digital format using the standard binary code. For commercial telephony 128 quantizing levels are used that are exactly specified by a group of binary coded pulses.
It is interesting to note that the rapidly growing commercial use of PCM and digital data transmission represents a return to the method used in the original electrical communication - the telegraph. The major advances in electronics however, now permit automatic coding with far more efficient coding systems.
A modification of PCM is to code and transmit only the difference between successive signal sample amplitudes. This method is known as differential pulse code modulation (DPCM) (see Fig. 1.1). The concept of DPCM was defined in the early 1950's and resulted from attempts to increase the efficiency of the digital coding of analogue signals.
6
,value. With DPCM systems there is a feedback path around the quantizer. The feedback network makes a predication of the value of the incoming sample and this is subtracted from the sample value. The feedback network "predicts" by some form of decoding or reconstruction of the differential quantizer output. The simplest system is one which gives the previous sample value as the prediction for the next value.
A special case of DPCM results if the difference value is coded with a one bit cade. This results in each sample's value being represented by only one pulse in the pulse train carrier. The presence or absence
of each pulse indicates whether a unit increase or decrease in the reconstructed signal is the closest approximation to the input signal. Such a digital pulse modulation system with unity bit coding of the input sample differential is known as delta modulation (DM). (See Fig. 1.1).
Although delta modulation can be regarded as a special case of DPCM the method was proposed prior to the conception of DPCM. Due to the uniqueness of the unity bit code compared with a code of several digits, delta modulation has many characteristics which make it quite distinct from the other digital pulse modulation methods. A full discussion of the origin and concept of delta modulation is made in Section 1.4. Included is a comparison with PCM and DPCM which points out the fundamental differences and consequences of these differences regarding the practical realization of a digital communication system.
Before proceeding to a comparison of the basic modulation
methods it should be pointed out that some actual communication systems are to some degree a hybrid of methods. The most frequently used
comnination occurs in systems where some pulse modulation method is the initial and fundamental modulation. In such cases it is common in the
final stage, for the pulse train (either analogue or digital) to modulate
on R.F. or microwave carrier for transmission purposes. The use of this final stage of continuous wave modulation depends on the transmission medium and the distance involved.
1.3 A Comparison of Modulation Types
To compare methods of modulation with the intention of arriving at an optimum method for electrical communication is clearly a meaningless
• exercise. Due to the large variety of signals, transmission conditions,
distances, and quanlity requirements, the priorities of desired characteris-tics varies depending on the overall communication system under discussion. However in comparing the intrinsic advantages and disadvantages of any
7.
1. The quality of performance.
2. The average transmitted power.
3. Bandwidth required for transmission, B T .
4. Compatibility with equipment sharing techniques such as
multiplexing.
5. Suitability for use with repeaters on long distance or high
attenuation transmission paths.
6. Equipment expense factors such as complexity and quantity.
•
In discussing these factors, terms are defined which will be standard throughout the thesis:
The quality of performance of a communication system depends on a large number of factors many of which are difficult to analyse. However the commonly used measure of quality is the output signal-to-noise ratio (SNR) defined by:
S
0 = Ratio of average signal power to average noise
Clearly the output SNR gives no indication of many quality factors such as, the nature of the noise, or the susceptibility of the system to signal distortion or interference. For example, it may be stated that where the noise is basically random white noise uncorrelated to the
signal,then acceptable output SNR's for speech are 30 dB or greater. However some particular system or modulation method may give rise to noise whose nature makes a 30 dB SNR totally unacceptable due to the unpleasant sounding nature of the noise. Where such factors are of
significance in the comparison of modulation methods they are mentioned separately. In order to make the output SNR a suitable measure of the noise performance inherent .with the basic method of modulation alone, it
is frequently expressed in terms of the input SNR defined by;
S
in
Ratio of the average signal power to averageN
in noise power at the input to the detector (or
decoder).
A more objective measure would take into account the proportion of the average transmitted power, P T , at the detector input which is contributed by the noise power, S in . If a system has a significant part of the total
transmitted power, P T , accounted for by, say, a non-information carrying
carrier, then the output SNR is reduced compared to a system which devotes
\all of PT to the signal power, S in . For this reason it is often more
meaningful to express the output SNR in terms of Por where relevent T/Ni n
to indicate what proportion of PT is accounted for by S in . Perhaps the
best measure of relative performance of any modulation method, and*the one which'is used most frequently throughout this thesis, is the output
SNR in terms of Z (see Carlson2) where Z is defined by;
power at the receiver output.
Modulation Method
Transmission
Bandwidth, BT
1/20
0)
typically FelarksBaseband fM (2) •
5
(3).
.
Nin Z
A
m
pli
t
ud
e
M
od
ul
ati
on
DSB
•
•
2f
---- - - .
2(Vz
Z/5--t.P-;;Ziity,atbeati;.5dBAoeiow,-,Z-,•.,.:
.-..a'
hreshold,. -,,.ef-fect:.forf2?‹'4atoitt'''T3dB.il
DSB-SC
2'
men
- Z.
Requires synchronous detection._
S-
SSB fin _
.
.
A
n
gl
e
M
od
ul
ati
on
N BFM D41 ,== 2m
3
2an
2 D Z 2in 2 Very much below Z
Threshold for l'<about 13dB. effect
V--
.xn B equivalent to Z <20 TI
WBFM D>>1,==2fd=2Dfm 3D3
4n,4
-
D2Zilin 4 For D =
5,
16dB above Z. m
Capacity for Sok/ improvement using de-emphasis, typiSally 12dB.
PM • 200d + 1)fM
.
1,A 2
vp
d
Z
at best 7dB above Z, typically Z forOd<Th have NBPM which is very similarto AM.
A
nal
o
gu
e P
ul
se
M
od
ul
ati
on
PAM
>fin >N5
4-
in
11
<
z Highly suitablefor TDM in which case BT =nfm where n = no. of signals multiplexed.PPM
Es
1 1 Bi.<1z,..t
r.,
. .._..
of.ths.order-of10dB-lower ---than (S0/40) max
-
.-EXhibita'WidebandnOiee .
i.ediiOtiOn-PrOiei4iee.
•
m
inFRI BT. _ ' <
!1. B.rp
2
Si
n <
1
BT z4
c TT' ''.'
4
7;
_
•
PCM typically 7fM
Pc
for speech
2
2 .22P
•==
2 22(t)2
for
p
'=, ,
7
Soik
o •
= 44dB
- -
Threshold effect for Sin/N in<about 15dB.
i.e. Z.00 BT/
fth
.
30p ,-
Notes:
(1) these expressions are assuming a mean square signal value of
-I-
the amplitude squared , ie. they are based on a sinusoidal signal.(2) fm = max. signal frequency and the signal bandwidth. (5) fd = max. frequency deviation.
(3) Z
= OutputSNR of
basebandtransmission under the same transmission conditions..(6)
D = deviation ratio=-
f
rd.
-
(4)- m-=-modulation ratio = max. modulating -signal- amplitude A- a- / carrier amplitude (7)Od = phase modulation indexKin
i
so
n
of
V
ari
ou
s M
od
ul
ati
on M
et
h
od
8
.■ Output SNR of baseband transmission under the same
transmission conditions.
Hence, Ratio of transmitted power to noise power in the
message bandwidth.
P
T Where the noise is assumed to be additive
— white noise of density
11
w
and W ■ message bandwidth.The performance figures in terms of Z are in terms of the channel quality taking into account both the transmission power and the noisy-ness of the channel and receiving equipment.
The bandwidth of frequencies required in the transmission channel by a particular system for the. transmission of One signal is'Called , tbe
• transmission bandwidth and is, denoted by B T . This factor becomes
particularly significant when it is desired to transmit many Individual signals over a common limitect bandwidth transmission facility. The common usage of a transmission channel is achieved by using either frequency division multiplexing (FDM) or time division multiplexing
4
(TDM) 2, . TDM has two significant advantages over FDM, namely siinpler
. ,
circuit implementation and relative immunity to interchannel interference r .
or crosstalk. Any pulse mod4lation system (digital or analogue):can be multiplexed with TDM, whereas FDM is only suitable for use withl': continuous wave modulation.- 1Where multiplexing is desired (as in long distance telephone communication) the multiplexing method suitable to a particular method of modulation must be considered in any comparison of modulations.
In selecting modulatien methods to be Used in realizin0
communication link there.areConttraints other than those mentioned already which are not related to the fundamental nature of tbe:method of modulation. For example a new system, although apparently'superior for some particular communication task to the currently used
may well be slow in being implemented due to the well established technology of the existing system. Also the compatibility (4i2 new system to the.existing.facilities may impede its utilization, ,,However' such constraints will not be taken into account in this thesis in the discussion of any modulation system.
1.3.1 Continuous Wave Modulation
; 2,3
Conventional analysis . gives estimates of the output SNR for c-w modulation methods as shown in Fig. 1.2 along with other relevant characteristics. •Such , analyais is based on the reasonable assumption that the dominant signal contamination occurs in the channel:and - early receiver stages and results from white noise, which is independent of •
the signal. The limitation of the output SNR of AM-, DSB modulation
4-0
/0 20 30
430
[image:16.563.29.551.49.853.2]34.
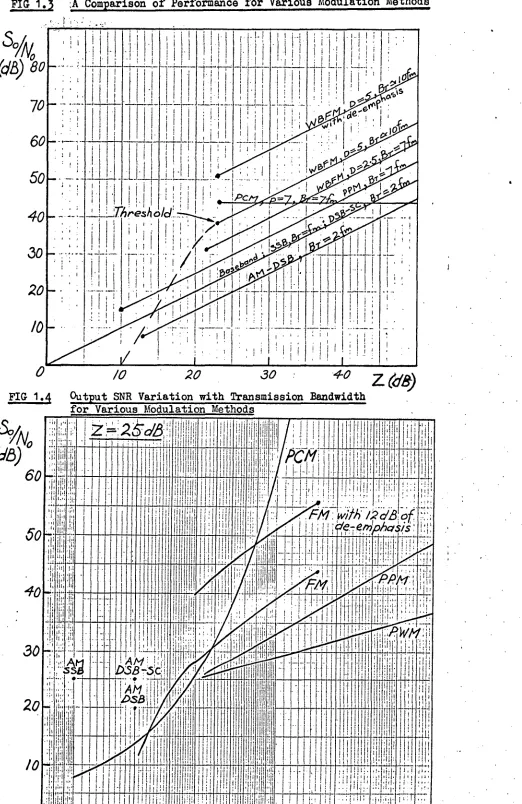
.FIG 10 A
Comparison of Performance for Various Modulation Methods
Output
SNR Variation with Transmission Bandwidth
for Various Modulation Methods
FIG 1.4
Z Ca)
, ,I:
.
.II,
:;• •
11,1
! ' I I
I " 1 • l'• I I
II
'1
1 . 1 i,1
If
I
11-11-1
11
'
. It il,
„;1„
.
.11,1
IIIy1 ..
I.,1 . ,111111111
!In
111
1111111
1
I
1
1:11
1
1
1
:IIHP:
d!i'''
11011 i- i
1, •WIli 1
1
I
!
l
ilt
Illil 1
i : :Hl,
.
I j
i'
1;11
1
.11.1
I•11q ,
1 ,
11 .
,,..
1,1
1
1;11 .1 I Ii ! I ii
;.;.i., ; Id i . 1 . ,„1 , i
. , I., ; I.; ; • .
wt.:, . !,1,1 ! ,.. ...—
.
....I. :1. ;, ,....•
i• • ...
1 ,
I !, 1
11,
• 1 1 i1 ' 'II
. AT-e-rn'
, .
e
.
0
Wi,
.!,,. ,,, , 0.
III
,,
1
IIII
, ,
, ti ,,
I 1
Iii
I 1
.
if
I ,
"
1.
II
Hil
-,
•
• i;H
: .:
-
, ,
,I•
,I,;11;
•....! .
-1
4,.;-
111111111
1
1
' ;
• ::
il
l
1 ! 1 ! : :
1 I : - : !!0. !!!!!
::
110.: .1!, •!!: •!!! II 1 : i
—
i 1 _ - i !
III
1).54 B 7-5Ic • ,• 1 1 ; 1 ' - _•• - 1 ; , 1 .•; i :1; • • • I II;'
,•
..,....,
;.,
id
dp
."
i , •
.. •
• I_
1
---.! AN ' DsBil;'.
-
1
-
r
-L
lill ,1
!
11
111110
1i
•
•'
•:1_,...
'II
I'
:::
• 'i
I1
1 1
1
1 1
1 1,
1
.
11 ;
•
- • - i ;i 1 'd ; ', Hi; III , , •
•
,
i 1,li HI;
1
1
11
;it.
ttl:
1 i
i'l0H
• •
1
;
..t
1
,
1
...
1
. : it:
,J, .4;.Li.p.:1, i IN
II. it
:
. :.
4•I .
.
1
:I
.1
. k. 1,1 .0..,M.44 • 1 11 .4 1
ti'P' i
,
'•
.
11 ;
11
-11
1
:
..• It:" ' •
i 1.
.11
1 ;
i
.1
10 .1
9. •
m2
transmitted power (S 24m 2 PT )• As full modulation cannot be
maintained in general (i.e. m<1), over 2/3 of the transmitted power will be wasted in the non-information bearing carrier. This, combined with the transmission bandwidth required, makes the performance of AM-DSB compare poorly with SSB modulation. However, the suppressed carrier of SSB or DSB-SC makes the receiver circuitry considerably more complex and thus DSB is used in broadcasting where many receivers of a single channel are involved. The noise performance of SSB degenerates considerably
where signal discontinuities are significant and thus DSB or DSB-SC are
used for the continuous wave modulation of pulse signals.
Narrow band FM shows no basic improvements over AM but wide band FM has the valuable characteristic, which is frequently required,
Of wideband noise reduction.
Fig. 1.2 shows the potential WBFM has for large increases in the output SNR relative to baseband transmission. This is achieved at the expense of a greatly increased channel bandwidth requirement. Wide- band noise reduction with phase modulation (PM) is not possible as the
phase modulation index O d is constrained to be less than nr. Thus PM
compares poorly with AM for analogue signals but finds its use in digital pulse train modulation of h.f. carriers (i.e. Phase shift keying or PSK). where it strongly resembles DSB-SC amplitude modulation by digital signals
(i.e. amplitude shift keying or ASK). FM is also highly suited to deem-phasis filtering by which, typically, an extra 12dB of output SNR can be
obtained without any increase in the required transmission bandwidth.
Indefinite output SNR improvement for WBFM cannot be achieved by
increasing D,(and hence B T ) as a point will be reached where the increased
input noise Nip, due to increabing BT, starts to cause severe signal
distortion. Therefore WBFM suffers from a threshold effect which severely
limits the output SNR for Sin /Nin of about 13dB or lower (see Fig. 1.3).
This represents a channel capacity limit corresponding to Z about 20
B
T/f •
Clearly
this also puts a limit on increasing the transmissionbandwidth in favour, of reduced transmission power,or the use of extremely noisy transmission paths.
1.3.2. Analogue pulse Modulation
The benefits of PAM result from its suitability to TDM and it there. by inherits the advantages of TDM over FDM. In fact PAM and also PPM and PWM would almost invariably be used with TDM to give multi-channel use of a single transmission path. The bandwidth and noise performance of PAM are in general inferior to AM but they can tend towards baseband perform-ance.
10.
Fig. 1.2 illustrates the good wideband noise reduction of PPM, with the output SNR increasing with B
T at the same rate as for WBFM (i.e.
So/NocK BT2 ). The maximum output SNR for PPM falls about 8dB below
WBFM for the same conditions. However a practical PPM system could be
of the order of 18 dB below WBFM in noise performance. PWM shows wide-band noise reduction which is poor compared to FM or PPM. A threshold effect similar to that experienced by FM occurs with PPM and PWM. With the pulse modulations the threshold results from noise peaks which give false pulses if the transmission bandwidth, and hence the noise power., exceeds a threshold level.
As well as its noise reduction property, PPM along with the other analogue pulse modulations has the advantage of having the potential to use an on-off transmitted signal, which gives rise to greater transmitter efficiency.
If, in the final stage of an analogue pulse modulation system, c-w modulation of a high frequency carrier is performed (e.g. ASK or PSK) for transmission purposes, then the transmission bandwidth required
(as shown in Fig.1.2) is in general doubled or more than doubled. (The only exception is where a multisignal PAM-TDM pulse train is low pass filtered and transmitted as an analogue signal using AM-SSB.) Overall, analogue pulse modulation systems do not compare favourably with c-w modulation from either the bandwidth or noise performance viewpoints. Their use depends heavily on the desirability of their special merits mentioned previously. The superiority of TDM over FDM however would have guaranteed PAM and PPM a major role in long distance, multi-signal, point to point telephony had not their use been short-circuited by PCM.
1.3.3. Digital Pulse Modulation
The nature of the noise and the noise performance of digital systems is unique, due to the basically different nature of information coding as discussed in Section 1.2. Sampling of a band limited signal involves no contribution to noise but the amplitude quantization of a sampled signal does introduce an error or noise function. This noise results from the loss of information when each sampled value is restricted to take on a discrete value and is known as the quantization noise. In
digital systems no attempt is made to transmit the exact signal, but a
coded pulse train carries the information of an approximation to the signal, namely the quantized signal. This gives digital systems
11.
1. The transmitted signal consists of constant size, periodic
pulses, the presence or absence of each pulse being. the only. information required of the transmitter carrier. Thus, provided the noise power is below some threshold level, so that virtually no pulses are lost or false . • pulses added, there will be no significant loss of information at the
re-ceiver and hence no random-channel noise at the output.
2. The digital pulse train can be detected and regenerated with
the rejection of all accumulated noise and distortion at repeater stations. This is a unique advantage over analogue modulation methods,'where tbe sig-nal connot be distinguished from the sigsig-nal plus noise and thus repeaters amplify both signal and noise, as well as introducing some further
distortion.
3. Whereas the noise performance of analogue systems is limited
by -random noise in the channel and by distortion, the noise :performance of digital systems is virtually completely determined by the, error that results from quantization. Furthermore,. provided the channel SNR is above the threshold value, the quantization noise is determined totally by the spacing of the quantizing levels. By spacing the quantizing
levels as closely as desired, (with a corresponding increase in the number of quantizing levels), the output SNR can be made as high alVdesired. As the quantizing level spacingtis reduced, and hence the output . SNR is increased, there is an increase in the transmission bandwidth required. This- indicates that digital eystems exhibit wideband noise reduction as will be shown later.
As well as their special advantages, digital pulse systems share the advantages of analogue pulse modulation of being suitable for use with TDM and having an on-off transmission signal. In addition, digital modulation systems, having dominantly digital hardware are highly suited
to large scale IC realization, and are to a large degree, compatible with digital data transmission.
Pulse code modulation, having a binary code, has the number of quan tizing levels (q) related to the number of pulses (or digits),. required to
uniquely specify each level (p), by q 2. The transmission bandwidth
required as shown in Fig. 1.2 is based on that required for -the resolution
of non-return-to-zero (NRZ) tor full width pulses. If half width pulses were used in order to facilitate simpler clock synchronization at the receiver, then the required transmission bandwidth would be Aoubled.
The, analysis leading to the output SNR expressions for. PCM, as
'shown in Fig. .1.2, will be Considered in more detail than the previously
discussed systems because of its significance in later discussion of
6
a
0
rl
N O to 1-
N
Cl) Ft 0" 03 03 7c" F?
Pt
M 103 p.310
I-•
C'03 ••••.
CI)
1-4 0
9sT ou u oT vszT zuvn h
A3
TSUO
P AZT
ITCL E gO ld Aq apuTs 'uag l lim bo g 3Tm re aTs V AO; °A/Iti TiT m
rt 0 Ft rt P. 0 0) 0. 0 1.‘
P2100 Pi O
0
O
Pt, Ft %.4 P. P. 00 0 03 1••• 0 1-‘ 0 00
0 Pei Ft ID
A 0-3 CD
all owab le signal value t o the rms si gnal val ue .
pe ak f act o r ,/3 , of any signal is
ant e.% m nmTxu m
8 ol 'mal sAs
HDc
I
uaas aq u
s, Tr 9 211 2T; EIT IO smog s
c'T
*2
TA
Th e input si gnal , f ( t) , will b e consid ered t o b e limi t ed by the
quantiz ation error value a s b elow :
maximum er ror of any sample i s th/2 . The re ceived quanti zed sample
value s can be re gard ed a s the s um of the sampled si gnal val ue plus the
that for unif orml y s pa ced quanti zing l evel s wi th s pa cin g h , then th e
wallas I4Dd PaP 03 3T
2TP 'WT) 4 4£. (9=a) .
shows for a signal whi ch i s not unif ormly d i st rib ut ed
i s a good approximati on , provid ed h is s uff i cientl y smal l .
W
A 03CO0.
CA Pt Psi Pri
=
•-3
Ft CA .0
N
. 0 B c 0 n 0300 M 0" Z 0" "•••• 0 el Pi 0 CD 7:I•0 '0ID C Ft
Z cm n ID re Pt p• o o CD 0303 CD 0 0302 0' 03 P. •• C 0)
CO. P4 0
03 03 re 0PC 00 t 4 C
I 0-..
1-6 H.
NI
Pll
*
0 P a Ft P
a '
00 0
=
Z
00 00 P.O
f%) C 0 0
olo t5 n c:) A 4 . ID P.310 0303 P. 1 P . CD C 0 0
.
1-, 0
co I Ft ID re 0.4 co n ID • pa. p- 0 P..)
CC I-4 C0.0
m C a
cm CDI lO Ft Cw 00w 4 C
0) e•- 03
0 I-a 9 n rt 0 ID P. rt 1-4 I 03 '4 O
0' 0 0
0 0' I-, 1 p O 0) 1•• ■ ri co Cc• ---
M 003 P.
0
C
.0 0
0
0 COB
1'
4
O
e-4 c m 0 m 0
I-1.
I-1
...tb
>41„)
CD
44 1 9 t.' X 00 • "
•0
ID
Ft 03 P.
V
9
14
.0
1-4 HI 1-4
Pt 00 t.4 0 O M 0 00 HI 101 ts3 's:f et /..) Ft Do. O 03
rt 003 11
C . 0 0
P- M Pil • 1. 4 1-, co n C PI co
co g ni
1
CD ID
'4 0
0 •-. I-•
0' Pi 0 . t, A) 0 Cl) 0 0 0.03 T/ l'•• ID 0
X I •
0 O 14 - • 0 CD O
0 si-N 0
e•• 1 M 0 Pt ID CD 03
cr 0 to z 0' 0 ni P.)'
.0
I.,
i..) 1 > P.)
03
ts.) >I
cr n i•••
o ID Pi M 0
1-4 ‘.<
PI >I 03 Mo N-NP I 14 . .... ft 0 FA. 0 N.) c i-4 03 “ 0. O
Pt A 0
Pa- 0 •-• CD 14 O 'AN 1-4 Ft'0 ei 0. n
. s Pt
to < P1(0 O 0 ,--1 0 P ■ -▪ ‘ CD 0 Pi re I B ....• pi
0 Ca. re
9 K H- 0 M ' ID th ' 1 1 . '4 •
4 CO
M M s . 1 4 . . • -... .11 M
B N1 Ia. O
Ft
V • 0
9 CD 0
00
0
rt . 4
t-•
'V 0 0.
0
COO D. ID
re re - C) 4 Pt H. PC I+ C ' lb VI 1.‘ I 1 M 0 a 0. P. 00 0 A
0 Ft rt
ID rts P. 0 0 Co CD Pi C A IA. 9 FA. 0 P-4 - 9 0 • m Ph is. 4 Phto cr 9 n ID c P. 03 rr ts) A A • CO P1 re P1 re fi X P.
0 H. t.3
C
'
eo
...,.. o m
CO D- O (0 030. * 0 0 I Ft CO C a. to re I-4 0 C rt 0
•-. C X
•0 0 C Pa.
=' 4 cn 1,.3 p• 1 4 "... C '10 Ft CD ft) 0 '0 • Ft .0 rt 0 P. 0 0 ri"• ■ •.
f to P
. .. Ft • to s tb co O Z . Ft Pk ■ ••• DI t%) V 03 D'' CO 03 H. "0P. CD
a' M .
00 C.P1 00
I I 0 M O 0 Ft m •i <A .0 0303030.03 W CC.3
lD 7' 0
C 1-1CO i•-■ ... 0) AI 03 ID Oto
Co I-A N
0 Pa
1-• cr 01-1.w
00 1-4 CD 0 O. N M 4 P•ti I t■ -) t-, 0 O .0 Pi . lb
13.
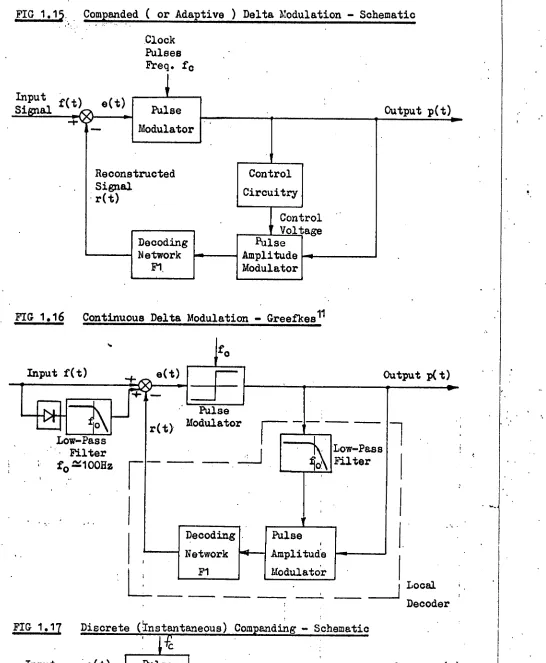
employed. Such companding, designed to give a signal with as cloie to uniform distribution over the full input range as possible; is easier to implement than a PCM system with the quantizing level spacing adjusted to
match the signal characteristics. With companding the value of/3 2 ■ 3 can
be approached for typical signals and so the estimate of the Output SNR is given as S
o /No
■ 22p However, to keep a uniform basis for comparison
with other systems the slightly higher estimate obtained with a sinusoidal signal of full amplitude is 'given in Fig. 1.2.
The minimum channel Or input SNR before bit errors become'
2 •
significant is the threshold level and is estimated 1, at: (S /N )
in. in
Threshold ■ 30 (15dB). Thiscorresponds to Z
th ■ 30 BT m / f ■ 30p.
It is significant to;bear in mind that for a typical.cOmmercial
PCM system for telephony with.a 7 digit . code (pal) the companding is such
that it reduces the output SOR from 44 dB as estimated by the equation of .
Fig. 1.2 to about 32 dB. The companding is designed, however, to give a large dynamic range , of input signals of about 35 dB.
The noise performance analysis for PCM indicates that in addition to the advantages of digitalpulse modulation discussed earlier, PCM
exhibits a more powerful wideband noise reduction than the other, modulation methods (refer Fig. 1.4), with an exponential increase in output for
increasing transmission bandwidth. PCM, in common with all Cligital, . systems shows no output SNR improvement with improving channel conditions
once threshold has been reached. Operating just above the threshold,.
Fig. 1.3 indicates that for typical speech transmission requirements, and for comparable transmission bandwidth requirements, PM is considerably superior to the best analogue pulse modulation (PPM) and is only Inferior to FM with deemphasis.
. Because of all the factors mentioned, and in particular because of its capacity for noiseless regeneration and use with TDM; and because the quite complex quantizing and coding equipment can be shared by all the multiplexed signals; PCM Is rapidly growing in use for long-distance telephone transmission.
• - 7
Differential' pulse code modulation (DPCM) has been shown 6, to
be capable of output SNR improvement if the normalised correlation between
adjacent samples is greater than about 0.5.McDonald7 estimates that for
speech . signal transmission, DPCM' Can give from 6 to 10 dB . increase in the output.SNR relative to PCM for the same conditions. Alternatively
DPCM can give performance on a par with commercial PCM with a 6 digit instead.of the 7 digit code group for PCM thus giving a reduction in the transmitted pulse rate from 56 to 48 kHz. However' DPCM suffers from a severe%equipment problem whenuse With TDM is required; as it. frequently
Modulator
Demodulator
r(t)
Output
p(t)
p(t)
Low Pass
Filter
p(t)
•
FIG 1.6 Schematic of Basic Delta Modulation System,
Modulator or Coder
Transmitted
Digital Signal
p(t)
Input
.Error'
Signal
Signal
f(t)
•e(t)
Idd
Two level
Ouantizer
Reconstructea
Signal
Linear
Network.
Fl
Sampler
fc
Local decoder
Demodulator or Decoder .
Received
Signal
Pulse
Regeneration
Linear
Network
Output,
Low Pass
.
Filter
FIG 1.7 .Single. Integration Delta Modulation
14.
• requires consecutive samples to be from the same signal. Therefore the
method of sampling and multiplexing many signals prior to their input'
into a common quantizer/coder as is done with PCM is not so readily 'available to DPCM.
Some further discussion of this problem as it relates to delta modulation is included in Section 1.4.
1.4 Delta Modulation.
1.4.1 The Basis of Delta Modulation
The concept of delta modulation (DM) as a method for converting analogue signals into digital form was first noted in a French patent in
9
1949 and was fully described by Schouten, 8 and Jager and Greefkes 8, in
1952. The basic method is to code into a one-bit digital code the differenc between the input signal to be transmitted, f(t), and a "predicted" or
reconstructed signal, r(t) (See Fig. 1.6). The reconstructed signal is
obtained by passing the modulated pulse train through a linear network (F1). Reconstruction of the signal at the receiving end is achieved by pulse regeneration, (the first step for signal recovery in all digital modulation systems) followed by a linear network, generally the same as Fl;
and finally low pass filtering to remove noise components outside, the
signal bandwidth. Thus the feedback path in the delta modulator can be ,
regarded as a local decoder. '
Coding of the difference or error signal, e(t), into ,
a
one digit- code is achieved using a two-level quantizer and a periodic sampler
(or pulse modulator). If the quantizer output is high at a sampling
instant, indicating that e(t) .; is positive, then a pulse (or binary one).
is transmitted and r(t) increases in an attempt to form a better . approximation or prediction fe the input signal. Likewise if the •
quantizer output is low, a binary zero (no pulse or a negatiVe . pulse) is transmitted and r(t) is decreased. By virtue of the binary nature of the
quantizer, the sampling could alternatively be performed directly before •
the quantizer,Without altering the system's performance. The - only values which affect the output are those at the clocking instants.
The most basic and first delta system , considered, used an integrato in the feedback path with disCrete narrow pulses for the output digital signal. Fig. 1.7 shows the system and the wave-forms that result. assuming perfect integration And ideal impulses. The receiver output
is the dame as r(t) after low pass filtering and the output noise Signal
FIG 1.8 Waveforms of the Input and Output with a Double
Integration Feedback Network
Maximum slope change of r(t) hf
o
in T
o
secs.
Therefore ; Maximum rate of change of slope change =
FIG 1.9 Illustrating Output Instability with a Double Integration
Feedback Network
1 4 i. 4 ,
__
I
...,,...,
1
•
• i 1
..
11
..
' . : 1 .. . .
4..i
i,
•1 I
1.1i.
II , ii.i.
17
■
, .
l_ i .
,....aull`bui, wilh. i
: ,, i ; __ Id ,..
1,
.. I -1 . I
.._,1
I I
-
i
.
i
i
i_i_L
1
-
.
_I -
-I
-
il, _L
: 1-
.../?
4
(7,ti.
I? l
i
e
,
flOg
i
ro
i
vuipt
■
/ ;win' I: .1, ..h:oh
-
- 1
1
i
_r
Tttf
Ll L-
r
.
- i
_ _L
J
I .
iSingle inteplahOn
..
• -1 . 1 ,- I I
I - Allr --
1
,
1-,
:
i
1 :- —i 1-
tli
-
.
1 1•
'
.
I
.
1, 1 ! • , I__i_
i
-
1
I
-
_
-
_1_
-
"
; ;
1
1
, ,
•; I :
t
' L
.1 1 • ,l
• -,—-- is. • , • ,.___
— .
- -
, .1__
'
_HE
-,- -
,
j --i
--
iri.1
-
..
-I . -r-I.-
-1 1-i--
i •,..„-
.L 1.1, 1
"- ---- --
--1-
-
r f - -"4--LI- -
_
_ -4--
- -- - - -1._ - . -
_
--. ___
- ---
. --1 .1 ..i_ I
I i i i
1-.
_! Ir- _
.
_ 7.--1-_
• •I
1!.. .
- --
- -
__
— ----
r
ri ,] ." ,!_-
1 -1 -..---ti
. -1 .HF
H
.
.
HL
.. ,
1-1
-
1._1_
-
-
,
-1
- -1 --1
. -
----
_11.
1
-
_
-
_
-- " -
:
• -I- 1
.•
, - --I- -1-i i
I
-
i:rri.
•
•
•
FIG 1.10 Waveform of Output Resulting from a Mixed Integration
Feedback Network with a High Frequency Boost to
Prnynnt Instability[
..
.sli
:',
. 1 1 .. .
I I-
..
, 1 .1 1.- 1 ; [ L i -
1-, .
1
II
I,
•
MI
Ad
_
it
-
£60
1
1•
. . 1 4
V
-
-I
-
-
- '
_j_
'
'
I .1
i_._
1
1
°.
_ _ __I__
_
_.
i
, ,
.
. _
-
i
I. 1 i
I I'il --:
i
-
I ,
-
1 i
,
i
: .
1' i i
,-;
_____
•-
f ;
i t
. i
■
.
.
. _ . _
I _
_
_ 7.1
...
,
•
,
. _ _ .1._ /
..
•
..
. i !. i
Ao
,
1. 1 . 1
1