R E S E A R C H A R T I C L E
Open Access
Mouse strain specific gene expression differences
for illumina microarray expression profiling in
embryos
Petra Kraus
1†, Xing Xing
1†, Siew Lan Lim
1, Max E Fun
2, V Sivakamasundari
1, Sook Peng Yap
1, Haixia Lee
2,
R Krishna Murthy Karuturi
2and Thomas Lufkin
1*Abstract
Background:In the field of mouse genetics the advent of technologies like microarray based expression profiling dramatically increased data availability and sensitivity, yet these advanced methods are often vulnerable to the unavoidable heterogeneity ofin vivomaterial and might therefore reflect differentially expressed genes between mouse strains of no relevance to a targeted experiment. The aim of this study was not to elaborate on the usefulness of microarray analysis in general, but to expand our knowledge regarding this potential“background noise”for the widely used Illumina microarray platform surpassing existing data which focused primarily on the adult sensory and nervous system, by analyzing patterns of gene expression at different embryonic stages using wild type strains and modern transgenic models of often non-isogenic backgrounds.
Results:Wild type embryos of 11 mouse strains commonly used in transgenic and molecular genetic studies at three developmental time points were subjected to Illumina microarray expression profiling in a strain-by-strain comparison. Our data robustly reflects known gene expression patterns during mid-gestation development. Decreasing diversity of the input tissue and/or increasing strain diversity raised the sensitivity of the array towards the genetic background. Consistent strain sensitivity of some probes was attributed to genetic polymorphisms or probe design related artifacts.
Conclusion:Our study provides an extensive reference list of gene expression profiling background noise of value to anyone in the field of developmental biology and transgenic research performing microarray expression profiling with the widely used Illumina microarray platform. Probes identified as strain specific background noise further allow for microarray expression profiling on its own to be a valuable tool for establishing genealogies of mouse inbred strains.
Keywords:Microarray, Mouse strain, Polymorphism, Expression profiling, Transgenic mice
Background
Mouse models are a fundamental tool in gaining a better understanding of mammalian development in general and human pathology in particular [1]. By studying gene expression patterns in the developing mouse embryo, important genetic pathways and signaling cascades have been revealed, for example in limb patterning (for review see [2]), the central nervous system (for review see [3])
and the digestive system (for review see [4]). However, gene expression profiling techniques have leaped for-ward in recent years from the classical RNA in situ hybridization analysis to the more detailed and advanced methodologies of microarray analysis [5-8] providing a powerful tool for in depth analysis of genome wide dif-ferential gene expression. Yet, by increasing the assay sensitivity and being able to detect more subtle changes in expression profiles, questions arise in how far differ-ences in the mouse genetic background affect the out-come of this advanced type of gene expression profiling. It is of concern, that strain specific differences in gene * Correspondence:[email protected]
†Equal contributors 1
Stem Cell and Developmental Biology, Genome Institute of Singapore, Singapore 138672, Singapore
Full list of author information is available at the end of the article
expression levels might obscure the readout of micro-array results for certain genes or tissue types simply by reflecting “background noise” resulting either from true genetic strain dependent differences in expression levels yet, not relevant for a more targeted study or from a “chip artifact”originating from unfavorable hybridization conditions of some probes due to polymorphisms in their DNA sequence [7,9,10].
Microarray data is often obtained from cell culture approaches with a fairly homogenous genetic background [11,12], these however lack the native context provided by in vivo assays analyzing fresh adult tissue or embryos. Historically, the mouse has often been the model organism of choice for in vivo studies and it is well known that different mouse inbred strains differ in their behavioral traits, physiology and anatomy [1,9,13-16]. Extensive data has been generated thus far addressing differential gene expression, especially for the Affymetrix array platform, mostly focusing on adult tissue often of the sensory and central nervous system (CNS) type, frequently restricted to only one tissue type or a couple of inbred strains selected for their suitability in behavior studies or within one strain at different time points [7-9,17-21]. More recent in vivo approaches however combine transgenic models with tissue dissection and microarray based gene expres-sion profiling [5,22,23]. Modern genetic engineering often requires crosses between several mouse strains, for example by breeding mice harboring a targeted allele to Flpe- or Cre-deleter strains, yet the production of isogenic strains for each genetically modified allele generated would exceed most funding time frames [24-28]. When studying prenatal development availability of sufficient material can be another limiting factor for expression profiling, hence the breeding advantage of hybrid or outbred strains is often considered [29-32] (www.harlan.com). Despite a vast amount of existing data (for a review see [10]), it remains crucial for studies making use of genetically engineered animals to expand our current knowledge of gene expression profiling background noise to additional inbred and even outbred strains and also to a spectrum of embryonic time points, ideally for all microarray platforms as the outcome of expression profiling is clearly dependent on the platform used [7,33,34].
With the ultimate aim to complement existing data, using the Illumina microarray platform, we performed a comparative analysis across several commonly used mouse strains in transgenic research (C57BL/6J, 129 S2/ SvHsd, FVB/NHanTMHsd and Hsd:ICR(CD-1)W) at three different stages of mid-gestation development and an additional comprehensive comparison across 11 strains
[129 S2/SvHsd, FVB/NHanTMHsd, C3H/HeNHs, CBA/
JHsd; BALB/cOlaHsd, C.B-17/IcrHanTMHsd-Prkdcscid,
C57BL/6 J, B6;SJL-Tg(Col2a1-cre)1Bhr/J, 129 S4/SvJaeSor-Gt(Rosa)26Sortm1(FLP1)Dym/J, C57BL/6J(Zp3-cre)93Knw/J, Hsd:ICR(CD-1)W] at E12.5 focusing on eviscerated embryos to provide a reference list of gene expression differ-ences, while at the same time observing the impact of a reduction in tissue diversity and increasing gen-etic strain diversity on differential gene expression levels.
Results and discussion
A reference resource for gene expression profiling associated background noise with the illumina mouse WG6 v2.0 microarray in transgenic research and developmental biology
regulated when subjecting entire wild type embryos to this strain specific gene expression profiling (for a full list see Additional file 1: Tables S1, Additional file2: Table S2 and Additional file 3: Table S3). Some of the probes were found ranking in the top 20 for all three stages examined: Fcer1g, Lrrc57, Sspn, Tmem87a, Cap1, Lip1, Gramd4, Ctse, Tm7sf3, Pou6f1, LOC382555 (Hmgb1-rs18) and C920006O11Rik (unclassified RIKEN cDNA) (for details see Additional file1: Tables S1, Additional file 2: Table S2 and Additional file 3: Table S3, for details regarding the probe ranking refer to Experi-mental Design in the Material and Methods section.)
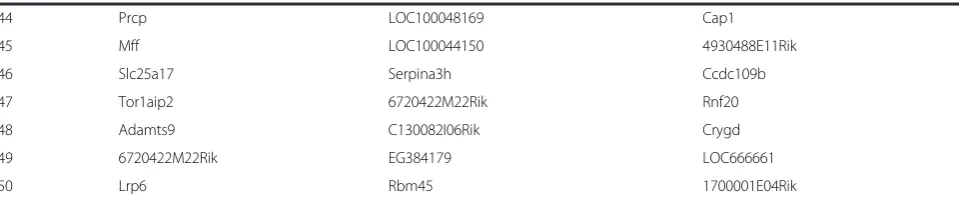
The fact that many genes are represented by only a single oligo probe on the array increases the risk that differential expression among the four strains, particu-larly if observed for a given strain at all three stages (for example in the case of Fcer1gand Lrrc57) results from strain dependent polymorphisms affecting the probe-mRNA hybridization efficiency and causing misleading expression profiles. To examine this, we sequenced over the genomic region of all four strains analyzed in this study including and flanking the region of a few randomly selected probes showing consistent strain differences, namely: Sspn, Lrrc57, Fcer1g, Zfp235, Gramd4, Cfl1, Pou6f1, Snx5b, Lib1 and Lip1b. The
genomic sequences of Fcer1g, Lrrc57 and Gramd4
indeed show polymorphisms compared to the oligo sequence represented on the Illumina MouseWG-6_V2_0_R3_11278593 array for the strains 129 S2/
SvHsd, FVB/NHanTMHsd and Hsd:ICR(CD-1)W but not
for C57BL/6J supporting the observation of a higher average signal for embryos of the C57BL/6J strain, owing to less favorable hybridization conditions for the other strains. For Pou6f1, Snx5band Zfp235on the other side, polymorphisms were only detected for the 129 S2/SvHsd strain, explaining the generally lower average signal observed for embryos from this strain. Similarly, lower average signals in embryos from the FVB/NHanTMHsd strain for Lip1 could be attributed to polymorphisms in both probes on the array (for details please refer to Table 1). The polymorphisms and resulting hybridization disadvantages rather than true differential expression are likely responsible for the noted strain specific differences in expression levels at a given developmental stage. In the case of Sspn, one of our top ranking probes, (for details regarding the probe ranking refer to Experimental Design in the Material and Methods section), poly-morphisms and deletions found for the Hsd:ICR(CD-1)W
and the FVB/NHanTMHsd strains explain the lower
expression observed for these two strains compared to embryos of C57BL/6J and 129 S2/SvHsd background (see Table 1). Hence all randomly selected and sequenced probes in our study displaying strain specific differential gene expression could be labeled as “background noise”
based on the identification of strain specific poly-morphisms, yet for Cfl1or cofilin 1 (MGI:101757), a single transcript gene, sequencing did not reveal any polymorphisms for any of the four strains in the region overlapping with the Illumina probe. In an attempt to understand whether strain specific gene expression indeed could account for the differential expression profile noted for Clf1, we performed for this one gene quan-titative PCR validation (qPCR) for two primer sets
probing for the Cfl1 transcript on the same total
mRNA pool previously subjected to the array. Since the qPCR results did not support our array data (data not shown), we mapped the exact genomic localization of the Cfl1 oligo spotted on the array and found it to be
located outside the actual Cfl1 gene. According to
NCBI mapview the only two genes in the vicinity, Sorting nexin 32 (Snx32, MGI:2444704) and Clf1 itself do not overlap with the probe spotted on the array. Since our input source was total mRNA likely includ-ing unedited nuclear RNA and based on the transcrip-tional direction of Snx32 and Clf1 relative to the array
probe only an unedited Clf1 transcript could have
hybridized with the so called“Cfl1probe”on the array. It is of note that according to Illumina both the MouseWG-6 v2.0 array platform used in this study (www.illumina.com/ products/mousewg_6_expression_beadchip_kits_v2.ilmn) as well as the previous version MouseRef8 v2.0 (www. illumina.com/products/mouseref-8_v2_expression_bead-chip_kit.ilmn) are derived from the National Center for Biotechnology Information Reference Sequence (NCBI RefSeq) database (Build 36, Release 22). The MouseWG-6 v2.0 array is said to contain all probes of the MouseRef8 v2.0 array with an additional 11,603 probes from the Mouse Exonic Evidence Based Oligonucliotide (MEEBO) as well as exemplar protein-coding sequences described in the RIKEN FANTOM2 database. The build used for both array plat-forms likely differs in gene annotation from the currently available NCBI RefSeq database Build 37. The lack of qPCR validation for Clf1 could hence be due to a probe design artifact which itself might be attributed to updates in gene annotation. Given that despite this artifact we still detected the“Clf1”probe as a strain specific differentially expressed transcript might result from the fact that the probe detects various levels of uneditedClf11nuclear transcript.
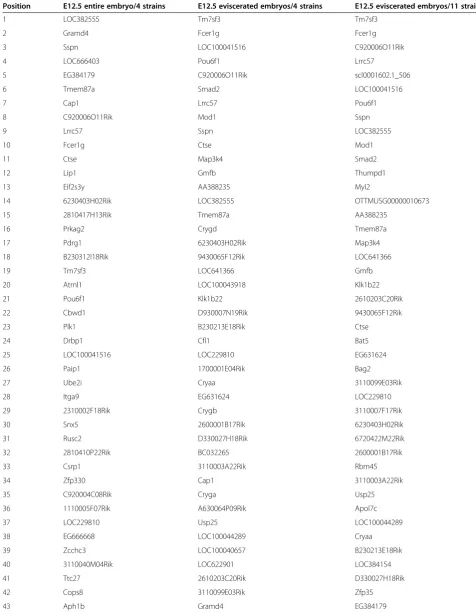
Table 1 List of the top 50 targets ranked by total fold change following a strain by strain comparison after microarray based differential expression analysis for the following three data sets
Position E12.5 entire embryo/4 strains E12.5 eviscerated embryos/4 strains E12.5 eviscerated embryos/11 strains
1 LOC382555 Tm7sf3 Tm7sf3
2 Gramd4 Fcer1g Fcer1g
3 Sspn LOC100041516 C920006O11Rik
4 LOC666403 Pou6f1 Lrrc57
5 EG384179 C920006O11Rik scl0001602.1_506
6 Tmem87a Smad2 LOC100041516
7 Cap1 Lrrc57 Pou6f1
8 C920006O11Rik Mod1 Sspn
9 Lrrc57 Sspn LOC382555
10 Fcer1g Ctse Mod1
11 Ctse Map3k4 Smad2
12 Lip1 Gmfb Thumpd1
13 Eif2s3y AA388235 Myl2
14 6230403H02Rik LOC382555 OTTMUSG00000010673
15 2810417H13Rik Tmem87a AA388235
16 Prkag2 Crygd Tmem87a
17 Pdrg1 6230403H02Rik Map3k4
18 B230312I18Rik 9430065F12Rik LOC641366
19 Tm7sf3 LOC641366 Gmfb
20 Atrnl1 LOC100043918 Klk1b22
21 Pou6f1 Klk1b22 2610203C20Rik
22 Cbwd1 D930007N19Rik 9430065F12Rik
23 Plk1 B230213E18Rik Ctse
24 Drbp1 Cfl1 Bat5
25 LOC100041516 LOC229810 EG631624
26 Paip1 1700001E04Rik Bag2
27 Ube2i Cryaa 3110099E03Rik
28 Itga9 EG631624 LOC229810
29 2310002F18Rik Crygb 3110007F17Rik
30 Snx5 2600001B17Rik 6230403H02Rik
31 Rusc2 D330027H18Rik 6720422M22Rik
32 2810410P22Rik BC032265 2600001B17Rik
33 Csrp1 3110003A22Rik Rbm45
34 Zfp330 Cap1 3110003A22Rik
35 C920004C08Rik Cryga Usp25
36 1110005F07Rik A630064P09Rik Apol7c
37 LOC229810 Usp25 LOC100044289
38 EG666668 LOC100044289 Cryaa
39 Zcchc3 LOC100040657 B230213E18Rik
40 3110040M04Rik LOC622901 LOC384154
41 Ttc27 2610203C20Rik D330027H18Rik
42 Cops8 3110099E03Rik Zfp35
regions of their assay using the Sentrix mouse-6 expres-sion bead chip from Illumina, which seemingly corre-sponds to the array used in our study http://expression. genomecenter.ucdavis.edu/illumina_expre.html. Notably, we have observed a lower average signal forSspnfor the Hsd:ICR(CD-1)W embryos in our study which could be attributed to point mutations and deletions between the
Hsd:ICR(CD-1)W and C57BL6 genomic background
(Figure 1). While the authors validate their findings with downstream cell culture experiments [38], it does dem-onstrate that there is need for caution, especially when working with strains that differ from the C57BL6 genetic background the Illumina arrays are based upon. While outbred lines like the frequently used Hsd:ICR(CD-1)W are often chosen for their breeding advantage, it needs to be considered that to maintain a random outbred line, breeding schemes are developed to avoid inbreeding in order to maintain a maximum level of heterozygosity. (For reference see [32]). The different genetic back-ground allows for multiple polymorphisms within the strain, resulting in less predictable hybridization condi-tions between the C57BL6 derived probe and RNA gen-erated from these outbred strains, hence it is of utmost importance to critically review microarray results when working with an outbred line.
Based on the use of different platforms, time points and tissues naturally the transcripts identified as differ-entially expressed are likely to differ for most datasets. Yet, members of the Serpinagene family appear for dif-ferent types of analyses and tissues: Serpina3n, formerly known as Spi2-2, spi2/eb4or M64086, was identified as a target using the Affymetrix platform in chondrogenesis [39] and in neural studies [9,21], while Serpina3h and Serpina1e, appeared in ranking 26 and 11 respectively for our differential expression analysis at E13.5 (see below) using the Illumina platform. All three genes be-long to the clade A of serine (or cysteine) peptidase inhi-bitors according to the MGI database www.informatics. jax.org/mgihome/.
Gene expression profiling with the illumina mouse WG6 v2.0 microarray chip on wild type mid-gestation embryos reflects known developmental patterns and has the potential to identify novel candidates
In an attempt to validate and further explore our micro-array data we expanded our analysis from the gene ex-pression profiling at each individual time point as described above to the three mid-gestation time points E11.5, E12.5 and E13.5, asking the following questions: Do genes group in a logical fashion according to their known expression patterns during development? And if so, can we discover new targets of potential interest sim-ply based on similarities in their time course heat map to already well established and characterized genes?
We chose these three stages because a switch in the developmental program from predominantly embryonic patterning at E11.5 to embryonic growth and organo-genesis by E13.5 would be expected, being aware that this will reflect total expression of transcripts within the embryo and not tissue specific changes. Harboring this in mind, indeed, the anticipated gross change in gene ex-pression during normal embryonic development was reflected in the gene expression profile obtained from our microarray data, with known patterning genes like
for example Shhor members of the Hox and Msx
[image:5.595.58.538.112.212.2]fam-ilies found in the group of probes that reflect decreased expression, while genes encoding structural proteins such as proteoglycans, collagens and keratins reside in the group of probes reflecting increased expression (see Additional file 4: Figure S1). This reflection of known and anticipated gene expression profiles over embryonic mouse development previously established by robust methods like RNA in-situ hybridization (RNA-ISH) not only strengthened our confidence in the data generated by the Illumina MouseWG-6_V2_0_R3_11278593 array, it also allowed us to screen for genes with similar ex-pression profiles but a previously unknown function on a broader scale than would be possible by the rather labor intensive RNA-ISH. More as a proof of principle
Table 1 List of the top 50 targets ranked by total fold change following a strain by strain comparison after microarray based differential expression analysis for the following three data sets(Continued)
44 Prcp LOC100048169 Cap1
45 Mff LOC100044150 4930488E11Rik
46 Slc25a17 Serpina3h Ccdc109b
47 Tor1aip2 6720422M22Rik Rnf20
48 Adamts9 C130082I06Rik Crygd
49 6720422M22Rik EG384179 LOC666661
50 Lrp6 Rbm45 1700001E04Rik
Rank A(entire embryos of four strains (C57BL/6J, 129 S2/SvHsd, FVB/NHanTMHsd and Hsd:ICR(CD-1)Wat E12.5),Rank B(eviscerated embryos of four strains (C57BL/6J, 129 S2/SvHsd, FVB/NHanTM
Hsd and Hsd:ICR(CD-1)Wat E12.5) andRank C(eviscerated embryos of 11 strains (129 S2/SvHsd; FVB/NHanTM
Hsd; C3H/ HeNHs; CBA/JHsd; BALB/cOlaHsd; C.B-17/IcrHanTM
Hsd-Prkdcscid; C57BL/6J; B6; SJL-Tg(Col2a1-cre)1Bhr/J; 129 S4/SvJaeSor-Gt(Rosa)26Sortm1(FLP1)Dym/J; C57BL/6-Tg
Fcer1g (FVBN/CD1/129)
5'-CGGAGAGAAT TAGAAGTGGG AAAAGAATGC AGCCAAGCAC GTCTGTTCTG-3'
T C T A
Lip1 (FVBN)
5'-TGAGGTCTGA TGAAACTGAA GAGAGGATAT TTATTCCTGG AGAAGCTGGG-3'
A GC
Lip1 (FVBN)
5'-CTGAAGAGAG GATATTTATT CCTGGAGAAG CTGGGATTAC ACTGGATTTC-3'
A GC T
Lrrc57 (FVBN/CD1)
5'-CGCAAAC TCAAA*GTCTC CAGCTATGGC A******************AGCAGCATT TCCTCCCTTC ATG-3'
A A TGGGTCCCTCTATTAACA
Lrrc57 (129)
5'-CGCAAAC TC*AAAGTCTC CAGCTATGG******************C AAGCAGCATT TCCTCCCTTC ATG-3'
T T CATGGGTCCCTCTATTAA
Pou6f1 (129)
5'-AGGAAAGGCG TCCTGGGAAT AGGAAGGTGA CTGGCTTTTC AAGAACACAA-3'
A C **** A T
Gramd4 (129)
5'-GTCTGTTTTG GATCTGTACA TAATTGTTGC TGGTGTAACT TTTGTTCTAC-3'
T
Gramd4 (FVBN/CD1)
5'-GTCTGTTTTG GATCTGTACA TAATTGTTGC TGGTGTAACT TTTGTTCTAC-3'
T
Snx5 (129)
5'-GGAGCTGTAA AGGATGTAAA AAGACATATG AGATCTTCTT GCTTGTTACC-3' ***
Zfp235 (129)
5'-CCCTGCATTC ATATTGAGTC GTATTCCCCA GTAATCGTGT AAGGGACCAT-3'
T T
Sspn (FVBN/CD1(alelle a))
5'-GTGTGCCGCA GATATAGCGG GTTCACCTTT GTATAAGTGT GCCGCAGATA-3' ******* ********** **********
Sspn (CD1(alelle b))
5'-GTGTGCCGCA GATATAGCGG GTTCACCTTT GTATAAGTGT GCCGCAGATA-3'
T
[image:6.595.63.537.94.661.2]b b
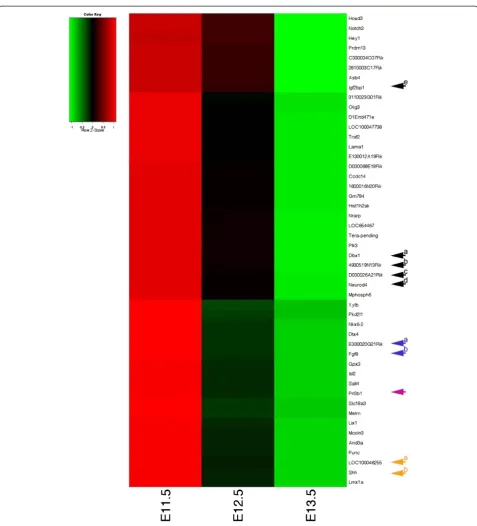
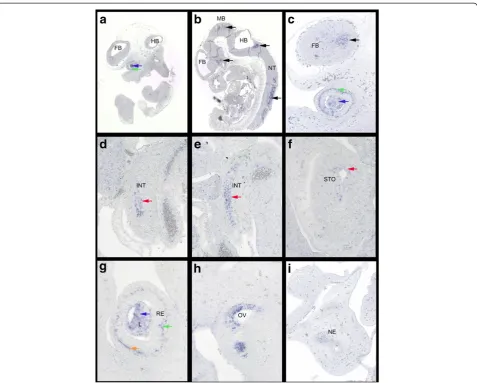
rather than with any specific interest in any develop-mental progress in particular, we randomly picked some still not annotated genes for further investigation. We chose E330020G21Rik (see Figure 2, Blue Arrow “a”), a so far unidentified probe in the MGI database which shared a time course heat map profile similar to Fgf8 in our array analysis (see Figure 2, Blue Arrow “b”). A subsequent BLAST http://mouseblast.informatics.jax. org search against the murine genome showed 100% sequence identity with Fli1 described as transiently expressed during mouse embryogenesis [40]. For an-other probe similar to this group in our time course heat map profile, Prl3b1(see Figure 2, Purple Arrow) or Pro-lactin family 3, subfamily b, member 1 (MGI:97607) RNA-ISH has previously been carried out at E8.5, E10.5 and E14.5 according to the MGI database. Expression was described in the urogenital system for whole mount RNA-ISH at E10.5 [41] and during placental develop-ment for section RNA-ISH at E8.5 and E14.5 [42]. Based on the information from our microarray analysis expression E11.5 appeared a stage worth investigating. Indeed, section-ISH on E11.5 wild type Hsd:ICR(CD-1)W embryos showed distinct expression of Prl3b1 in the CNS, the neural tube (Figure 3B) and the forebrain (Figure 3C), in the developing eye (Figures 3A,C,G), spe-cifically the lens and retina, in the inner ear (Figure 3H) and the nasal epithelium (Figure 3I), further in the epi-thelial layer of intestine (Figures 3D,E) and stomach (Figure 3F).LOC100046255(see Figure 2, Orange Arrow “a”) a still unidentified probe according to the MGI data-base, yet of interest because it is sharing a heat map pro-file with Shh (see Figure 2, Orange Arrow “a”) in our time course heat map and was classified as similar to a homeobox protein according to Illumina, could subse-quently be identified in a BLAST search as Msx2, a known and important player during mouse embryonic development [43]. Similarly 4930519N13Rik (see Fig-ure 2, Black Arrow“b”) also known as Ninein-like(Ninl, MGI:1925427) shared a similar heat map profile with Dbx1(developing brain homeobox 1,MGI: 94867, PMID: 7811640 + 8798145, see Figure 2, Black Arrow “a) and D030026A21RIK (see Figure 2, Black Arrow “c”) also
known as Insulin-like growth factor 2 mRNA binding
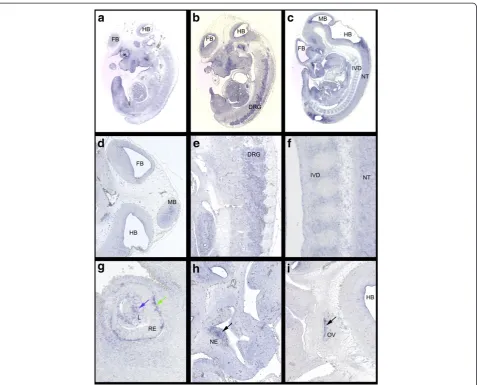
protein 1(Igf2bp1, MGI: 1890357) is sharing a heat map profile similar to Neurod4 (neurogenic differentiation 4, MGI:108055, PMID 16602821) see Figure 2, Black Arrow “d”). For Ninl so far only regionally restricted
weak to moderate expression in the liver is described by the Eurexpress database http://www.eurexpress.org at E14.5. Based on our heat map profile E11.5 appeared to be a stage worth further investigation (see Figure 2).
Section-ISH on E11.5 wild type Hsd:ICR(CD-1)W
embryos showed signals in the CNS (brain and neural tube) (Figures 4B,C,D,F) and the dorsal root ganglia (Figure 4E). There is also expression in the developing sensory organs, the eye (Figures 4A,G), the olfactory epi-thelia (Figure 4H) and the otic vesicle (Figure 4I). Of note, while the tendency of published Igf2bp1expression [44] is reflected in our heat map for bothIgf2bp1, which is represented as its own probe on the array, and D030026A21RIKa second probe forIgf2bp1(see Figure 2, Black Arrow “c”) both show a similar but not identical profile in the array (see Figure 2, Black Arrow“e”) which could be attributed to the different regions of the probe design, reflecting the presence of alternative splice variants for this gene [45] or stages of RNA editing similar to what we have observed for transcripts detected by the “Cfl1 probe”on this array.
The effect of a decrease in tissue diversity and an increase in genetic background diversity on the outcome of microarray based gene expression profiling
While only a small number (<2%) of probes did show significant (FC >1.5) differences in their expression pro-file at a given time point when subjecting entire embryos to a microarray based strain by strain gene expression profiling, there was concern that the expression profiles of some genes particularly those with multiple roles dur-ing development might have been“diluted”by subjecting entire embryos to microarray gene expression analysis without prior enrichment of the target tissue. To address the impact of a decrease in tissue diversity and/or in-crease in genetic background diversity on the outcome of microarray based gene expression profiling and hence to address the possibility of a“diluted”expression profile when performing a differential gene expression analysis of entire wild type embryos, in a separate study, we subjected E12.5 eviscerated embryos of 11 different commonly used strains in mouse genetics, immuno-logical studies, transgenic and gene targeting approaches
[129 S2/SvHsd, FVB/NHan TMHsd, C3H/HeNHs, CBA/
JHsd, BALB/cOlaHsd, C.B-17/IcrHanTMHsd-Prkdcscid, C57BL/6J, B6;SJL-Tg(Col2a1-cre)1Bhr/J, 129 S4/SvJae-Sor-Gt(Rosa)26Sortm1(FLP1)Dym/J, C57BL/6-Tg(Zp3-cre) (See figure on previous page.)
93Knw/J, Hsd:ICR(CD-1)W] to differential gene expres-sion profiling. The E12.5 embryos were staged by the same stringent morphological criteria and then eviscerated, limiting our analysis essentially to the developing neuro/ sensory, skeletal and muscular tissue. We followed the
[image:8.595.59.537.84.611.2]same basic experimental design as described earlier with four biological replicates per strain profile (for details refer to Experimental Design in the Material and Methods section). The pooling of three embryos per biological replicate should minimize any expression differences
Figure 2Selected heat map profiles at E11.5, E12.5 and E13.5 of targets with known and unknown roles during mid-gestation development based on differential gene expression analysis of entire wild type embryos averaged across four strains (C57BL/6J, 129 S2/SvHsd, FVB/NHanTMHsd and Hsd:ICR(CD-1)W) at any given developmental stage.Similarities in the heat map profile can lead to
related to the evisceration procedure. We then con-ducted our analysis in two ways: First, we focused on the four strains common between this study and our previous one on entire embryos, comparing the lists of differentially regulated genes at E12.5 to address to what extent a decrease in tissue diversity impacts on differential gene expression profiling. Second, we included all 11 strains of only the eviscerated embryos at E12.5 in the analysis to see the impact of an in-crease in strain diversity on differential gene expres-sion profiling. From these comparisons, we made four major observations:
Firstly, a list of 503 targets (1.11% of total probes on the array) with a fold change (FC) >1.5 derived from a
[image:9.595.60.538.87.470.2]strain by strain comparison of the expression profile of entire embryos at E12.5 and a list of 3403 targets (7.5% of total probes on the array) with a FC >1.5 derived from a strain by strain comparison of the expression profile of eviscerated embryos at E12.5 could be identified and ranked by total FC across the four wild type strains ana-lyzed (129 S2/SvHsd, FVB/NHanTMHsd, C57BL/6J, B6; Hsd:ICR(CD-1)W). (For details regarding the probe rank-ing refer to Experimental Design in the Material and Methods section.) We could identify eight of our top 50 targets established for the expression profile of entire E12.5 wild type embryos in the top ten targets of the list generated for eviscerated E12.5 wild type embryos [See Table 1–(Rank A) Gene Name (Rank B)]: (3) Sspn (9),
(8) C920006O11Rik (5), (9) Lrrc57 (7), (10) Fcer1g (2), (11) Ctse(10), (19) Tm7sf3(1), (21)Pou6f1(4) and (25) LOC100041516(3). Similarly we located nine of our top 50 targets for the eviscerated embryos in the top ten ranking targets of a list generated for the expression pro-file of entire embryos [46][See Table 1–(Rank B) Gene Name (Rank A)]: (2)Fcer1g(10), (5)C920006O11Rik(8), (7) Lrrc57 (9), (9) Sspn (3), (14) LOC382555 (1), (15) Tmem87a (6), (34) Cap1 (7), (43) Gramd4(2) and (49) EG384179 (5). For further details see Table 1 and Add-itional file 2: Table S2 and AddAdd-itional file 5: Table S4.
Secondly, addressing the aspect of a “diluted” expres-sion profile: Only 50% of the top 50 ranking targets in
[image:10.595.61.539.87.472.2]the list of E12.5 eviscerated embryos could be found to be significantly differentially expressed (FC > 1.5) be-tween the four strains at E12.5 when subjecting the en-tire embryo to this analysis, while 41 of the 50 top ranking targets (82%) of the 503 targets listed for the en-tire E12.5 wild type embryos would be detected as significantly differentially expressed in the list of eviscer-ated E12.5 embryos (limited to the top 500 targets for comparability), suggesting that some differential expres-sion was indeed lost through “dilution” if the tissue is too heterogeneous and/or the target is naturally expressed in multiple tissues of the embryo. Hence the purer the tissue type analyzed, the more likely all
relevant targets can be identified with current array based gene expression profiling, making the ideal source a combination of tissue micro dissection along with sort-ing of gene specific fluorescence labeled cells (Lufkin Lab, work in progress).
Thirdly, addressing the aspect of an increase in strain diversity by looking at eviscerated wild type embryos at E12.5 only, now including all 11 strains: A list of 8805 targets (19% of total probes on the array) with a fold change (FC) >1.5 between any two strains could be derived from a strain by strain comparison withTm7sf3 (1),Fcer1g(2),C920006O11Rik(3),Lrrc57(4),Pou6f1(7), Sspn(8) and LOC382555(9) still being found in the top ten targets when ranked by total fold change (See Table 2 and Additional file 6: Table S5).
Lastly, when subjecting the targets from each data set (set A: four strains, entire embryos/set B: four strains,
eviscerated embryos/set C: 11 strains, eviscerated
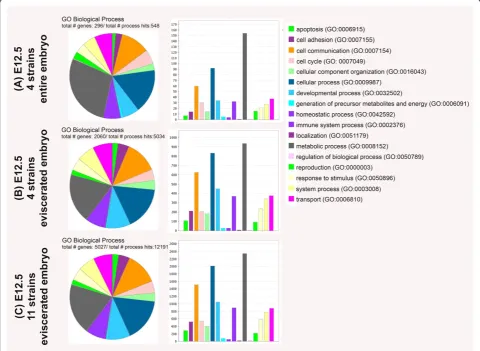
embryos) to a Panther Gene Ontology analysis www. pantherdb.org/panther/ontologies.jsp no loss or addition in gene ontology (GO) terms for biological based gene categories between the three data sets was observed (see Figure 5 and Table 3). When comparing the total
number of genes identified in each GO term based cat-egory for biological processes for each of the three data sets, the percentage of genes classified into the GO cat-egories for apoptosis (GO: 0006915), cell adhesion (GO: 0007155), cell communication (GO: 0007154), cellular
component (GO: 0016043), cellular process (GO:
0009987), developmental processes (GO:0032502) and immune system processes (GO:0002376) increased be-tween the data set A to the data sets B/C. While an in-crease in the percentage of contributing genes between data set A/B to C was limited to the GO categories localization (GO:0051179) and regulation of biological process (GO:0050789). A decrease in the percentage of contributing genes was observed for the GO term
categories metabolic process (GO: 0008152) and
reproduction (GO:0000003). Other categories like cell cycle (GO: 0007049), generation of precursor metabo-lites and energy (GO:0006091) and homeostatic process (GO:0042592) seem unaffected by the evisceration (de-crease in tissue type diversity) and/or in(de-crease in genetic background diversity.
[image:11.595.63.540.396.707.2]In summary, while a decrease in tissue diversity as well as an increase in strain diversity raises the number of
Table 2 Panther gene ontology (GO) analysis showing the percentage of the number (#) of genes for each GO term based on the total number of genes for each of the three data sets analyzed
Data set (A) E12.5 entire
embryos/4 strains
(B) E12.5 eviscerated embryos/4 strains
(C) E12.5 eviscerated embryos/11 strains
GO Categories # genes % total # genes % total # genes % total
apoptosis (GO:0006915) 7 2.4 109 5.3 287 5.7
cell adhesion (GO:0007155) 14 4.7 213 10.3 524 10.4
cell communication (GO:0007154) 60 20.3 625 30.3 1508 30
cell cycle (GO:0007049) 30 10.1 206 10 541 10.8
cellular component organization (GO:0016043) 14 4.7 183 8.9 401 8
cellular process (GO:0009987) 92 31.1 831 40.3 2011 40
developmental process (GO:0032502) 34 11.5 450 21.8 1047 20.8
generation of precursor metabolites and energy (GO:0006091) 5 1.7 27 1.3 75 1.5
homeostatic process (GO:0042592) 4 1.4 27 1.3 56 1.1
immune system process (GO:0002376) 32 10.8 370 18 892 17.7
localization (GO:0051179) 1 0.3 7 0.3 24 0.5
metabolic process (GO:0008152) 154 52 935 45.4 2345 46.6
regulation of biological process (GO:0050789) 1 0.3 6 0.3 23 0.5
reproduction (GO:0000003) 15 5.1 91 4.4 216 4.3
response to stimulus (GO:0050896) 21 7.1 237 11.5 585 11.6
system process (GO:0050896) 27 9.1 340 16.5 774 15.4
transport (GO:0006810) 37 12.5 377 18.3 882 17.5
Total # genes 296 n/a 2060 n/a 5027 n/a
Total # processed hits 548 n/a 5034 n/a 12191 n/a
A(entire embryos of four strains (C57BL/6J, 129 S2/SvHsd, FVB/NHanTMHsd and Hsd:ICR(CD-1)Wat E12.5),B(eviscerated embryos of four strains (C57BL/6J, 129 S2/SvHsd, FVB/NHanTM
Hsd and Hsd:ICR(CD-1)Wat E12.5) andC(eviscerated embryos of 11 strains (129 S2/SvHsd; FVB/NHanTM
Hsd; C3H/HeNHs; CBA/JHsd; BALB/cOlaHsd; C.B-17/IcrHanTM
Hsd-Prkdcscid; C57BL/6J; B6; SJL-Tg(Col2a1-cre)1Bhr/J; 129 S4/SvJaeSor-Gt(Rosa)26Sortm1(FLP1)Dym/J; C57BL/6-Tg(Zp3-cre)93Knw/J; Hsd:
probes showing a differential signal, one has to bear in mind that in a typical expression profiling study, such as the comparison of loss-of gene function versus wild type littermates or drug treated versus untreated cohorts, the
[image:12.595.57.538.91.442.2]actual fold changes of the identified true targets might by far outweigh the strain specific signal differences. However, the lists generated here for wild type embryos are meant to serve as guide and resource reference tool for possible gene
Figure 5Panther gene ontology (GO) term analysis for the three data sets (A)(entire embryos of four strains (C57BL/6J, 129 S2/SvHsd, FVB/NHanTMHsd and Hsd:ICR(CD-1)Wat E12.5),(B)(eviscerated embryos of four strains (C57BL/6J, 129 S2/SvHsd, FVB/NHanTMHsd and Hsd:ICR
(CD-1)Wat E12.5) and(C)(eviscerated embryos of 11 strains (129 S2/SvHsd; FVB/NHanTMHsd; C3H/HeNHs; CBA/JHsd; BALB/cOlaHsd; C.B-17/
IcrHanTMHsd-Prkdcscid; C57BL/6J; B6; SJL-Tg(Col2a1-cre)1Bhr/J; 129 S4/SvJaeSor-Gt(Rosa)26Sortm1(FLP1)Dym/J; C57BL/6-Tg(Zp3-cre)93Knw/J; Hsd:ICR (CD-1)W) at E12.5 analyzed in pie view (left) and bar view (middle) alongside the color legend (right) identifying the related GO terms and numbers according to Panther.
Table 3 Shows the sequences of the amplification primers used for PCR
x PCR primers (5'-3')
Locus Forward primer Reverse primer Amplicon Size (bp)
Fcer1g 5'-TTAGTGAGAGTCGAGGATCA-3' 5'-TTCCATCTCTGTAGAAAGCA-3' 480
Lipa 5'-CTCCACAGAATGTTTCTCCA-3' 5'-CCTAGTTCTCCAGAGGTTGA-3' 501
Lrrc57 5'-GTGGCTGTTGTGTTGGTGCT-3' 5'-TTGAGCCGTGTAGGTCATGG-3' 342
Gramd4 5'-CTTCTAGGCATCCTTACAGA-3' 5'-TAGACAGTTTTGTGCTCGAC-3' 446
Snx5 5'-ATGATAGTCTTCCAACTTCTC-3' 5'-TGATAGGTATTTGGATGCTG-3' 384
Zfp235 5'-GTTGACTGAAGCATCACTTC-3' 5'-TTCACCTTATTGGGTTGATA-3' 383
[image:12.595.61.538.608.731.2]expression profiling background noise using the Illumina Mouse WG-6 v2.0 and possibly the preceding Mouse Ref-8 v2.0 array platform in gene expression studies performed on mid-gestation embryos for strains classically used in genetic engineering.
Differential gene expression reflects the origin of inbred strains and can serve as valuable tool to establish strain ontology relationships
Most mouse inbred strains available in laboratories today can be traced back to strains established by William Castle, Abbie Lathrop, Clarence Cook Little and Halsey J. Bagg [1,47] however, making use of polymorphisms and mutations abundant in the genome and the evolving tech-nology, todays available inbred strains can be clearly dis-tinguished not only by coat color but also by their DNA sequence [48-51]. Studies have shown the usefulness of a combination of quantitative trait locus (QTL), single nu-cleotide polymorphism (SNP) and gene expression data [46]. A paper by Petkov [52] making use of SNPs and QTL analysis displays a mouse family tree with seven dis-tinct groups. While BALB/c, CBA and C3H substrains are all found within group 1, FVB/N in group 2, C57BL/6 in group 4 and 129 substrains in group 5 of his classification.
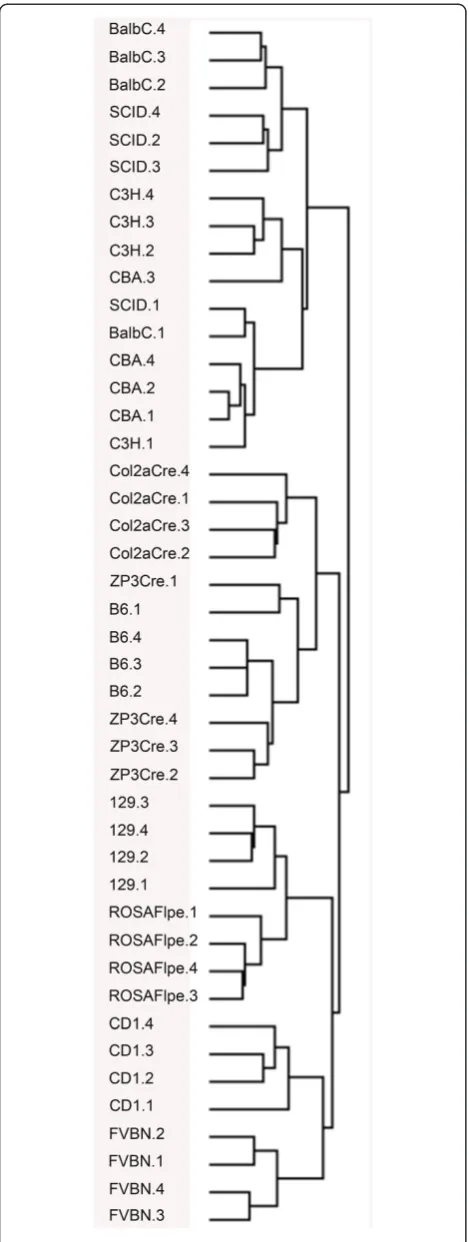
Here, we have subjected 11 mouse strains to micro-array based differential expression analysis [129 S2/
SvHsd, FVB/NHanTMHsd, C3H/HeNHs, CBA/JHsd,
BALB/cOlaHsd, C.B-17/IcrHanTMHsd-Prkdcscid, C57BL/6J, B6;SJL-Tg(Col2a1-cre)1Bhr/J, 129 S4/SvJaeSor-Gt(Rosa) 26Sortm1(FLP1)Dym/J, C57BL/6-Tg(Zp3-cre)93Knw/J, Hsd:ICR (CD-1)W]. For the 8805 differentially expressed probes in this 11 strains comparison (19% of total probes on the array) we can find the biological replicates clustering tightly by strain origin when subjecting the data to TreeView ana-lysis http://rana.lbl.gov/EisenSoftware.htm indicating on one side the accuracy of our assay as well as reiterating the fact that besides polymorphism on the DNA level, clear dif-ferences in gene expression have evolved for a small subset of genes in these strains and substrains (Figure 6). The clustering observed in our study is supported by the SNP and QTL based study [52]. Based on array clustering, we can define two major groups of mouse strains in our study:
I BALB/cOlaHsd, C.B-17/IcrHanTMHsd-Prkdcscid, CBA/JHsd and C3H/HeNHs.
II B6;SJL-Tg(Col2a1-cre)1Bhr/J, C57BL/6-Tg(Zp3-cre) 93Knw/J, C57BL/6J, 129 S2/SvHsd, 129
S4/SvJaeSor-Gt(Rosa)26Sortm1(FLP1)Dym/J, Hsd:ICR(CD-1)Wand FVB/NHanTMHsd.
Within group II we can further subdivide between
Group IIa, containing B6;SJL-Tg(Col2a1-cre)1Bhr/J,
C57BL/6-Tg(Zp3-cre)93Knw/J, C57BL/6J all comprising a C57BL/6 genetic background, with
B6;SJL-Tg(Col2a1-cre)1Bhr/J initially being generated on the SJL ground and subsequently mated onto a C57BL/6J back-ground and Group IIb represented by Group IIb-1 129 S2/SvHsd, 129 S4/SvJaeSor-Gt(Rosa)26Sortm1(FLP1)
Dym
/J both of 129 genetic background and Group IIb-2 represented by Hsd:ICR(CD-1)W on one side and FVB/ NHanTMHsd on the other side of the array clustering branch. ICR mice, an outbred strain, had not been sub-jected to Perkov’s study [52].
Unlike previous studies, where strain relationships have been established on the DNA level or combinations of DNA and gene expression analysis [46,52], we dem-onstrate here that the function driven analysis of micro-array gene expression profiling is sufficient for the accurate confirmation of the genetic ancestry of mouse strains.
Conclusions
Since the results of microarray gene expression profiling can be impacted on by variations in the strain of mouse used, we aimed to provide a resource reference list of probes contributing to strain differences or“noise”when subjecting non-isogenic tissue from any of the frequently used inbred strains in mouse gene targeting or even an outbred strain, to microarray based differential gene ex-pression profiling using the Illumina Mouse WG6 v2.0 microarray chip. We subjected entire embryos as well as eviscerated embryos to this study. This reduction in tis-sue diversity was reflected in a raised number of signifi-cantly differentially expressed genes, a number likely to increase with further reduction of tissue heterogenity. The data retrieved from our extensive expression profil-ing usprofil-ing the Illumina platform is robust and reflects the anticipated gene expression patterns of known and well-characterized patterning and structural genes during mid-gestation development. For a small number of probes, the data has been impacted on by probe design artifacts (probes not allocated in the actual gene) or nat-ural genetic polymorphisms between mouse strains reflecting “background noise”. This is a problem researchers should be aware of and future array plat-forms would need to adjust for in order to be a reason-able experimental choice compared to the rapidly evolving RNA-seq technology, which, once affordable, should allow for a more unbiased expression profiling analysis in the near future (see review by [10]).
Methods
Experimental design
All embryos were carefully staged according to logical criteria [53] and only embryos showing all morpho-logical criteria as displayed for each stage E11.5, E12.5 and E13.5 were included in this study. Three age-matched embryos of undefined gender were combined to form one biological replicate. Altogether a total of four biological replicates (12 embryos) were analyzed for each strain and developmental time point and subjected to expression pro-filing using the MouseWG-6_V2_0_R3_11278593 array from Illumina. We chose this approach of embryo pooling according to the experimental design by Korostynski et al. [20] to minimize the contribution of individual differences or slight technical variations from embryo dissections/evis-cerations to the read out of the differential expression ana-lysis. The fold change (FC) of expression for the four samples per strain was averaged at each of the three time points and subjected to a strain-by-strain comparison for a given developmental stage. The genes were then ranked according to the highest total fold change across all strains. Only genes with a FC >1.5 between any of the strains were considered as significantly differentially expressed.
Ethics statement, mouse husbandry and tissue collection All animal procedures were performed according to the Singapore A*STAR Biopolis Biological Resource Center (BRC) Institutional Animal Care and Use Committee (IACUC) guidelines and the IACUC protocols employed were reviewed and approved by the aforementioned com-mittee before any animal procedures were undertaken for this study described here (IACUC Protocol No: 080348 and 080377). The mouse strains used in this study were maintained and provided by the A*STAR Biopolis Biological Resource Center (129 S2/SvHsd, FVB/
NHanTMHsd, C3H/HeNHsd, CBA/JHsd, BALB/cOlaHsd
[image:14.595.57.292.88.710.2]and C.B-17/IcrHanTMHsd-Prkdcscid, C57BL/6J, Hsd:ICR (CD-1)W) or directly imported from Jackson Laboratories (B6;SJL-Tg(Col2a1-cre)1Bhr/J #003554, 129 S4/SvJaeSor-Gt(Rosa)26Sortm1(FLP1)Dym/J #003946, C57BL/6-Tg(Zp3-cre)93Knw/J #003651) and then maintained according to Jackson Laboratories guidelines specific for each strain.
Males and females of each respective strain were inter-mated to generate E11.5, E12.5 and E13.5 embryos, with E0.5 being defined as the day the vaginal plug was detected. The mouse embryos were subsequently har-vested in ice-cold Leibovitz’s L-15 medium (Gibco) at E11.5, E12.5 or E13.5 and critically staged applying mor-phological criteria as described [53]. For the study focus-ing on differential gene expression in eviscerated embryos the E12.5 embryos were dissected free of all internal organs. Embryos were then dissociated for RNA isolation.
RNA extraction and microarray analysis
Fresh mouse embryonic tissues were rapidly dissociated into small clumps in L-Leibovitz medium by repeated pip-etting. The small tissue clumps were collected by centrifu-gation at 2000 rpm for 5 minutes. Applying the TRIzol/ RNeasy hybrid method, TRIzol (Invitrogen) was added to the pelleted tissues at approximately 1 ml per 50 mg tissue for homogenization. The homogenate was stored in−80°C for no longer than 3 months before RNA extraction. During the RNA extraction, 0.2 ml chloroform was added per 1 ml of homogenate and the top aqueous phase was gained after centrifugation at 12,000 g for 15 minutes at 4°C. The aqueous phase was loaded onto a gDNA Elimin-ator spin column based on the DNA removal capacity of the column. Subsequent steps were done according to the RNeasy Plus Mini kit (Qiagen) following the manufac-turer’s instruction. Total RNA extracted from fresh mouse embryonic tissues was quantified by a NanoDrop ND-1000 Spectrophotometer. For quality control, RNA was diluted to the working concentration of the Agilent RNA 6000 Nano Kit and 1 ul of the diluted RNA sample was run on the Nano chip using an Agilent 2100 electrophor-esis Bioanlyzer. The Nano chip assay was performed according to the manufacturer’s instructions. The quality of total RNA was assessed primarily via the profile of the electropherogram and secondarily by RNA integrity num-ber (RIN) generated by the Bioanalyzer software, only samples with a RIN > 9.4 were included in the study (see Additional file 5: Table S4). The RNA concentration given by Nanodrop and Nano chip coincided. For each bio-logical replicate 50 ng of high quality total RNA was la-beled using Illumina TotalPrep RNA Amplification kit
from Ambion and hybridized on Illumina’s
MouseWG-6_V2_0_R3_11278593 array according to the manufac-turer’s instructions. Microarray data was normalized using GenomeStudio (background subtraction, rank invariant normalization). Any negative values were replaced by the value “1” for fold change calculation and then all signals were Log2 transformed. Linear modeling of the trans-formed data was pertrans-formed using Limma in R [54] with the Benjamini and Hochberg correction. The model used included developmental stage, strain and batch factors, where appropriate. P value and FDR were obtained for
coefficient of each factor depending on the comparison, ie. coefficients for developmental stage or strain. Fold differ-ence was calculated by taking the ratio of the individual signals with higher expressing value over the signals with the lower expression value. Only expression levels with at least 1.5× fold difference and a false discovery rate (FDR) below 5% were considered as significantly differentially regulated. Microarray data was hierarchical clustered by average linkage clustering with uncentered correlation using Cluster [55] and the heatmap was generated with R. Strain ontology relationships were established with Tree-View http://rana.lbl.gov/EisenSoftware.htm.
Genomic DNA extraction and sequencing over illumina probes
To extract genomic DNA embryos were removed from the yolk sac, briefly washed in 1x PBS and placed in 500 ul PKDB digestion buffer (50 mM Tris–HCl (pH 8.0), 200 mM NaCl, 5 mM EDTA, 1% SDS) containing 1 mg/ ml proteinase K and incubated at 55°C overnight. Digested samples were extracted with an equal volume of phenol-chloroform, DNA was precipitated with etha-nol and washed with 70% ethaetha-nol. DNA pellets were air-dried and resuspended in DNase free water.
Sequences 500 nucleotide upstream and downstream of each Illumina probe sequence were obtained from UCSC using BLAST-Like Alignment Tool (BLAT) at (http://gen-ome.ucsc.edu/). For primer design, sequences obtained from BLAT were imported into the Vector NTI Advance 10 (Invitrogen, CA, USA) software and primer pairs flank-ing the Illumina probe sequences were designed carefully avoiding similarities with repetitive sequences or other loci in the genome. Table 3 shows the sequences of the ampli-fication primers used for PCR.
PCR products were generated using PlatinumW Pfx
DNA polymerase (Invitrogen) and PCR products were purified on a MinElute PCR purification spin column (Qiagen, Hagen, Germany) following the manufacturer's instructions. The DNA was eluted in 30 ul of elution buffer and sent for sequencing. Sequences were aligned against and compared with the sequences of respective Illumina probes using Vector NTI .
cDNA synthesis and real-time qPCR analysis
Total RNA from mouse embryos was isolated, assessed and quantified as described above. First strand cDNA was synthesized from 5ug of total RNA by reverse tran-scription PCR at 50°C for 30 min in the presence of 200 ng/ul random hexamers and 10 mM each of dNTPs and RevertAid™Premium Enzyme mix (Fermentas). The synthesized cDNAs were adjusted to 50 ng/ul of which 100 ng was used in a final volume of 20 ul. Each sample was run in triplicate on an Applied Biosystems 7500
ROX qPCR master mix (Fermentas). TheHprtgene had no significant variation in expression across the four mouse strains and therefore was used as endogenous control for normalization . Expression level was evalu-ated relative to a calibrator according to the 2-ΔΔCt method for quantitation.
Histology and RNA in situ hybridization
Mouse embryos were processed by fixation with 4% par-aformaldehyde (PFA), overnight at 4°C, then washed with 1x PBS, dehydrated in graded ethanol and embed-ded in paraffin. A Leica RM 2165 microtome was used to make 10 um thick paraffin sections. Sectioned in situ hybridization was performed as described in [56]. The cDNA of 0.8 kbPrl3b1(IMAGE clone: 30787415)
linear-ized with EcoRV and Ninl cDNA of 4.2 kb (IMAGE
clone: 30615484) linearized with EcoRI were used as templates for synthesizing antisense DIG-labeled Prl3b1 andNinlRNA probes (DIG RNA labeling kit, Roche).
Additional files
Additional file 1:Table S1.List of significant differentially regulated probes with a fold change >1.5× for entire embryos of four strains (C57BL/6J, 129 S2/SvHsd, FVB/NHanTMHsd and Hsd:ICR(CD-1)W) at E11.5
subjected to microarray expression analysis. Expression values are included.
Additional file 2:Table S2.List of significant differentially regulated probes with a fold change >1.5× for entire embryos of four strains (C57BL/6J, 129 S2/SvHsd, FVB/NHanTMHsd and Hsd:ICR(CD-1)W) at E12.5
subjected to microarray expression analysis. Expression values are included.
Additional file 3:Table S3.List of significant differentially regulated probes with a fold change >1.5× for entire embryos of four strains (C57BL/6J, 129 S2/SvHsd, FVB/NHanTMHsd and Hsd:ICR(CD-1)W) at E13.5
subjected to microarray expression analysis. Expression values are included.
Additional file 4:Figure S1.Heatmap displaying all significant differentially regulated probes with a fold change >1.5× for entire embryos of four strains (C57BL/6J, 129 S2/SvHsd, FVB/NHanTMHsd and
Hsd:ICR(CD-1)W) at E11.5, E12.5 and E13.5 subjected to microarray expression analysis.
Additional file 5:Table S4.List of significant differentially regulated probes with a fold change >1.5× for eviscerated embryos of four strains (C57BL/6J, 129 S2/SvHsd, FVB/NHanTMHsd and Hsd:ICR(CD-1)W) at E12.5
subjected to microarray expression analysis.
Additional file 6:Table S5.List of significant differentially regulated probes with a fold change >1.5× for eviscerated embryos of 11 strains (129 S2/SvHsd; FVB/NHanTMHsd; C3H/HeNHs; CBA/JHsd; BALB/cOlaHsd; C.B-17/IcrHanTMHsd-Prkdcscid; C57BL/6J; B6; SJL-Tg(Col2a1-cre)1Bhr/J; 129 S4/SvJaeSor-Gt(Rosa)26Sortm1(FLP1)Dym/J; C57BL/6-Tg(Zp3-cre)93Knw/J; Hsd:ICR(CD-1)W). at E12.5 subjected to microarray expression analysis.
Competing interests
The authors declare that they have no competing interests.
Authors' contributions
All authors contributed to drafting the manuscript. PK, YSP and TL were involved in the design of the study. PK interpreted the data and carried out the animal work. XX generated the microarray data. XX and SLL carried out the validation of microarray results. VS carried out RNA-ISH. MEF, HL and
RKMK carried out computational analysis of the microarray data. All authors have read and approved the final manuscript.
Acknowledgements
We are grateful to all A*STAR/BRC staff, in particular to Sharon Heng Yee Choy and all members of the Lufkin Lab for support and interesting discussions in particular Song Jie and Sumantra Chatterjee. This work was supported by the Agency for Science Technology and Research (A*STAR) Singapore.
Author details
1Stem Cell and Developmental Biology, Genome Institute of Singapore, Singapore 138672, Singapore.2Computational and Systems Biology, Genome Institute of Singapore, Singapore 138672, Singapore.
Received: 18 January 2012 Accepted: 5 April 2012 Published: 14 May 2012
References
1. Green EL:Biology of the laboratory mouse. New York: Dover Publication; 1966.
2. Niswander L:Interplay between the molecular signals that control vertebrate limb development.Int J Dev Biol2002,46:877–881.
3. Zervas M, Blaess S, Joyner AL:Classical embryological studies and modern genetic analysis of midbrain and cerebellum development.Curr Top Dev Biol2005,69:101–138.
4. Roberts DJ:Molecular mechanisms of development of the gastrointestinal tract.Dev Dyn2000,219:109–120.
5. Vokes SA, Ji H, Wong WH, McMahon AP:A genome-scale analysis of the cis-regulatory circuitry underlying sonic hedgehog-mediated patterning of the mammalian limb.Genes Dev2008,22:2651–2663.
6. Amit G, Shukha K, Gavriely N, Intrator N:Respiratory modulation of heart sound morphology.Am J Physiol Heart Circ Physiol2009,296:H796–H805. 7. Bottomly D, Walter NA, Hunter JE, Darakjian P, Kawane S, Buck KJ, Searles
RP, Mooney M, McWeeney SK, Hitzemann R:Evaluating gene expression in C57BL/6 J and DBA/2 J mouse striatum using RNA-Seq and microarrays.
PLoS One2011,6:e17820.
8. Jelcick AS, Yuan Y, Leehy BD, Cox LC, Silveira AC, Qiu F, Schenk S, Sachs AJ, Morrison MA, Nystuen AM,et al:Genetic variations strongly influence phenotypic outcome in the mouse retina.PLoS One2011,6:e21858. 9. Sandberg R, Yasuda R, Pankratz DG, Carter TA, Del Rio JA, Wodicka L,
Mayford M, Lockhart DJ, Barlow C:Regional and strain-specific gene expression mapping in the adult mouse brain.Proc Natl Acad Sci USA 2000,97:11038–11043.
10. Malone JH, Oliver B:Microarrays, deep sequencing and the true measure of the transcriptome.BMC Biol2011,9:34.
11. Boimel PJ, Cruz C, Segall JE:A functional in vivo screen for regulators of tumor progression identifies HOXB2 as a regulator of tumor growth in breast cancer.Genomics2011,98:164–172.
12. Zhang L, Ju X, Cheng Y, Guo X, Wen T:Identifying Tmem59 related gene regulatory network of mouse neural stem cell from a compendium of expression profiles.BMC Syst Biol2011,5:152.
13. Crawley JN, Belknap JK, Collins A, Crabbe JC, Frankel W, Henderson N, Hitzemann RJ, Maxson SC, Miner LL, Silva AJ,et al:Behavioral phenotypes of inbred mouse strains: implications and recommendations for molecular studies.Psychopharmacology (Berl)1997,132:107–124. 14. Gerlai R:Gene-targeting studies of mammalian behavior: is it the
mutation or the background genotype?Trends Neurosci1996,19:177–181. 15. Peirce JL, Derr R, Shendure J, Kolata T, Silver LM:A major influence of
sex-specific loci on alcohol preference in C57Bl/6 and DBA/2 inbred mice.
Mamm Genome1998,9:942–948.
16. Pavlidis P, Noble WS:Analysis of strain and regional variation in gene expression in mouse brain.Genome Biol2001,2:1–15. RESEARCH0042. 17. Fernandes C, Paya-Cano JL, Sluyter F, D'Souza U, Plomin R, Schalkwyk LC:
Hippocampal gene expression profiling across eight mouse inbred strains: towards understanding the molecular basis for behaviour.Eur J Neurosci2004,19:2576–2582.
19. Hoffman BG, Zavaglia B, Witzsche J, Ruiz De Algara T, Beach M, Hoodless PA, Jones SJ, Marra MA, Helgason CD:Identification of transcripts with enriched expression in the developing and adult pancreas.Genome Biol 2008,9:99.
20. Korostynski M, Kaminska-Chowaniec D, Piechota M, Przewlocki R:Gene expression profiling in the striatum of inbred mouse strains with distinct opioid-related phenotypes.BMC Genomics2006,7:146.
21. Suzuki Y, Nakayama M:Differential profiles of genes expressed in neonatal brain of 129X1/SvJ and C57BL/6J mice: A database to aid in analyzing DNA microarrays using nonisogenic gene-targeted mice.DNA Res2003,10:263–275.
22. Sansom SN, Griffiths DS, Faedo A, Kleinjan DJ, Ruan Y, Smith J, van Heyningen V, Rubenstein JL, Livesey FJ:The level of the transcription factor Pax6 is essential for controlling the balance between neural stem cell self-renewal and neurogenesis.PLoS Genet2009,5:e1000511. 23. Cameron TL, Belluoccio D, Farlie PG, Brachvogel B, Bateman JF:Global
comparative transcriptome analysis of cartilage formation in vivo.BMC Dev Biol2009,9:20.
24. Wright S:Systems of mating. V. General considerations.Genetics1921, 6:167–178.
25. Wright S:Systems of mating IV. The effects of selection.Genetics1921, 6:162–166.
26. Wright S:Systems of mating III. Assortative mating based on somatic resemblance.Genetics1921,6:144–161.
27. Wright S:Systems of mating II. The effects of inbreeding on the genetic composition of a population.Genetics1921,6:124–143.
28. Wright S:Systems of mating I. The biometric relations between parent and offspring.Genetics1921,6:111–123.
29. Roberts RC:The effects on litter size of crossing lines of mice inbred without selection.Genet Res1960,1:239–252.
30. Barnett SAaC E:'Heterosis' in F1 mice in a cold environment.Genet Res 1960,1:25–38.
31. McCarthy JC:The effect of litter size of crossing inbred strains of mice.
Genetics1965,51:217–222.
32. Silver LM:Mouse genetics. Oxford: New York; 1995.
33. McCall MN, Murakami PN, Lukk M, Huber W, Irizarry RA:Assessing affymetrix GeneChip microarray quality.BMC Bioinformatics2011,12:137. 34. Edwards YJ, Bryson K, Jones DT:A meta-analysis of microarray gene
expression in mouse stem cells: redefining stemness.PLoS One2008,3: e2712.
35. Greenhall JA, Zapala MA, Caceres M, Libiger O, Barlow C, Schork NJ, Lockhart DJ:Detecting genetic variation in microarray expression data.
Genome Res2007,17:1228–1235.
36. Caceres M, Lachuer J, Zapala MA, Redmond JC, Kudo L, Geschwind DH, Lockhart DJ, Preuss TM, Barlow C:Elevated gene expression levels distinguish human from non-human primate brains.Proc Natl Acad Sci USA2003,100:13030–13035.
37. Karaman MW, Houck ML, Chemnick LG, Nagpal S, Chawannakul D, Sudano D, Pike BL, Ho VV, Ryder OA, Hacia JG:Comparative analysis of gene-expression patterns in human and African great ape cultured fibroblasts.
Genome Res2003,13:1619–1630.
38. Zhou D, Wang J, Zapala MA, Xue J, Schork NJ, Haddad GG:Gene expression in mouse brain following chronic hypoxia: role of sarcospan in glial cell death.Physiol Genomics2008,32:370–379.
39. James CG, Stanton LA, Agoston H, Ulici V, Underhill TM, Beier F: Genome-wide analyses of gene expression during mouse endochondral ossification.PLoS One2010,5:e8693.
40. Vlaeminck-Guillem V, Carrere S, Dewitte F, Stehelin D, Desbiens X, Duterque-Coquillaud M:The Ets family member Erg gene is expressed in mesodermal tissues and neural crests at fundamental steps during mouse embryogenesis.Mech Dev2000,91:331–335.
41. McMahon AP, Aronow BJ, Davidson DR, Davies JA, Gaido KW, Grimmond S, Lessard JL, Little MH, Potter SS, Wilder EL, Zhang P:GUDMAP: the genitourinary developmental molecular anatomy project.J Am Soc Nephrol2008,19:667–671.
42. Simmons DG, Rawn S, Davies A, Hughes M, Cross JC:Spatial and temporal expression of the 23 murine Prolactin/Placental Lactogen-related genes is not associated with their position in the locus.BMC Genomics2008, 9:352.
43. Satokata I, Ma L, Ohshima H, Bei M, Woo I, Nishizawa K, Maeda T, Takano Y, Uchiyama M, Heaney S,et al:Msx2 deficiency in mice causes pleiotropic
defects in bone growth and ectodermal organ formation.Nat Genet 2000,24:391–395.
44. Shimogori T, Lee DA, Miranda-Angulo A, Yang Y, Wang H, Jiang L, Yoshida AC, Kataoka A, Mashiko H, Avetisyan M,et al:A genomic atlas of mouse hypothalamic development.Nat Neurosci2010,13:767–775.
45. Gu W, Wells AL, Pan F, Singer RH:Feedback regulation between zipcode binding protein 1 and beta-catenin mRNAs in breast cancer cells.Mol Cell Biol2008,28:4963–4974.
46. Hitzemann R, Malmanger B, Reed C, Lawler M, Hitzemann B, Coulombe S, Buck K, Rademacher B, Walter N, Polyakov Y,et al:A strategy for the integration of QTL, gene expression, and sequence analyses.Mamm Genome2003,14:733–747.
47. Silver LM:Mouse Genetics - Concepts and Applications. New York, USA: Oxford University Press; 1995.
48. Beck JA, Lloyd S, Hafezparast M, Lennon-Pierce M, Eppig JT, Festing MF, Fisher EM:Genealogies of mouse inbred strains.Nat Genet2000,24:23–25. 49. Wade CM, Daly MJ:Genetic variation in laboratory mice.Nat Genet2005,
37:1175–1180.
50. Yang H, Wang JR, Didion JP, Buus RJ, Bell TA, Welsh CE, Bonhomme F, Yu AH, Nachman MW, Pialek J,et al:Subspecific origin and haplotype diversity in the laboratory mouse.Nat Genet2011,43:648–655. 51. Keane TM, Goodstadt L, Danecek P, White MA, Wong K, Yalcin B, Heger A,
Agam A, Slater G, Goodson M,et al:Mouse genomic variation and its effect on phenotypes and gene regulation.Nature2011,477:289–294. 52. Petkov PM, Ding Y, Cassell MA, Zhang W, Wagner G, Sargent EE, Asquith S,
Crew V, Johnson KA, Robinson P,et al:An efficient SNP system for mouse genome scanning and elucidating strain relationships.Genome Res2004, 14:1806–1811.
53. Kaufman MH:The Atlas of Mouse Development. Academic Press; 1992. 54. Smyth GK:Linear models and empirical bayes methods for assessing
differential expression in microarray experiments.Stat Appl Genet Mol Biol 2004,3:1–25. Article3.
55. Eisen MB, Spellman PT, Brown PO, Botstein D:Cluster analysis and display of genome-wide expression patterns.Proc Natl Acad Sci USA1998, 95:14863–14868.
56. Yap SP, Xing X, Kraus P, Sivakamasundari V, Chan HY, Lufkin T:Generation of mice with a novel conditional null allele of the Sox9 gene.Biotechnol Lett2011,33:1551–1558.
doi:10.1186/1756-0500-5-232
Cite this article as:Krauset al.:Mouse strain specific gene expression differences for illumina microarray expression profiling in embryos.BMC Research Notes20125:232.
Submit your next manuscript to BioMed Central and take full advantage of:
• Convenient online submission
• Thorough peer review
• No space constraints or color figure charges
• Immediate publication on acceptance
• Inclusion in PubMed, CAS, Scopus and Google Scholar
• Research which is freely available for redistribution