A Collaborative Sensor Grids Framework
Geoffrey Fox
1,2, Alex Ho
2, Rui Wang
2, Edward Chu
2and Isaac Kwan
21
Community Grids Laboratory,
Indiana University, Suite 224,
501 North Morton Street,
Bloomington IN 47404
2
Anabas Inc,
Suite 106C,
501 North Morton Street,
Bloomington, IN 47404
[email protected], [email protected], [email protected], [email protected],
[email protected]
ABSTRACT
Integrating sensors and grid computing provides a way to gather, process and model real-time information from the environment for informed decision-support and timely actions, proactive or reactive, to events. We create a collaborative sensor grid framework to support the integration of a sensor grid with collaboration and other grids. The framework includes a grid builder tool for discovering and managing grid services and remote, distributed sensors. It provides a real-time collaborative client to enable distributed stakeholders to have a consistent view of displayed sensor streams. We illustrate the versatility of the framework by constructing a robot-based customizable application for shared situational awareness.
KEYWORDS: Collaborative Sensor Grids, Grid Management, Real-time Collaboration, User-Defined Operating Picture, Common Operating Picture
1. INTRODUCTION
Increased use of sensors in commercial and military environments is being driven by the need for better intelligence data and advancement in technology, which provides smaller, less costly and more capable sensors. It is not sufficient and in many situations not productive to just overwhelm decision-makers at all levels with lots of sensor data for their missions on hand. Our collaborative sensor grid framework supports seamless integration of loosely-coupled and custom-developed sensor data management, visualization and presentation tools, and real-time collaboration capability for sharing situational
awareness. Real-time information about the environment can be gathered, processed, correlated and shared to facilitate quick and relevant decision-making on a large scale.
Our research is motivated to design and develop an enabling framework to support the development, deployment, management and real- time visualization and presentation of collaborative, geo-coded sensor grid applications with extensibility, scalability and security. Our Collaborative Sensor Grid (CSG) framework uses a “publish and subscribe” communication paradigm over a distributed message broker architecture based on a NaradaBrokering (NB) transport network [1]. This approach has already been successfully used in GPS Sensor Grid for Earthquake Science [2-4]. A key component of the CSG framework is the Grid Builder tool which supports the building of grid of grids - a compositional model of assembling a multitude of subgrids into a mission-specific grid application. In CSG the Grid Builder facilitates the assemblage of important subgrids, namely a real-time multimedia collaboration grid and hierarchical, executable sensor grid for a collaborative sensor grid. The earlier work combined simulation and sensor grids without the powerful management features of the Grid Builder. A particular design objective for the CSG client is to provide an intuitive user interface for enabling UDOP (User Defined Operation Picture) and COP (Common Operation Picture) capabilities, which are essential for agile formulation and sharing of visual, situational awareness and effective decision-support.
NXT robot-based UDOP (User-defined Operating Picture)/COP (Common Operating Picture) application. In Section 3 we describe how the Grid Builder tool facilitates the discovery and management of distributed sensors. Visualization and presentation for displaying sensor data in the collaboration grid are illustrated in section 4. Finally, section 5 summarizes the paper with conclusions and future work.
2. COLLABORATIVE SENSOR GRIDS
2.1. System Architecture and Sensors
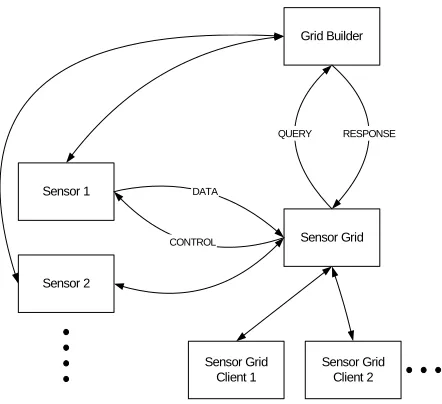
The CSG framework comprises a Grid Builder module, a sensor grid and collaboration grid. Figure 1 illustrates the architectural relationship among them.
Grid Builder
Sensor Grid
Sensor Grid Client 1
Sensor Grid Client 2 Sensor 1
Sensor 2
DATA
CONTROL
[image:2.612.315.553.165.359.2]QUERY RESPONSE
Figure 1. A Collaborative Sensor Grid Architecture
Each sensor grid client in Figure 1 is a representation of a collaborative session or “meeting” within which the meeting participants shared real-time streaming sensor information.
As shown in Figure 2, multiple collaborative sessions could interact with any combination of deployed sensors via the sensor grid. A collaborative sensor grid is abstracted into 3 parts:
(1) sensor adapter, (2) data flow, and
(3) control and visualization – these are the “V” and “C” in a classic MVC model.
Our approach uses a scalable, hierarchical and collaborative architecture. Hybrid, large-scale distributed sensor nodes are loosely coupled by a message-oriented middleware system called NaradaBrokering (NB) [1], which is a content distribution infrastructure based on the publish/subscribe paradigm.
Sensor Grid Server
Meeting Session
...
Meeting Session...
...
...
Data Flow
Sensor Adapter Control/Visualization
Sensor Adapter
Sensor
Sensor Adapter
Sensor Meeting Client
Message Adapter
Meeting Client
Message Adapter
Meeting Client
Message Adapter
Meeting Client
[image:2.612.72.293.275.477.2]Message Adapter
Figure 2. Implementation Architecture of A Collaborative Sensor Grid
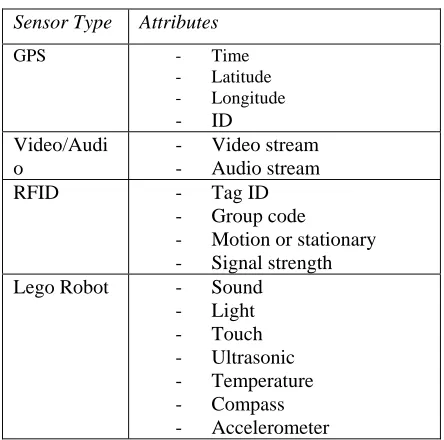
Sensor grids are a combination of sensor networks and grid computing. The underlying service model and robust publish-subscribe messaging provides greater management capabilities [5, 6] and scalability than traditional sensor nets [7-13]. For example, a geo-spatial sensor grid can be used to provide real time position data [2, 3] with on the fly data conversions and hidden Markov model analysis [4, 14]. In our specific example, we used a mobile tablet computer (i.e., Nokia N800, an Internet Tablet PC) which has considerable computing power with supports for both Wi-Fi and Bluetooth connections. Different types of sensors are integrated in our collaborative sensor grid application. They provide various sources of real-time information as follows:
(1) GPS sensor: It is a portable GPS receiver, which receives geospatial location information (e.g., latitude, longitude, etc) from satellites and transfers such information to the Nokia N800 via Bluetooth connection.
N800 tablet, provide video/audio streams that can be published to the sensor grid. We have previously shown that publish subscribe software technology, in particular NaradaBrokering; can support large scale collaborative audio-video streams [15-17].
(3) RFID sensor: The Mantis RFCode M220 reader and RFCode M100 active tags are used. The reader senses information about RFID tags such as the signal strength, motion, temper and panic and encapsulates the information in tag event messages.
While RFID positioning result is not included in this paper, we developed a new RFID positioning algorithm that gave encouraging initial results over LANDMARC (LocAtioN iDentification based on dynaMic Active Rfid Calibration) [18] and LEMT (Location Estimation using Model Trees) [19, 20]. LANDMARC’s indoor accuracy was: 50 % of errors were within 1 meter while the maximum error distance was around 2 meters with 4 RFID readers [18]. LEMT’s indoor accuracy was: 40% of errors were within 0.5meter and 80% of errors were within 1.5 meters with a considerable number of readers and reference tags [19, 20]. According to our initial test results with a new algorithm that we devised and record in the appendix, errors were around 0.5 meter with one reader and one tag only.
(4) Lego Robot: We used the Lego Mindstorm
NXT robots for our application. Two types of robots were assembled. One is a humanoid called Alpha Rex and the other a vehicle called Tribot. In our initial system demonstration, we implemented seven sensor types on the two robots. We equipped the Alpha Rex with sound, ultrasonic, light and temperature sensors and the Tribot with sound, ultrasonic, compass and accelerometer. Their detected information is sent to the PC via the Bluetooth module in the robots. The robot can also act as instructed by taking programmable commands from any collaborative session participants.
[image:3.612.318.540.138.358.2]The two robots also carried external payloads. In this case, the Alpha Rex carried a GPS and an Nokia N800. The Tribot carried a GPS, a Nokia N800 and a Mantis RFID reader. Unlike most RFID use cases in which the reader is stationary, we made the RFID reader a mobile unit by having the Tribot carrying it around a test environment within which there were stationary RFID tags.
Table 1. Sensor Types and Attributes
Sensor Type Attributes
GPS - Time
- Latitude - Longitude
- ID
Video/Audi o
- Video stream
- Audio stream
RFID - Tag ID
- Group code
- Motion or stationary
- Signal strength
Lego Robot - Sound
- Light - Touch
- Ultrasonic
- Temperature
- Compass
- Accelerometer
2.2. Distributed Transport Network
Our approach uses a scalable, hierarchical and collaborative architecture. Hybrid, large-scale distributed sensor nodes are loosely coupled by a message-oriented middleware system called NaradaBrokering (NB) [1], which is a content distribution infrastructure based on the publish/subscribe paradigm. This is overlaid with a fault tolerant management system [5, 6].
Figure 3. Lego Mindstorm NXT Robot-based Collaborative Sensor Grid Application
Architecture
Our sample application of Collaborative Sensor Grid framework is depicted in Figure 3. There are different types of sensors distributed globally. Each sensor (GPS, Video/Audio, RFID, etc) gathers information from the environment and publishes it in real-time. A sensor adapter retrieves data from a connected sensor and communicates to the sensor grid. The adapter provides among other capabilities a service interface to each sensor which facilitates the Grid integration and the Web service based management framework [5, 6]. A sensor adapter processes raw sensor data and may publish refined information encoded in certain message format to the sensor grid. A “sensor grid client”, in our case, a collaborative session client, is running on a computer for presenting such information. It can subscribe to specific topics of the sensor grid in order to receive relevant messages. Different information from different types of sensors will be presented to users through a collaborative session client. In Section 4, we will describe a specific collaborative session client, the Anabas Impromptu for Sensors, that includes multiple collaborative applications called sharedlets and explain how to use Impromptu for Sensors to compose a UDOP and sharing it as a COP among remote, distributed users.
High-speed, reliable physical network is always a key requirement for this system. There are two types of network connections in the architecture: Bluetooth and WiFi. Bluetooth is generally used for the connection between a sensor and its respective sensor adapter since most sensors are Bluetooth enabled. It is efficient
and reliable for transporting data in a short range. For the connection between sensor adapters and sensor grid, WiFi 802.11 protocol is typically used.
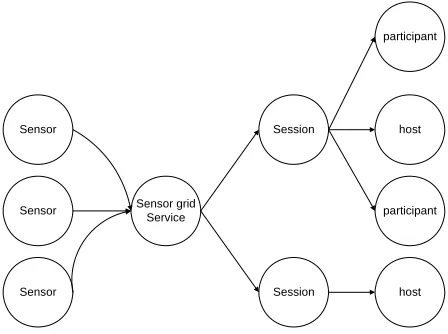
A Sensor Grid may consist of sensor units arranged hierarchically. It communicates with a collaboration grid server where meeting sessions reside. Primary functions of a sensor grid server are to manage and broker sensor message flows. It optimizes bandwidth usage by only forwarding messages to collaborative sessions that need them. This server is stateful and has memory of connections of sensor and meeting sessions. An overview of the sensor data flow architecture is shown in Figure 4. Since the sensor grid and collaboration grid are distributed systems by themselves, this structure makes the system scalable for a large-scaled deployment. The underlying transport layer is in essence a distributed NB network, which has demonstrated high scalability and reliability. With the integration of collaboration grid, users also have a consistent view of extracted, processed and organized information from all those sensors.
Sensor
Sensor grid Service
Session Sensor
Sensor Session host
participant
host participant
Figure 4. Overview of the Collaborative Sensor Grid Data Flow
2.3. Implementation of Sensor Grids
We adopted a general procedure to implement Sensor Grids based on the architecture described before. The major steps include:
1) Establishing the Bluetooth connection between a sensor and a sensor adapter;
2) On the sensor adapter, a filter service extracts useful information from raw data through the established connection;
3) Refined data is encoded in messages and
[image:4.612.329.553.341.508.2]4) On a computer for presentation, a client program subscribes to the specific sensor grid topics in order to receive relevant sensor messages;
5) Retrieved messages are parsed to get
information that users are interested;
6) The information is presented in a defined
collaborative session client for sharing.
We take implementing the GPS sensor grid as a concrete example here:
First, we use a portable tablet Nokia N800 for hosting a GPS sensor adapter, which connects a GPS receiver device (I-Blue) via Bluetooth. The sensor adapter extracts useful information such as latitude, longitude and time from incoming raw data. Then it publishes encoded messages to a sensor grid topic (Streams/GPS/Location1) with a certain frequency (e.g. every 3 seconds).
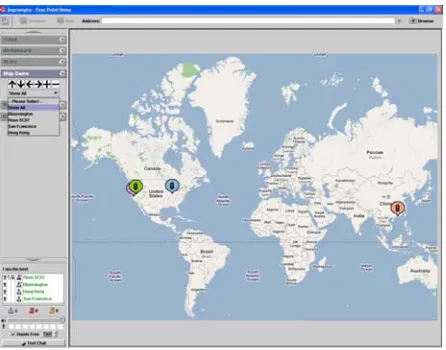
Next, on the computer for presenting GPS information to users, a collaborative session client subscribes to the same topic (Streams/GPS/Location1) in the sensor grid to retrieve real-time data of the GPS location. We use the Google Maps API to show the GPS current location on the map based on its geospatial location information (latitude and longitude). Also, the GPS ID is marked on the map to distinguish it from other GPS sensors.
Finally, the map application is integrated with Impromptu for Sensors as a sharedlet. A user can have a global view of all GPS sensors or select a single GPS location to view its details. The sharedlet also provides functions specific to geographic information such as zoom in, zoom out, and panning the map to different directions.
For other sensors like Video/Audio, RFID and Lego Robot, they are implemented following the same pattern. Major differences between implementing different types of sensors lie in the filter for extracting sensed information from raw data and the presentation interface for such information.
One issue to mention is that several filters may process sensed information collaboratively as a workflow. For example, after a sensor adapter receives raw data from GPS stations it generates and publishes messages through a port in a binary format called RYO. One filter on the client side can decode captured RYO messages into text format. Another filter can convert text format to Geography Markup Language (GML)
format, since different users may be interested in geographic information in different formats [4, 5]. Further research is ongoing to study the issue of workflow in Sensor Grids.
3. SENSOR GRID MANAGEMENT
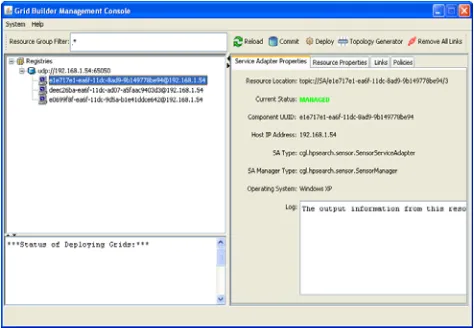
[image:5.612.317.554.425.589.2]Sensor services need to be managed over the network so that users, in this case, collaborative session clients, can find out new sensors, monitor the status of existing sensors and recover from failure by replacing malfunctioning sensors. We extended a generic management framework [22] that is capable of managing any type of service with modest external state [5, 6] for Sensor Grids. Web service based protocols are implemented in the framework to provide interoperable management. A hierarchical bootstrapping mechanism is deployed to scale the management framework over a wide-area. The framework can tolerate failures within the framework itself while service failure is handled by executing user-defined failure handling policies. The unit of management framework consists of a set of manageable services, their associated service mangers, message nodes (to provide a scalable messaging substrate) and a scalable, fault-tolerant data structure called a registry. The system provides fault tolerance to Grid resources including sensors and to the NaradaBrokering messaging subsystem.
Figure 5. Grid Builder Management Tool Interface
view a list of discovered sensor services in the left panel and select one to get more detailed information about it such as its location, the host address and its UUID, etc. The user can also deploy a sensor service on a remote sensor node through the application. Thus, in case one necessary sensor service becomes unavailable due to some reasons, it is still possible to find an alternative sensor to start the same service.
The process of finding new sensors is based on WS-Discovery specification, in which the message exchange between a sensor service adapter and a sensor manager is described as below:
1) Initially a sensor sends a multicast Hello message when it joins a network;
2) The sensor manager multicasts a Probe message with Type and/or Scope to discover existing sensors;
3) A sensor may receive a multicast Probe message and send a unicast Probe Match (PM) if it matches that Probe;
4) The sensor manager multicasts a Resolve message with Name to discover existing sensors;
5) A sensor may receive a multicast Resolve message and send a unicast Resolve Match (RM) if it matches that Resolve;
6) When a sensor leaves a network, it sends a multicast Bye message
7) The sensor manager will add/remove a sensor
when it receives a multicast Hello/Bye message.
The Grid Builder tool follows the idea of constructing grid of grids, which assembles a multitude of subgrids into a mission-specific grid application. In the CSG framework, the Grid Builder tool facilitates the assemblage of two important subgrids, namely a real-time mulreal-timedia collaboration grid and hierarchical, executable sensor grid. For example, many types of sensors have controls for changing their respective behavior and to perform actions. However, the specific action and its corresponding control operation vary from sensors to sensors. To facilitate the control of sensors in an end-user application, the CSG client will support sets of customable controls to be defined by users with Grid Builder. This information will be transmitted to the respective sensor sharedlets in order to construct appropriate buttons for sensor control. We provided some initial sensor sharedlet controls for certain generic sensor types, which will be shown in the next section.
4. VISULIZATION & PRESENTATION
A particular design objective for the CSG client is to provide an intuitive user interface for enabling UDOP (User Defined Operation Picture) and COP (Common Operation Picture) capabilities, which are essential for agile formulation and sharing of visual, situational awareness and effective decision-support.
To have the basic support of sensors, users must be able to visualize sensors’ data and to control sensors. Some basic principles for visualizing sensor are:
1) Groups of geo-located sensors can be
visualized by their geospatial locations;
2) Each sensor can be visualized particularly
based on its property;
3) Sensors can be grouped and visualized on a
single canvas
4) Multiple canvas can be viewed concurrently 5) The state can be captured
Also, each sensor should accept control which can be none. And those control functions should be generated according to sensor’s controllable capability. Multiple sensors can be controlled simultaneously.
[image:6.612.318.541.493.668.2]We used Anabas Impromptu for Sensors as a UDOP/COP solution for defining sharing information from sensors among distributed users. It is a system for real time sharing of sensor streams in addition to web and video conferencing capabilities. Its portal consists of multiple collaborative applications, called sharedlets, which are developed for handling and displaying different types of real time information.
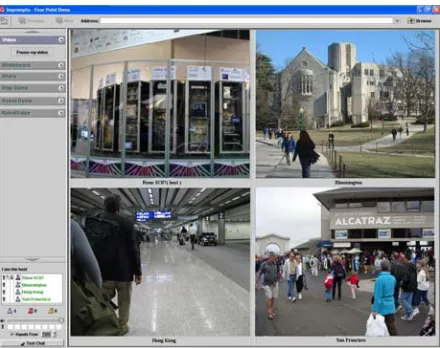
Figure 7. A Video Sharedlet shows and shares four live feeds from four different cities
Figure 6 and Figure 7 show the display for 4 GPS and 4 video (Webcam) sensors, respectively. The GPS sharedlet includes a Google Map with four different GPS locations marked on. Users can use the supported control to zoom in, zoom out, and move the map around via the sensor control tool menu. In the Video sharedlet, there are four windows streaming real time videos from those locations without any user control.
Figure 8. A UDOP composed by selecting from an extensible and filterable list of sensor streams
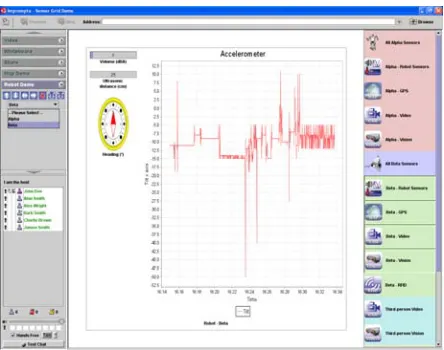
Figure 8 presents a case that a user was in the process of defining a UDOP simply by dragging/selecting sensor information of relevancy from an extensible list of real-time sensor streams in the right hand side panel to one of four visualization windows. In this case, the user selected to show and share the four real-time
streams (light intensity, temperature, ultrasonic and sound level) from sensors carried by an Alpha Rex robot in the upper left visualization window, the four real-time streams (sound level, ultrasonic, compass reading and acceleration) from sensors carried by a Tribot in the upper right window, and real-time stream from the RFID reader carried by the Tribot as an external payload in the lower right.
In Figure 9, the user selected to define an operating picture that places visualization of robot Alpha Rex sensor streams in the upper left window with its geo-spatial information (Bloomington, Indiana) in the upper right window; while at the same time,
visualizing robot Tribot’s sensor streams in the lower left window and its geo-spatial information (San Francisco) in the lower right window.
Figure 9. A UDOP shows and shares the eight real-time sensor streams carried by 2 robots with
their respective geo-spatial information
[image:7.612.72.294.410.582.2]Figure 10. A UDOP shows and shares 4 sensor streams delivered by a Tribot robot
[image:8.612.317.539.69.244.2]Figure 11 is a UDOP similar to that of Figure 10 but sharing in this case the visualization of information from the 4 sensor streams delivered from the sensors carried by an Alpha Rex robot. It shows sound volume at 5 dBA, ultrasonic value of 44 cm and temperature measured at 23.9 degree Celsius with light intensity fluctuating as the robot roamed around.
Figure 11. Another easily composed UDOP
Figure 12 is another user-defined operating being shared instantly by the Impromptu for Sensor client as a common operating picture. In this case, the user chose to share an expanded view of the RFID signal strength as detected by the RFID reader carried by the Tribot robot.
Figure 12. A UDOP shows and shares RFID signal strength of ten active RFID tags
I
5. CONCLUSIONS AND FUTURE
WORKS
We have developed a framework to support easy and rapid development, deployment, management, visualization of collaborative, geospatially located sensor grids with flexibility, extensibility and scalability. Based on the framework, we created sensor grid applications for several types of commonly available sensors, used a Grid Builder tool for discovering and managing those sensors, and provided a rich, informative, easy to use (drag & drop and double clicking metaphors) user interface for presenting real-time sensor data to users according to the UDOP model. Also, we used advanced collaborative technology built on top of message-oriented middleware to enable distrusted users to have a consistent view of such information. The Impromptu for Sensors client immediately and automatically shares a UDOP as a COP for all collaborative session participants.
[image:8.612.72.295.385.556.2]through a workflow to make it more meaningful to users. This is illustrated by the current GPS sensor and simulation grid seen in the Earthquake science example [2-4, 14].
ACKNOWLEGEMENT
We thank Bill McQuay of AFRL, Shrideep Pallickara and Marlon Pierce of the Community Grids Laboratory and Gary Whitted of Ball Aerospace for important suggestions
REFERENCES
[1] The open source NaradaBrokering Project. http://www.naradabrokering.org
[2] Galip Aydin, “Service Oriented Architecture for Geographic Information Systems Supporting Real Time Data Grids”, Indiana University PhD, January 15, 2007 http://grids.ucs.indiana.edu/ptliupages/publications/Gali pAydin-Thesis.pdf
[3] Galip Aydin, Zhigang Qi, Marlon E. Pierce, Yehuda Bock, and Geoffrey C. Fox, “Building a Sensor Grid for Real Time Global Positioning System Data”, in Proceedings of Workshop on Principles of Pervasive Information Systems Design Toronto, May 13, 2007 http://grids.ucs.indiana.edu/ptliupages/publications/Perv asive2007Toronto_PierceSensorGrid-final.pdf
[4] Andrea Donnellan, Jay Parker, Robert Granat, Geoffrey Fox, Marlon Pierce, John Rundle, Dennis McLeod, Rami Al-Ghanmi, Lisa Grant, Walter Brooks, “QuakeSim: Efficient Modeling of Sensor Web Data in a Web Services Environment”, November 30 2007 to be published in 2008 IEEE Aerospace Conference, March 1-8 2008, Big Sky MT http://grids.ucs.indiana.edu/ptliupages/publications/F12
24_3.pdf
[5] Harshwardhan Gadgil, Geoffrey Fox, Shrideep Pallickara, and Marlon Pierce, “Scalable, Fault-tolerant Management of Grid Services”, in Proceedings of IEEE
Cluster, 2007. http://grids.ucs.indiana.edu/ptliupages/publications/mg
mt-cluster-final.pdf
[6] Harshawardhan Gadgil, Geoffrey Fox, Shrideep Pallickara, “Scalable, Fault-tolerant Management in a Service Oriented Architecture”, Poster in pages 235-236 of proceedings for IEEE International Symposium in High-Performance Distributed Computing (HPDC),
June, 2007 http://grids.ucs.indiana.edu/ptliupages/publications/mg
mtArchitecturePaper-POSTER.pdf
[7] Donald F. (Rick) McMullen, Marlon Pierce, Carol Deng, Kia Huffman, “Real-time Web 2.0: Evolution of Middleware for Grid-based Instruments and Sensors”,
Web 2.0 Workshop at The 21st Open Grid Forum - OGF21 Grand Hyatt Seattle Seattle, Washington
October 15-19, 2007 http://www.ogf.org/gf/event_schedule/index.php?id=10
22
[8] ESTO / AIST Sensor Web PI Meeting - February 13-14,
2007, San Diego http://esto.nasa.gov/sensorwebmeeting/
[9] UbITA 2007 Workshop on u-City (Ubiquitous City) http://ubita.org/ October 31-November 2 2007 Konkuk University Korea
[10]ROADNet: Real-time Observatories, Applications and Data Management Network http://roadnet.ucsd.edu/index.html
[11]Center for Embedded Networked Sensing CENS http://research.cens.ucla.edu/
[12]INGRID 2007 - Instrumenting the Grid workshop http://www.ingrid07.cnit.it/
[13]Microsoft eScience 2007 meeting at RENCI UNC
October 21-23 2007 http://research.microsoft.com/workshops/escience2007/
default.aspx
[14]Robert Granat, Galip Aydin, Zhigang Qi, and Marlon Pierce, “GPS Sensor Web Time Series Analysis Using SensorGrid Technology”, American Geophysical Union AGU Fall Meeting, Moscone Conventon Center, San Francisco, CA, USA, 11–15 December 2006. http://www.agu.org/meetings/fm06/
[15]Wenjun Wu, Geoffrey Fox, Hasan Bulut, Ahmet Uyar, Tao Huang, “Service Oriented Architecture for VoIP conferencing”, Special Issue on Voice over IP - Theory and Practice of the International Journal of Communication Systems Volume 19, Issue 4 , Pages 445 - 461 Edited by John Fox and P. Gburzynski http://grids.ucs.indiana.edu/ptliupages/publications/soa-voip-05.doc
[16]Ahmet Uyar and Geoffrey Fox, “Investigating the Performance of Audio/Video Service Architecture I: Single Broker”, Proceedings of the IEEE International Symposium on Collaborative Technologies and Systems CTS05 May 2005, St. Louis Missouri, USA. Pages 120-127.
http://grids.ucs.indiana.edu/ptliupages/publications/Sing leBroker-cts05-submitted.PDF
Missouri, USA. Pages 128-135 http://grids.ucs.indiana.edu/ptliupages/publications/Bro
kerNetwork-cts05-final.PDF
[18]L.M. Ni, Y. Liu, Y.C. Lau, and A.P. Patil, “LANDMARC: Indoor location sensing using active RFID”, In Proceedings of IEEE International Conference in Pervasive Computing and Communications (PerCom), pg 407–415, Dallas, TX, USA, March 2003.
[19]J Yin, Q Yang and LM Ni, “Learning Adaptive Temporal Radio Maps for Signal-Strength-Based Location Estimation”, IEEE Transactions on Mobile Computing, 2007.
[20]J. Yin, Q. Yang, L. Ni, “Adaptive Temporal Radio Maps for Indoor Location Estimation”, In Proceedings of IEEE International Conference on Pervasive Computing and Communications (PerCom), pages 85– 94, Kauai Island, HW, USA, March 2005.
[21]Clemson and Indiana University Team, “Feature - Testing the waters: coastal ecologists look to open source software to manage distributed sensor data”, International Science Grid This Week http://www.isgtw.org/?pid=10008636, February 2008
[22]Harshawardhan Gadgil, “Scalable, Fault-tolerant Management of Grid Services: Application to Messaging Middleware”, Indiana University PhD, April
5, 2007 http://grids.ucs.indiana.edu/ptliupages/publications/hgad
gil-THESIS.pdf
APPENDIX: RFID Positioning Algorithm
The signal strength (expressed as power per unit square) received by a RFID reader from a RFID tag is inversely proportional to the square of the distance between the reader and the tag. So we have
2
1
r
P
∝
.However, the output of the signal strengthreceived by a RFID reader is in dBm. To express an
arbitrary power P as x dBm, we have:
10
10x
P
=
Assume that the signal strength received by a RFID reader from a RFID tag depends on their distance and their surrounding disturbance according to a multiplicative model as follow:
(
Environmen
tal
Factor
)
r
P
∝
1
2⋅
.Suppose that there are a reference tag and a target tag, which follow multiplicative models as below respectively:
(
)
Target 2 Target
Target
1
P
Environmental Factor
r
∝
⋅
(
)
Reference 2 Reference
Reference
1
P
Environmental Factor
r
∝
⋅
We further assume that the effect of the environmental factors on the 2 tags is similar. We can cancel the environmental factors as follows:
2 Target Reference
2 Reference Target
P
r
P
∝
r
A linear model is obtained in the logarithmic space:
Target 0 1 Reference 2 Target
3 Reference
ln
ln
ln
ln
P
a
a
P
a
r
a
r
ε
=
+
+
+
+
By rearranging, we have:
Target 0 1 Reference 2 Target
3 Reference
ln
'
' ln
' ln
' ln
'
r
a
a
r
a
P
a
P
ε
=
+
+
+
+
Substituting
10
10x
P
=
, we get:Target 0 1 Reference 2 Target
3 Reference