International Journal of Innovative Technology and Exploring Engineering (IJITEE) ISSN: 2278-3075, Volume-8 Issue-9S3, July 2019
Abstract: Majority of the consumer loads are of non-linear in nature and bring about deprived quality of power in distribution system. FACTS based DSTATCOM is a compensating device placed in shunt to power line to improve the power quality eliminating the effect of harmonics in source components. The paper presents multi-level DSTATCOM in distribution system to enrich the quality of power. Five-level cascaded H-Bridge structures DSTATCOM is employed to drive with compensating signals for power quality improvement. Five-level DSTATCOM is triggered from multi-carrier LSCPWM pattern. Reference signals are generated from IRP based control theory. The proposed system is capable to compensate for system unbalance, power factor and harmonics in the system. Simulation work of the proposed concept is carried out and the results are presented using MATLAB/SIMULINK software.
Index Terms: Power Quality, Multi-Level, DSTATCOM, LSCPWM, IRP Theory.
I. INTRODUCTION
There is huge dependency on electrical energy in this matured technological world. Supplying qualified power to the utility goods is as important and is a challenging to power sector. Most of the industrial and commercial load applications demand uninterrupted power supply with superior quality. In this modern age with growing industrialization, use of computers and electronic devices became high in number making processes easy, efficient, productive and safe. But the use of these power electronic circuits or computers deteriorates the quality in power deviating from the grid code [1-3]. Decrease in the quality of power [4-6] to the load decreases the production rate and efficiency.
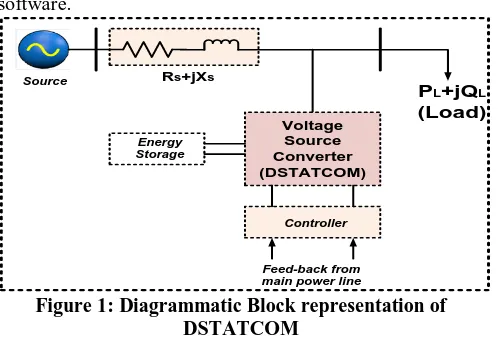
Conventional passive filters as power quality conditioners can improve the power quality but their size, source impedance, resonance problem affect their usage and performance. FACTS based compensators are alternatives to conventional methods to condition the power. FACTS controllers are many types out of which shunt compensators, series compensators and series-shunt combinational devices are used widely. DSTATCOM (static compensator in distribution system) is an example of shunt compensation methods. Diagrammatic Block representation of DSTATCOM is illustrated in figure 1. Any load is said to be non-linear in nature when its respective impedance varies with respect to voltage. Variable impedance implies that the pull-out current will not be a sinusoidal wave though the source is of sinusoidal in nature. Power electronic controllers
Revised Manuscript Received on July 22, 2019.
J. Ganesh Prasad Reddy, Assistant Professor, Department of EEE, Rao Bahadur Y Mahabaleswarappa Engineering College, Bellary, Karnataka.
Dr. K. Ramesh Reddy, Principal, G. Narayanamma Institute of Technology and Science for Women, Shaikpet, Hyderabad, Telangana, India.
like custom power devices [7-10] are modern equipment to improve the quality in power delivered to load. DSTATCOM injects compensating signals to PCC to nullify harmonics.
The paper presents multi-level DSTATCOM in distribution system to enrich the quality of power. Five-level cascaded H-Bridge structures DSTATCOM is employed to drive with compensating signals for power quality improvement. Five-level DSTATCOM is triggered from multi-carrier LSCPWM pattern. Reference signals are generated from IRP based control theory. The proposed system is capable to compensate for unbalance in the system, power factor and harmonics in the distribution system. Simulation work of the proposed concept is carried out and the results are presented using MATLAB/SIMULINK software.
Voltage Source Converter (DSTATCOM)
Energy Storage
Controller
PL+jQL (Load)
Feed-back from main power line
[image:1.595.306.556.325.495.2]Source Rs+jXs
Figure 1: Diagrammatic Block representation of DSTATCOM
II. PROPOSED5-LEVELCHB-MLIBASED DSTATCOM
Conventional square-wave inverter yields square wave output which contains very large quantity of harmonics. This insists for high sized filters to tune the output and bring to form of sinusoidal form. Cost and size of filter increases which becomes a major drawback while using conventional square-wave inverters. Multi-level inverter draws attention due to its meritorious characteristics giving out levelled output. Levelled output requires less sized filters as compared to conventional square-wave inverters. Cascaded H-Bridge topology of multi-level inverters is one of the finest structure requiring no clamping devices or elements. The structure of Cascaded H-Bridge topology is simple in construction but requires more number of DC sources to drive each individual H-Bridge cell.
IRP Control Based LSCPWM-Multilevel
DSTATCOM for Power Quality Improvement
Controller
Non-Linear Load
Feed-back from main power line
Source Rs+jXs
CDC
[image:2.595.305.553.49.196.2]Cascaded H-Bridge Multi-Level DSTATCOM-VSI
Figure 2: Multi-Level DSTATCOM in power distribution system Ph-A Output Vdc1 Vdc2 Ph-B Output Vdc3 Vdc4 Ph-C Output Vdc5 Vdc6
Figure 3: 5-Level Cascaded H-Bridge structure
A five-level cascaded H-Bridge structure consists of two H-Bridge cells cascaded with each individual H-Bridge cell is driven by DC source. Multi-Level DSTATCOM in power distribution system is shown in figure 2. Five-level cascaded H-Bridge structure of multi-level inverters is shown in figure 3. The total DC link voltage is split across two H-Bridge cells and by sequential triggering of power switches gives out five-level output.
III. CONTROLSTRATEGY
I L a b c Compensating Reference Currents * * * , , CB CC CA I I
I Source Reference Currents
I
Sabc_act P W M R e fe r e n c e P u ls e s t o S h u n t C o n v e r te r * * CA LASA I I
I
* *
CB LB SB I I I
* *
CC LC SC I I I
SB SB I I*
SC
SC I
I*
[image:2.595.47.289.51.420.2]PWM Ref_A= ISA* ISA PWM Ref_B= PWM Ref_C= LSCPWM
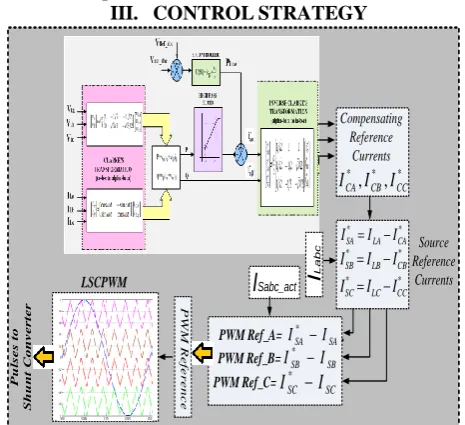
Figure 4: Control algorithm for DSTATCOM
Figure 5: LSCPWM pattern for pulse generation
DSTATCOM mainly eliminates the harmonics in source currents. The reference currents to generate pulses to power switches of DSTATCOM are produced from conventional ‘IRP’ theory. Line voltages and currents are sensed and processed to calculate active and reactive power through Clarke’s transformation procedure. Actual DC-Link voltage is compared to reference value and the error is processed to PI controller to generate power loss component. Actual active power measured before is now processed to summation block where power loss component (from PI controller) and actual active power are compared to generate one of the reference current signals in two co-ordinate system. Inverse transformation gives out the compensating reference signals. The compensating reference signals are compared to line currents from power system to yield source reference currents. The obtained source reference currents are again compared to actual source currents to give out PWM reference signal. PWM reference signal when overlapped with level shifted carrier (LSCPWM pattern) signals (as shown in figure 5) produces pulses to power switches in VSI of DSTATCOM. The complete schematic control algorithm for DSTATCOM is shown in figure 4.
iS iL
[image:2.595.308.542.455.631.2]VS 3-Ph Source Load ZS ZC 5-Level DSTATCOM DSTATCOM Controller ZS ZS ZC ZC
Figure 6: Overall circuit representation of 5-level DSTATCOM with control algorithm
The logic to create the gating signal for switches is that the reference waveform for each phase is compared with these carriers to determine how the phase leg should be switch. Level shifted carrier PWM (LSCPWM) pattern to trigger 5-level DSTATCOM consists of reference signal overlapped on four carrier signals. The four carrier signals has high frequency and are level shifted. Triggering pulses are generated at corresponding point of intersection of reference and carrier signals as shown
in figure 5. Overall circuit of
[image:2.595.49.282.527.739.2]International Journal of Innovative Technology and Exploring Engineering (IJITEE) ISSN: 2278-3075, Volume-8 Issue-9S3, July 2019
power distribution system controlled with IRP based control algorithm is shown in figure 6.
IV. MATLAB/SIMULINKRESULTS A. Balanced Non-Linear Load
Figure 7: Source Voltage
Figure 7 shows three-phase source voltage of distribution system. Three phases of voltage signal are with constant peak and sinusoidal in shape.
Figure 8: Source current
Figure 8 shows the three-phase source currents of distribution system with balanced non-linear load. The load is increased at time instant 0.3 sec and restored to previous load at 0.4 sec. The source current also increases to feed increased load from 0.3 to 0.4 seconds.
Figure 9: Load voltage
Figure 9 shows three-phase load voltage of system with balanced non-linear load. Though, the non-linear load is increased from 0.3 to 0.4 seconds, the load voltage remains with constant peak.
Figure 10: Load current
Figure 10 shows three-phase load currents in distribution system with balanced non-linear load. Load increases from
0.3 sec to 0.4 sec and hence load current raises during that duration.
Figure 11: Source Active and reactive powers
Figure 11 shows the active and reactive power fed from source. During load increased time, active power is also increased to meet load demand. Reactive power almost remains zero irrespective of the system conditions.
Figure 12: Load active and reactive powers
Figure 12 shows the active and reactive power of load. During load increased time, active power is also increased according to load demand. Reactive power almost remains zero irrespective of the system conditions apart from slight fluctuations at load change time.
Figure 13: Compensating currents from DSTATCOM
Figure 14: source power factor
Figure 14 shows source power factor. The angle between source voltage and source current is almost zero and cosine of angle (power factor) in source tends to unity. Source current is gained with value for better appearance.
Figure 15: Load power factor
Figure 15 shows load power factor. The angle between load voltage and load current is very large and cosine of angle (power factor) in load tends decrease far below unity. Load current is gained with value for better appearance.
Figure 16: 5-level output of multi-level DSTATCOM
Figure 16 shows 5-level output of multi-level DSTATCOM. Leveled output voltage of DSTATCOM in three phases is shown.
Figure 17: THD in source current
Figure 18: THD in load current
Figure 17 shows THD FFT window of source current. Source current is distorted by 3.45% and is par within nominal limit. Load is of non-linear type and is distorted by 30.07% as shown in figure 18.
B. Un-Balanced Non-Linear Load
Figure 19: Source Voltage
Figure 19 shows three-phase source voltage of distribution system. Three phases of voltage signal are with constant peak and sinusoidal in shape.
Figure 20: Source current
Figure 20 shows the three-phase source currents of distribution system with un-balanced non-linear load. The load is increased from 100A to 150A at time instant 0.2 sec and restored to 100A load at 0.3 sec and from time instant 0.4 to 0.5 sec. The source current also increases to feed increased load from 0.2 to 0.3 seconds and 0.4 to 0.5 sec.
Figure 21: Load voltage
Figure 21 shows three-phase load voltage of system with un-balanced non-linear load. Though, the non-linear load is increased from 0.3 to 0.4
International Journal of Innovative Technology and Exploring Engineering (IJITEE) ISSN: 2278-3075, Volume-8 Issue-9S3, July 2019
the load voltage remains with constant peak.
Figure 22: Load current
Figure 22 shows three-phase load currents in distribution system with un-balanced non-linear load. Load increases from 0.2 sec to 0.3 sec and also during 0.4 to 0.5 sec and hence load current raises during that particular duration.
Figure 23: Source Active and reactive powers
Figure 23 shows the active and reactive power fed from source. During load increased time, active power is also increased to meet load demand. Reactive power almost remains zero irrespective of the system conditions.
Figure 24: Load active and reactive powers
Figure 24 shows the active and reactive power of load. During load increased time 0.2 to 0.3 sec and 0.4 to 0.5 sec, active power is also increased according to load demand. Reactive power almost remains constant irrespective of the system conditions apart from slight fluctuations at load change time.
Figure 25: Compensating currents from DSTATCOM
Figure 25 shows three-phase compensating currents fed from DSTATCOM to PCC to minimize the effect of harmonics in distribution system.
Figure 26: source power factor
Figure 26 shows source power factor. The angle between source voltage and source current is almost zero and cosine of angle (power factor) in source tends to unity. Source current is gained with value for better appearance.
Figure 27: Load power factor
Figure 27 shows load power factor. The angle between load voltage and load current is very large and cosine of angle (power factor) in load tends decrease far below unity. Load current is gained with value for better appearance.
Figure 28: 5-level output of multi-level DSTATCOM
Figure 28 shows 5-level output of multi-level DSTATCOM. Leveled output voltage of DSTATCOM in three phases is shown.
Figure 30: THD in load current
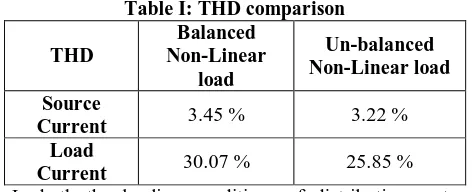
Figure 29 shows THD FFT window of source current. Source current is distorted by 3.22% and is par within nominal limit. Load is of non-linear type and is distorted by 25.85% as shown in figure 30. Table I illustrates the comparison of harmonic distortion analysis in different loading conditions of distribution system.
Table I: THD comparison
THD
Balanced Non-Linear
load
Un-balanced Non-Linear load Source
Current 3.45 % 3.22 %
Load
Current 30.07 % 25.85 %
In both the loading conditions of distribution system, source current distortion is limited below 5% (nominal value).
V. CONCLUSION
Presence of non-linear loads deteriorates power quality by inducing harmonics in source components. FACTS based DSTATCOM controller compensates for harmonics in source currents making source current sinusoidal in shape. Five-level cascaded H-Bridge structured DSTATCOM for harmonic compensator in illustrated in the paper. IRP based control algorithm generates reference currents while multi-carrier LSCPWM drives 5-level DSTATCOM power switches. Simulation results are shown for balanced and unbalanced non-linear loading conditions in power distribution system with 5-level DSTATCOM for power quality enhancement. Harmonic distortion analysis is tabulated and depicts that source current is well within IEEE standards and is analyzed for different load conditions.
REFERENCES
1.Luo H. Xiao F. Ma et al. "Distribution static compensator based on an improved direct power control strategy" IET Power Electron. vol. 7 no. 4 pp. 957-964 2014.
2.R. Kalpana, S. C. Khimavath, S. P. P and B. Singh, "Power Quality Enhancement Using Current Injection Technique in a Zigzag Configured Autotransformer Based 12-Pulse Rectifier," in IEEE Transactions on Industry Applications, 2018 (early access). 3.C. Kumar M.K. Mishra "An improved hybrid DSTATCOM
topology to compensate reactive and nonlinear loads" IEEE Trans. Ind. Electron. vol. 61 no. 12 pp. 6517-6527 2014.
4.A. Patel and A. A. Patel, "Application of DSTATCOM for harmonics elimination and power quality improvement," 2017 International Conference on Energy, Communication, Data Analytics and Soft Computing (ICECDS), Chennai, India, 2017, pp. 3007-3011.
5.T. Zaveri B. Bhalja N. Zaveri "Comparison of control strategies for DSTATCOM in three-phase four-wire distribution system for
power quality improvement under various source voltage and load conditions" Electr. Power Energy Syst. vol. 43 pp. 582-594 2012. 6.G. Mallesham and C. S. Kumar, "Enhancement of power quality
using UPQC for hybrid PEMFC and DFIG based wind energy system connected to weak grid," 2017 International Conference on Technological Advancements in Power and Energy ( TAP Energy), Kollam, India, 2017, pp. 1-6.
7.T. S. Saggu, L. Singh and B. Gill, "Harmonics Mitigation in a Steel Industry Using 11-Level Cascaded Multilevel Inverter-Based DSTATCOM," in Canadian Journal of Electrical and Computer Engineering, vol. 40, no. 2, pp. 110-115, Spring 2017.
8.Y. R. Ashtekar, A. A. Mude and S. A. Khubalkar, "Power quality improvement by using modular multilevel cascade converter based STATCOM," 2018 2nd International Conference on Inventive Systems and Control (ICISC), Coimbatore, India, 2018, pp. 169-173.
9.M. Pradhan and M. K. Mishra, "Dual P-Q Theory based Energy Optimized Dynamic Voltage Restorer for Power Quality Improvement in Distribution System," in IEEE Transactions on Industrial Electronics, 2018 (early access).
10.H. Akagi, Y. Kanazawa, A. Nabae , “Generalized Theory of the Instantaneous Reactive Power in Three Phase Circuits”, in Proc. IPECTokyo’83 Int. Conf. Power Electronics, Tokyo, pp. 1375-1386
AUTHORSPROFILE
J. Ganesh Prasad Reddy obtained BE (EEE) from Karnataka University in 1998, M.Tech from JNTU-Kakinada in 2005 and currently pursuing PhD in JNTU-Hyderabad. He has 18 years of teaching experience. He published around 5 research papers in International journals and presented 2 research papers in IEEE conferences. He organized a workshop on “HVDC, FACTS and Intelligent control techniques under networking activity of TEQIP in 2006. He attended nearly 10 workshops in India. His research areas Power Quality, Power Harmonics & Custom power devices.
Dr. K. Ramesh Reddy obtained B.Tech
from Nagarjuna University in 1985, M.Tech from REC, Warangal in 1989 and Ph.D. from S.V. University, Tirupati in 2004. He has 30 years of teaching experience. He has authored two books “Modeling of power system components” & “Basic circuit Theory”. He organized 4 National conferences and 10 workshops.
He presented around 60 research papers at National & International Conferences and Journals.He is the Member of BOS of several reputed Institutions including JNTUH. He is a Member of IEEE, IE(I), NAFEN, and expert Committee Member of National Board of Accreditation.
He inspected few colleges as an Expert Member of NBA for the Accreditation. He is a reviewer for the National Journal of Institution of Engineers (India), Kolkata & International Journal of IEEE transactions on Power Delivery, Journal of Power Electronics, South Korea and International Journal of Power Electronics & Drives, UK. Presently he is a Member of Technical committee of “International Association of Science & Technology Development (IASTED) conference”, Calgary, Canada. He is also a member of Editorial Board of “World Academy of Science, Engineering and Technology (WASET)”.He Received “Best Engineering
Teacher Award” from ISTE & “Academic Excellence
[image:6.595.51.287.271.367.2]