Abstract: Telecom industry faces crucial competition as new deals are introduced in market daily. Many operators are finding difficult to identify the potential customers with the drastic variations in offers of their competitors. Hence reducing the customer churn is the biggest challenge for telecom operators since the reason for churn is unknown. Due to volume of data, they are not able to predict the cause of customer churn. Appropriate machine learning algorithms help to understand why subscribers leave by finding the relationships between data. This paper applies classification algorithms to predict the behavior of customer retention on a telecom dataset extracted from Kaggle. The performance of the dataset after dimensionality reduction using PCA is also assessed. A comparative analysis on different classification algorithms are made based on the performance metric such as accuracy, precision, recall, log loss and f-score. The developed model performance is shown using ROC and AUC curves. Experimental results shows that after applying PCA, the kernel SVM is found to be effective with the accuracy of 95.5% compared to other classifiers.
Index Terms: Machine Learning, Churn, Classification, accuracy, precision, recall, log loss and f-score.
I. INTRODUCTION
Customer churn creates direct impact on revenues of the companies and hence it is considered as major challenge in service based companies. Finding suitable process to reduce the churn rate becomes essential and most companies have more concern towards the customer retention. They are ready to spend and reduce their profits to block their customers. Retaining old customers is more focused in any service firms as acquisition of new customers is expensive. Also reduction in churn rate contributes to sustainable growth of business. The reason for churn should be analysed well in advance to control churns.
The probable metrics for churning could be number of issues reported, number of issues solved, time taken to solve the issue and feedback rating of customer. A churn model is built from past customer’s churn data and analysing the behaviour (predictor) of customers who churned. A statistical
Revised Manuscript Received on June 13, 2019
R. Suguna, Professor, Computer Science and Engineering, Vel Tech Rangarajan Dr. Sagunthala R&D Institute of Science and Technology, Avadi, Chennai, TamilNadu, India.
M. Shyamala Devi, Associate Professor, Computer Science and Engineering, Vel Tech Rangarajan Dr. Sagunthala R&D Institute of Science and Technology, Avadi, Chennai, TamilNadu, India.
Rincy Merlin Mathew, Lecturer, Department of Computer Science, College of Science and Arts, Khamis Mushayt, King Khalid university, Abha, Asir, Saudi Arabia.
model is built relating the predictors and response (churn) and used for predicting new customers.
The paper is organized in such a way that Section 2 deals with the related works. Section 3 discuss about dimensionality Reduction. Proposed work is discussed in Section 4 followed by the implementation and Performance Analysis in Section 5. The paper is concluded with Section 6.
II. RELATEDWORK
A. Literature Review
Identification of factors that cause customer churn is very important to implement actions towards reduction of churn. A churn prediction model was developed using machine learning techniques to predict customers who are likely to churn. The model was experimented on attributes of engineering and selection. AUC curve was used to prove the performance of the model. Also a customer social network prediction model was built by extracting Social Network Analysis (SNA) features [1]. A new hybrid model was developed by using logistic regression and Naïve Bayes method to predict customer churn and it was proved that hybrid method gives better performance than success rates on individual application of classification algorithms [2].
Nowadays, many service firms are conducting retention campaign which encourages customers and suggest cost-minimizing plans. These campaigns lowered the churn rate by increasing the potential customers resulting in recommendations to service firms [3]. A churn prediction technique has been proposed for mobile telecommunication provider to predict the churning from call pattern changes. Data for one-month interval was taken for assessment and proposed technique used multi classifier to build a model for churn prediction. Results demonstrated good predictive power of the model [4].
It is found that most of the churn prediction models suggest the retention behavior of the customers but does not explain why churn happened. A new model has been proposed by considering organizational competitiveness strategy. Factor analysis was carried out to model the churn predictor [5]. Customer churn has greater value in service industries. A unified framework to handle the imbalance in churn prediction has been addressed by using gradient boosting and weighted random forest techniques and the performance was appreciable [6].
Customer Churn Predictive Analysis by
Component Minimization using
Machine Learning
A survey on six sampling techniques and four rules-generation algorithms were evaluated on publicly available data sets. Results proved that mega-trend diffusion function on genetic algorithm performed well compared to other sampling techniques and rule-generation algorithms [7]. A Rough Set Theory based classification model was proposed to assess the churn rate of Telecom customers. Results show the significant improvement in accuracy compared to existing models [8].
Deep learning techniques are capable of handling large data sizes, discover hidden patterns, detects pattern related to underlying risks of telecom sector. Convolutional Neural Network was used for churn prediction and the model performed well in terms of accuracy [9]. A data mining model was built to predict customer churn using key performance indicators based on call details information. Social behaviour patterns of subscribers were also considered for analysis. Results showed that a strong socially influenced postpaid subscribers churn compared to prepaid customers [10].
III. DIMENSIONALITYREDUCTION
Dimensionality reduction performs the transformation of high dimensional data to lower dimensional data without any loss of information. There are two grouping in dimensionality reduction: Feature selection and Feature Extraction. Feature selection seek at maintenance of only appropriate attributes in the given data set whereas feature extraction focus on finding an optimal set of attributes usually a combination of input attribute without loss of information.
IV. PROPOSEDWORK
In our proposed work, machine learning algorithms are used to predict the Customer churn of the telecom data set. Our contribution in this paper is folded in two ways.
(i)Firstly, the raw dataset is applied to various classifiers
like Logistic, KNN, SVM, Kernel SVM, Naive
Bayes, Random Forest and Decision and the accuracy is compared for predicting the dependent variable customer churn.
(ii) econdly, the dimensionality reduction is done using PCA with 10 components PCA that results in the existence of sensible components to predict the dependent customer churn. The reduced data set is applied to various classifiers like Logistic, KNN, SVM, Kernel SVM, Naive Bayes, Random Forest and Decision and the accuracy is compared for predicting the dependent variable customer churn.
A. Principal Component Analysis
It is the feature extraction method which extracts the new set of variables from the large set of variables in the dataset through linear transformation. The selected variables are the principal components and the steps of PCA are given below.
B. System Architecture
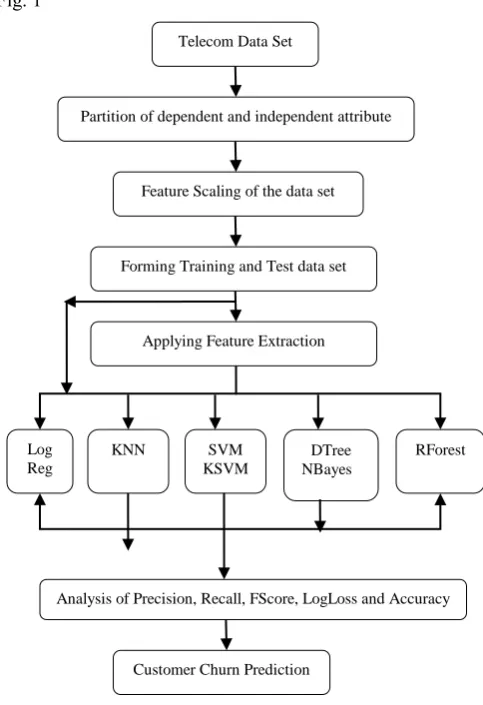
[image:2.595.307.549.83.436.2]The system architecture of our proposed work is shown in Fig. 1
Fig. 1 System Architecture
V. IMPLEMENTATIONANDPERFORMANCE
ANALYSIS
A. Churn Prediction for Feature Extraction
The Telecom Churn dataset from UCL ML Repository is used for implementation with 20 independent attribute and 1 churn dependent attribute. The attribute are shown below.
1. customerID 2. gender 3. SeniorCitizen 4. Partner 5. Dependents 6. tenure 7. PhoneService 8. MultipleLines 9. InternetService 10. OnlineSecurity 11. OnlineBackup 12. DeviceProtection 13. TechSupport
Telecom Data Set
Partition of dependent and independent attribute
Feature Scaling of the data set
Forming Training and Test data set
Applying Feature Extraction
Log Reg
KNN SVM KSVM
RForest
Analysis of Precision, Recall, FScore, LogLoss and Accuracy
19. MonthlyCharges 20. TotalCharges
21. Churn- Dependent Attribute
Telecom Churn dataset is applied to various classifiers like Logistic, KNN, SVM, Kernel SVM, Naive Bayes, Random Forest and Decision and the accuracy is compared for predicting the dependent variable customer churn. The obtained Confusion Matrix is shown in Fig. 2. The ROC and AUC Curve for all the classifiers is shown in Fig. 3 - Fig 5. The performance metric comparison is shown in the Table. 1 and Table. 2.
Fig. 2 Confusion Matrix for Logistic, KNN Kernel SVM , Naive Bayes, Random Forest and Decision Tree Classifier without PCA
Fig. 3 ROC and AUC Curve for Logistic, Kernel SVM , Naïve Bayes, RForest and Decision Tree Classifier without PCA
[image:3.595.310.543.76.336.2]Fig. 4 ROC and AUC Curve for KNN Classifier without PCA
Fig. 5 ROC and AUC Curve for SVM Classifier without PCA Table. 1 Performance Comparison of Precision, Recall and
FScore for all the classifiers before applying PCA Classifier Performance Metrics without PCA
Precision Recall FScore
Logistic Reg 1.00 1.00 1.00
KNN 0.92 0.97 0.94
SVM 1.00 1.00 1.00
Kernel SVM 1.00 1.00 1.00
Random Forest 1.00 1.00 1.00
Naïve Bayes 1.00 1.00 1.00
[image:3.595.47.292.198.409.2]Decision Tree 1.00 1.00 1.00
Table. 2 Performance Comparison of Logarithmic Loss and Accuracy for all the classifiers before applying PCA Classifier Performance Metrics without PCA Logarithmic Loss Accuracy %
Logistic Reg -0.003 to 0.003 100
KNN 0.796 to 0.043 91.4
SVM 0.794 to 0.042 100
Kernel SVM 1.000 to 0.000 100
Random Forest 0.998 to 0.013 99.7
Naïve Bayes 1.000 to 0.000 100
Decision Tree 1.000 to 0.000 100
[image:3.595.51.548.410.821.2]Telecom Churn dataset is applied to PCA and the results of the churn prediction of components for each method is shown in Table. 3 and Table. 4. The optimized components are further processed to all the claasifiers and the obtained Confusion Matrix is shown in Fig. 6. The ROC and AUC Curve for all the classifiers is shown in Fig. 7 - Fig 5.
Table. 3 Performance Comparison of Precision, Recall and FScore for all the classifiers after applying PCA
Classifier Performance Metrics with PCA
Precision Recall FScore
Logistic Reg 0.94 0.97 0.95
KNN 0.87 0.61 0.90
SVM 0.95 0.97 0.96
Kernel SVM 0.95 0.99 0.97
Random Forest 0.92 0.98 0.95
Naïve Bayes 0.91 0.88 0.89
Decision Tree 0.92 0.93 0.92
Table. 2 Performance Comparison of Logarithmic Loss and Accuracy for all the classifiers after applying PCA
Classifier Performance Metrics with PCA
Logarithmic Loss Accuracy %
Logistic Reg 0.834 to 0.074 93.2
KNN 0.796 to 0.043 85.3
SVM 0.796 to 0.149 93.6
Kernel SVM 0.798 to 0.124 95.5
Random Forest 0.998 to 0.013 91.9
Naïve Bayes 1.000 to 0.000 84.3
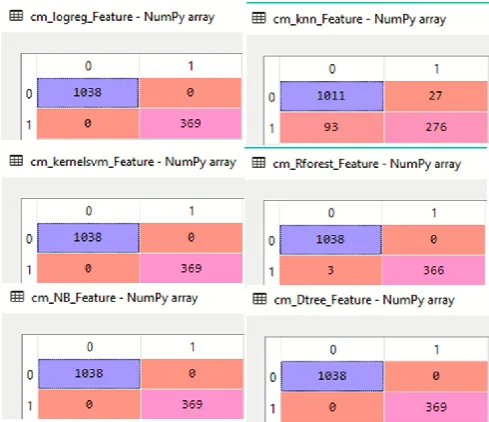
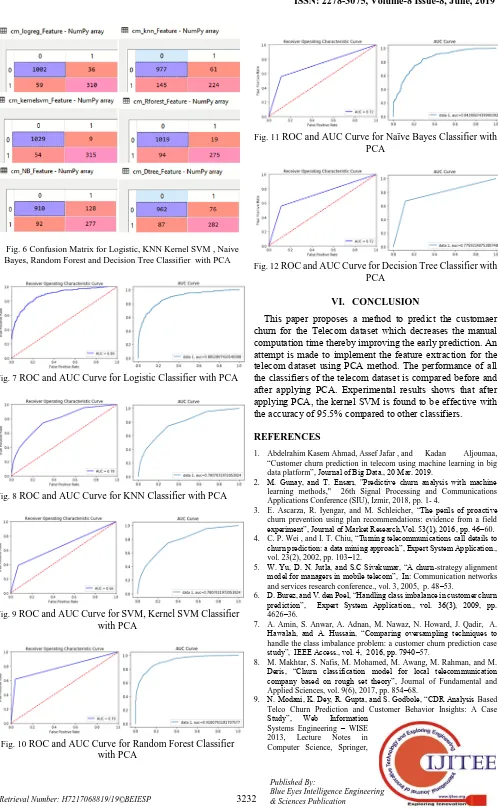
Fig. 6 Confusion Matrix for Logistic, KNN Kernel SVM , Naive Bayes, Random Forest and Decision Tree Classifier with PCA
Fig. 7 ROC and AUC Curve for Logistic Classifier with PCA
Fig. 8 ROC and AUC Curve for KNN Classifier with PCA
Fig. 9 ROC and AUC Curve for SVM, Kernel SVM Classifier with PCA
[image:4.595.46.290.49.262.2]Fig. 11 ROC and AUC Curve for Naïve Bayes Classifier with PCA
Fig. 12 ROC and AUC Curve for Decision Tree Classifier with PCA
VI. CONCLUSION
This paper proposes a method to predict the customaer churn for the Telecom dataset which decreases the manual computation time thereby improving the early prediction. An attempt is made to implement the feature extraction for the telecom dataset using PCA method. The performance of all the classifiers of the telecom dataset is compared before and after applying PCA. Experimental results shows that after applying PCA, the kernel SVM is found to be effective with the accuracy of 95.5% compared to other classifiers.
REFERENCES
1. Abdelrahim Kasem Ahmad, Assef Jafar , and Kadan Aljoumaa, “Customer churn prediction in telecom using machine learning in big data platform”, Journal of Big Data., 20 Mar. 2019.
2. M. Gunay, and T. Ensarı, "Predictive churn analysis with machine learning methods," 26th Signal Processing and Communications Applications Conference (SIU), Izmir, 2018, pp. 1- 4.
3. E. Ascarza, R. Iyengar, and M. Schleicher, “The perils of proactive churn prevention using plan recommendations: evidence from a field experiment”, Journal of Market Research,Vol. 53(1), 2016, pp. 46–60. 4. C. P. Wei , and I. T. Chiu, “Turning telecommunications call details to
churn prediction: a data mining approach”, Expert System Application., vol. 23(2), 2002, pp. 103–12.
5. W. Yu, D. N. Jutla, and S.C Sivakumar, “A churn-strategy alignment model for managers in mobile telecom”, In: Communication networks and services research conference., vol. 3, 2005, p. 48–53.
6. D. Burez, and V. den Poel, “Handling class imbalance in customer churn prediction”, Expert System Application., vol. 36(3), 2009, pp. 4626–36.
7. A. Amin, S. Anwar, A. Adnan, M. Nawaz, N. Howard, J. Qadir, A. Hawalah, and A. Hussain, “Comparing oversampling techniques to handle the class imbalance problem: a customer churn prediction case study”, IEEE Access., vol. 4, 2016, pp. 7940–57.
Berlin, Heidelberg., vol. 8181, 2013
10. Shyamala Devi Munisamy, and Suguna Ramadass Aparna Joshi, “Cultivar Prediction of Target Consumer Class using Feature Selection with Machine Learning Classification (Accepted for publication)”, Springer’s book series entitled “Learning and Analytics in Intelligent Systems, Springer, 2019 to be published.
11. Suguna Ramadass, and Shyamala Devi Munisamy, Praveen Kumar P, Naresh P, “Prediction of Customer Attrition using Feature Extraction Techniques and its Performance Assessment through dissimilar Classifiers(Accepted for publication)”, Springer’s book series entitled “Learning and Analytics in Intelligent Systems, Springer, 2019 to be published.