Predictive Analysis of Cryptocurrencies for
Developing an Interactive Cryptocurrency Chatbot
using IBM Watson Assistant
A. Shamila Ebenezer, S.Jebapriya, B.Jefferson Raja Bose
Abstract: The main objective of this paper is to analyze the characteristics and features that affects the fluctuations of cryptocurrency prices and to develop aninteractive cryptocurrencychatbot for providing the predictive analysis of cryptocurrency prices. The chatbot is developed using IBM Watson assistant service. The predictive analytics is performed by analyzing the datasets of various cryptocurrencies and applying appropriate time series models. Time Series Forecasting is used for predicting the future values of the prices. Predictive models like ARIMA model is used for calculating the mean squared error of the fitted model. Facebook’s package prophet () which implements a procedure for forecasting time series data based on an additive model where non-linear trends are fit with yearly and weekly seasonality are further used to predict cryptocurrency prices.
Index Terms: Time series data analytics, ARIMA, Cryptocurrency, prophet, Watson
I. INTRODUCTION
Today cryptocurrencies have become a global phenomenon known to most people. The main objective of the paper is to analyze the characteristics and features that affects the fluctuations i.e. highs and lows of cryptocurrency prices and to implement the predictive analysis of the same using machine learning techniques. The cryptocurrency price data is sourced from the kaggle dataset, coinmarketcap and blockchain info.
The popular ARIMA model for time series forecasting is used for fifteen different cryptocurrency datasets to forecast the fluctuations in the future price. Acryptochat bot is implemented using IBM Watson Assistant, an interactive platform where the users can get to know the present, past and future prices of cryptocurrencies. This platform would help the investors know better about the ups and downs of the financial world which indeed would help them to make better investment.
The financial transactions in cryptocurrencies and bitcoins are recoded by blockchain. When the transactions are made, the block will be created. This transaction details are broad coasted to all the nodes in the network. The validity of the block was done by one of the nodes.
Revised Manuscript Received on August 05, 2019.
A.Shamila Ebenezer, Department of Computer Science and Engineering, Karunya Institute of Technology and Sciences, Coimbatore, India
S.Jebapriya, Department of Computer Science and Engineering, Karunya Institute of Technology and Sciences, Coimbatore, India
B.Jefferson Raja Bose, Department of Mechanical Engineering, Karunya Institute of Technology and Sciences, Coimbatore, India
The nodes add the block to their chain of blocks if the block is verified and the block correctly references the previous block. Each transaction is transparent and any changes can be easily traced and detected[1]. The performance of Blockchain protocols is restricted by two parameters, block size and block interval. Increasing block size improves throughput, but the bigger blocks take longer to spread in the network [2]. Transacting of money is extremely slow process, sometimes it takes upto 48 hours for bitcoins to send from one user to another. But Dash is the only cryptocurrency that transfer money instantly[3]. Even many improvements were made over the years, the use of bitcoin is very susceptible at present. The untrusted transaction should be avoided. If more people start to use the bitcoin, there may be the possibility of new innovative attacks. Therefore the bitcoin security is uncertain in the future [4]. The functioning of cryptocurrencies like Bitcoin ultimately depends on participants’ agreements to selectively disclose or conceal information.[5]. Since the cryptocurrencies have a diversified portfolio risks and also the correlations between the cryptocurrencies and traditional assets are consistently low, the average return from the cryptocurrencies are more than that of the traditional investments. [6]. When the investments are made in several cryptocurrencies, there is a substantial potential for risk reduction in comparison to the investing in the single cryptocurrency. [7]
Bitcoin in particular is found to be more subject to long-lived explosivity. Further analysis emanating from a logistic regression shows that the explosive periods in one cryptocurrency generally depends on the presence of explosivity in other cryptocurrencies[8].
Stosic et. al., quantify the collective behavior of the market of cryptocurrencies through the correlations of 119 of their constituents and discovered that most eigen values in the spectrum of the cross correlation matrix do not agree with the universal prediction of random matrix theory.[9]
Corbet et.alanalysed the three popular cryptocurrencies and variety of other financial assets. Time variation in the linkages reflects external economic and financial shocks. Further research is needed to observe the behavior of cyrptocurrencies with respect to monetary policy and regulatory arbitrage [10].
While still somehow not understood by most of them, example: banks, governments and many companies are aware of its importance. Cryptocurrency and its underlying technology blockchain are game changing technologies that are reshaping and revolutionizing the world economy.
A unique attribute of a cryptocurrency, and its most attraction, is its non-dependence nature; it is not issued by any central authority, representation of itis immune to government interference or manipulation.
There were over 17 million bitcoins in with a total market value of $140 billion in circulation as of May 2018. [13]. The successof Bitcoin has brought forth a number of competing cryptocurrencies, such as Litecoin ethreum. Predicting the future fluctuations of cryptocurrency prices have been in trend nowadays to invest in the digital currency at the right time.
The vital reasonable problem in forecasting is that the "cases" (that is, the time periods) used to make predictions never form a random sample from the same population as the time periods about which you make the predictions. Ex: Monthly sales in department stores.
Another problem that comes in time-series forecasting is that we rarely know the true shape of the distribution with which we are working. While knowing that assumption is not fully accurate, workers in other areas often assume normal distributions.
II. METHODOLOGY
The methodology followed for evaluating the forecast error and accuracy of the cryptocurrency prices is shown in Figure.2.1. It starts with data processing, in this data cleaning, data integration, data reduction is carried out. Here for the analysis eighteen datasets are taken into account. In data cleaning the missing values and inconsistencies in the datasets are resolved. After data cleaning different cryptocurrencies have been integrated into one unit by data integration. In data reduction, some of the values of cryptocurrency datasets areeliminated for the model development. Therefore, it reduces the volume but produces the same or similar analytical results.
After data processing feature selection are carried out. Featured selectionis the process of extracting useful information or features from existing data. Based on the features that are useful for analysis and model developmentthe attributes such as date of observation, opening price, highest price, lowest price and closing price on the given day are selected.
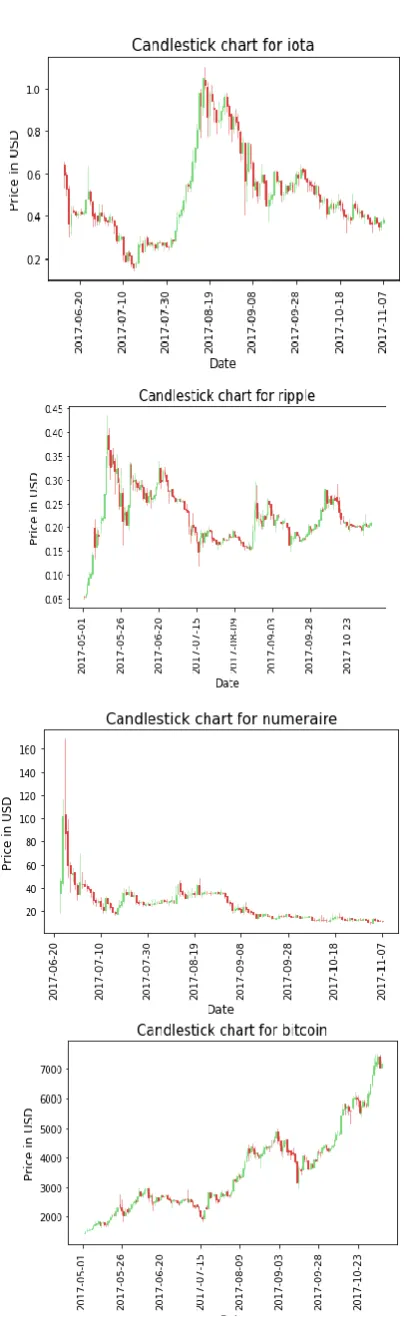
Analyzing the datasets of various cryptocurrencies are carried out by CandleStick Charts, Correlation Map such as Spearman Correlation Map, Pearson Correlation Map, Kendall Correlation Map. Packed information for Multiple time frames are converted into single price bars inCandleStick Charts. Monotonic relationships (whether linear or not),is assessed by Spearman's correlation . A perfect Spearman correlation of +1 or −1 occurs,if there are no repeated data values and when each of the variables is a perfect monotone function of the other. The most recognizable measure of dependence between two quantities is the Pearson product-moment correlation coefficient, or "Pearson's correlation coefficient", commonly called simply "the correlation coefficient". It is achieved by dividing the covariance of the two variables by the product of
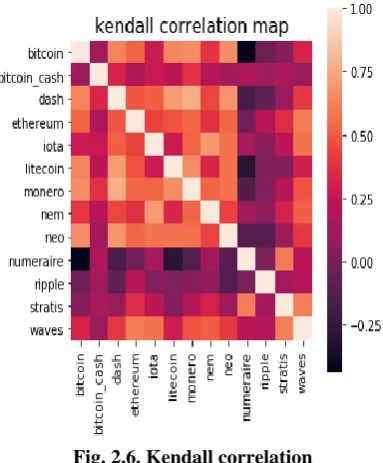
their standard deviations.In statistics, the Kendall rank correlation coefficient, is a statistic used to measure the ordinal association between two measured quantities.
Fig.2.1 Architecture Diagram
The time series forecasting using facebook’s package prophet() and ARIMA Model are carried out for various cryptocurrencies[14][15].
A. Data Preprocessing
A total of 18 cryptocurrencies datasets were collected from sources such as Blockchaininfo, Coinmarketcap, and Kaggle. The datasets are pre-processed into a more user understandable format. The dataset consists of many unknown values. These were processed and removed. Other unwanted necessary data were also omitted. As the size of the dataset is reduced, the running time for the analysis and prediction also decreases[16]. Tasks in data preprocessing are:
i)Data cleaning: The process of data cleaning involves filling missing values, smooth noisy data and resolve inconsistencies. In this analysis, which consist of 18 datasets, required filling of the missing values and resolving inconsistencies. For example, the dataset of Bitcoin_cash_price consists of two columns i.e. MarketCap and Volume, whose values are unknown. Therefore, ignoring these attributes reduced the dataset size and running time.
ii)Data integration: The process of data integration involves integrating data from multiple databases or files. Cryptocurrency price analysis consist of 18 datasets of different cryptocurrencies, which has been integrated into one unit.
B. Feature Selection
Feature selection refers to the process of extracting useful information or features from existing data. This process is used for the selection of meaningful inputs that are used to find the appropriate output.
The features that are selected and which are useful for the forecast are
Date : date of observation
Open : Opening price on the given day High : Highest price on the given day Low : Lowest price on the given day Close : Closing price on the given day
C. Analysis of Closing price of various cryptocurrencies:
The closing price denotes the value for which the cryptocurrency prices are closed at the given day. The prices
are denoted in USD and the date is denoted in the dd-mm format. An analysis of closing price of various
Fig. 2.2 Closing price distribution of cryptocurrencies It is observed from Fig. 2.2 that the closing price of bitcoin, bitcoin_cash, etherum and dash are comparatively higher than the other cryptocurrencies.
Fig. 2.3. Candlestick chart analysis of closing price distribution of cryptocurrencies
2.5 Analysis of correlation between cryptocurrency prices
Monotonic relationships (whether linear or not),is assessed by Spearman's correlation. When there are no repetitive data values, anideal Spearman correlation of +1 or −1 occurs when each of the variables is a just right monotone function of the other.
Fig.2.4. Spearman correlation
[image:6.595.324.533.112.314.2]The most familiar measure of dependence between two quantities is the Pearson product-moment correlation coefficient, or "Pearson's correlation coefficient", commonly called simply "the correlation coefficient". It is obtained by dividing the covariance of the two variables by the product of their standard deviations.[17]
Fig.2.5. Pearson Correlation
[image:6.595.332.519.408.621.2]Fig. 2.6. Kendall correlation From Figure2.4,2.5 and2.6 it is observed that all the correlation maps show similar correlation amongst the compared bitcoins.
III. TIME SERIES FORECASTING OF CRYPTOCURRENCY PRICES
In this work the Time series analysis is performed to predict the future prices of the cryptocurrency. The ARIMA model and the FB prophet model were used for the time series analysis.
A. Time Series Forecasting using ARIMA model ARIMA models are a popular and flexible class of forecasting model that utilize historical information to make predictions. This type of model is a basic forecasting technique that can be used as a foundation for more complex models.
Non-seasonal ARIMA models are generally
denoted ARIMA(p,d,q) where parameters p, d, and q are non-negative integers, p is the order (number of time lags) of the autoregressive model, d is the degree of differencing (the number of times the data have had past values subtracted), and q is the order of the moving-average. The forecast error and accuracy error[18] is calculated as follows:
100%
Actual Forecast
Forecast Error
Actual
0,100%
Forecast Accuracy
Maximum
Forecast Error
[image:7.595.310.546.50.261.2]The forecast accuracy of the ARIMA model for different cryptocurrencies is estimated to be 98.26% and the forecast error was 1.7%. The mean square error 39.77%.
[image:7.595.315.541.330.592.2]Fig. 3.1 Stationarity graph
Figure 3.1 shows the Stationarity graph of a cryptocurrency where mean, std and original values are taken and Figure 3.2 shows ACF And PACF Graph of a cryptocurrency to calculate the AR, I, MA values.
Fig 3.2 ACF And PACF Graph of a cryptocurrency to calculate the AR, I, MA values
Table 3.1 ARIMA model results
Model: ARIMA(5, 1, 0) Log Likelihood -9154.460
Method: css-mle S.D. of
innovations
61.301
Date: Mon, 29 Jan
2018
AIC 18322.919
Time: 16:18:32 BIC 18360.796
Sample: 11-06-2017
04-28-2013
Table 3.2 Dependentfactor table
Real Imaginary Modulus Frequency
AR.1 -1.319
-1.1946j 1.7797 -0.3829
AR.2
-1.319
+1.1946j 1.7797 0.3829
AR.3 2.552 -0.0000j 2.5523 0
AR.4 1.376 -2.0559j 2.4743 -0.1561
AR.5 1.376 +2.0559j 2.4743 0.1561
Table 3.3 ARIMA model roots table
Coef std
err
Z P>|z| [0.025] [0.975]
Const
-4.2269
1.616 -2.61
0.009 -7.395 -1.059
ar.L1.D.Close 0.0086 0.025 0.35 0.726 -0.04 0.057
ar.L2.D.Close 0.0457 0.025 1.83 0.066 -0.003 0.095
ar.L3.D.Close 0.0469 0.025 1.88 0.06 -0.002 0.096
ar.L4.D.Close
-0.0539
0.025 -2.16
0.031 -0.103 -0.005
ar.L5.D.Close 0.0202 0.025 0.8 0.419 -0.029 0.069
The summary of the ARIMA model is shown in Table 3.1, the dependent factor table which shows coefficients error as the main factors is given in Table 3.2 and the ARIMA model roots table which shows real, imaginary, modulus and frequency are shown in Table 3.3.
B. Time Series Forecasting using fbprophet ():
Prophet is a procedure for forecasting time series data. It is based on an additive model where non-linear trends are fit with yearly and weekly seasonality, plus holidays. It works best with daily periodicity data with at least one year of historical data. Prophet is robust to missing data, shifts in the trend, and large outliers.
[image:8.595.310.545.140.374.2]The Core Data Science team at Facebook recently published a new method called Prophet, which enables data analysts and developers alike to perform forecasting at scale in Python3.
Fig.3.3. Weekly and yearly trends of a cryptocurrency from year 2014-18
Fig. 3.4Fbprophet() Graph of cryptocurrency from year 2014-18 showing the accuracy rate
The accuracy of the ARIMA model and the prophet was found to be similar. However, the prophet model works best with daily periodicity data with at least one year of historical data.Prophet is robust to missing data, shifts in the trend, and large outliers.
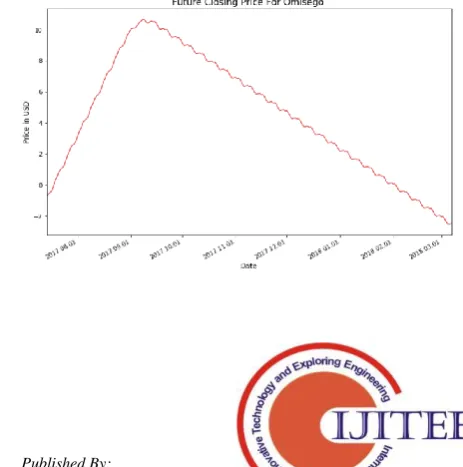
C. Future closing price of various cryptocurrencies.
[image:8.595.60.277.567.768.2] [image:8.595.309.541.577.811.2]a.ClosingPriceForOmisegofrom2017-18 b.Ethereum Classic From 2016-18
c. Closing Price For Waves from 2017-18 d. Closing Price For Dash from 2014-18
e. Closing Price For Ethereum from 2015-2018 f. Closing Price For Litecoin from 2013-2017
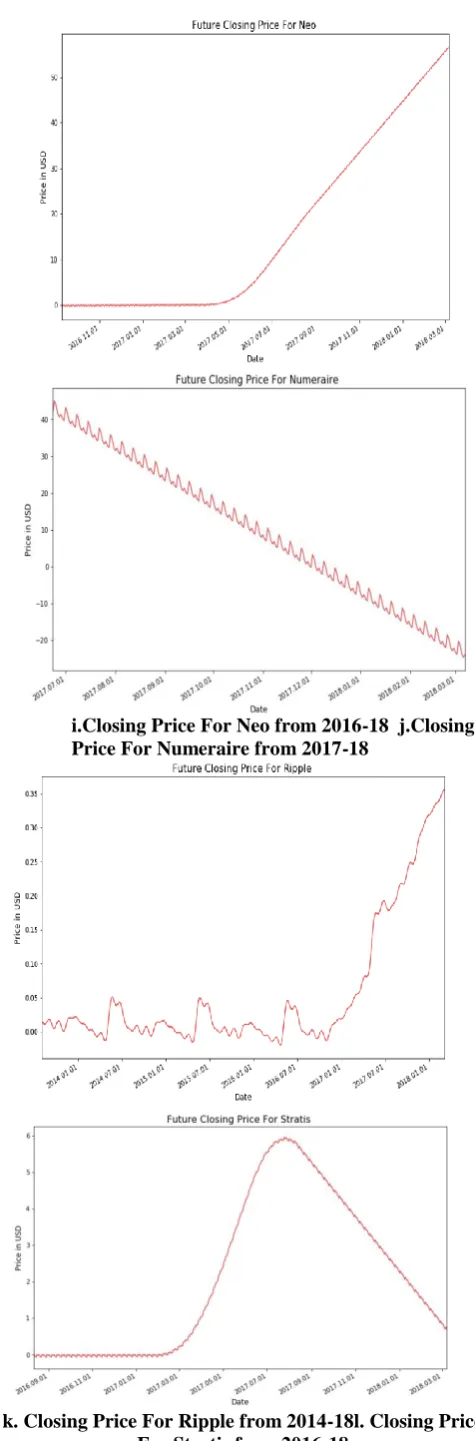
i.Closing Price For Neo from 2016-18 j.Closing Price For Numeraire from 2017-18
k. Closing Price For Ripple from 2014-18l. Closing Price For Stratis from 2016-18
m. Closing Price For Waves from 2016-18 n. Closing Price For Iota from 2017-18
[image:10.595.47.285.44.766.2]Fig 3.5 (a-n) Future Closing Prices of cryptocurrencies For testing, all the respective cryptocurrency dataset is divided into training and testing datasets. ARIMA package have been used to build the model and train on historical data. The fitted model is used to forecast the future values of the prices and generate the forecasted dataset. The mean square error value is calculated along with the root mean square error values. This is implemented for fifteen different cryptocurrency dataset. Forecast accuracy and error values are also calculated for the same. Table 3.4 summarizes the test results of the analysis done:
Table 3.4 Test results for forecast accuracy and forecast error
Sno .
Cryptocurrenc y dataset
RMS E
Forecast Accurac y
Forecas t error
1. Dash 0.709 87.355 12.644
2. Ethereum 0.488 51.580 48.419
3. Iota 0.047 97.504 2.495
4. Waves 0.093 95.790 4.209
5. Stratis 0.008 77.944 22.055
6. Bitcoin_cash 40.297 95.323 4.676
[image:10.595.313.547.49.401.2]IV. INTERACTIVE CRYPTOCURRENCY CHATBOT
[image:11.595.53.265.207.680.2]Using the results of the forecasted dataframe of fifteen different cryptocurrency prices, a cryptochat bot has been implemented using IBM Watson Assistant, an interactive platform where the users can get to know the present, past and future prices of cryptocurrencies. This platform would help the investors know better about the ups and downs of the financial world which indeed would help them to make better investment. Figure 4.1 shows snapshots of the Interactive cryptocurrency chatbot trained for cryptocurrency prices of past, present and future values of fifteen different cryptocurrencies.
Fig. 4.1 Interactive cryptocurrency chatbot trained for cryptocurrency prices of past, present and future values
of fifteen different cryptocurrencies
V. CONCLUSION
Predictive analysis of cryptocurrency prices is a boon for investors for future predictions of the price fluctuations.
train on historical data. The popular ARIMA model for time series forecasting is implemented for fifteen different cryptocurrency datasets and also plotted future fluctuation graphs for them using the forecasted datasets which was generated using Facebook’s package Prophet().Forecast accuracy and error values are calculated for the fifteen different cryptocurrency datasets. Using these results a cryptochat bot has been implemented using IBM Watson Assistant, an interactive platform where the users can get to know the present, past and future prices of cryptocurrencies. This platform would help the investors know better about the ups and downs of the financial world which indeed would help them to make better investment.
REFERENCES:
1. M. Banerjee, J. Lee, and K.-K. R. Choo, “A blockchain future to Internet of Things security: A position paper,” Digit. Commun. Networks, no. September 2017, pp. 1–12, 2017.
2. I. Eyal, A. E. Gencer, E. G. Sirer, and R. van Renesse, “Bitcoin-NG: A Scalable Blockchain Protocol,” 2015.
3. A. Phillip, J. Chan, and S. Peiris, “A new look at Cryptocurrencies,” Econ. Lett., vol. 163, pp. 6–9, 2018.
4. I. S. Mehta, A. Chakraborty, T. Choudhury, and M. Sharma, “Efficient approach towards bitcoin security algorithm,” 2017 Int. Conf. Infocom Technol. Unmanned Syst. Trends Futur. Dir. ICTUS 2017, vol. 2018–Janua, pp. 807–810, 2018.
5. S. Geiregat, “Cryptocurrencies are (smart) contracts,” Comput. Law Secur. Rev., vol. 000, pp. 1–6, 2018.
6. D. L. Kuo Chuen, L. Guo, and Y. Wang, “Cryptocurrency: A New Investment Opportunity?,” SSRN Electron. J., pp. 1–54, 2017. 7. A. Brauneis and R. Mestel, “Cryptocurrency-portfolios in a
mean-variance framework,” Financ. Res. Lett., no. February, pp. 1–6, 2018. 8. E. Bouri, S. J. H. Shahzad, and D. Roubaud, “Co-explosivity in the
cryptocurrency market,” Financ. Res. Lett., 2018.
9. D. Stosic, D. Stosic, T. B. Ludermir, and T. Stosic, “Collective behavior of cryptocurrency price changes,” Phys. A Stat. Mech. its Appl., vol. 507, pp. 499–509, 2018.
10. S. Corbet, A. Meegan, C. Larkin, B. Lucey, and L. Yarovaya, “Exploring the dynamic relationships between cryptocurrencies and other financial assets,” Econ. Lett., vol. 165, pp. 28–34, 2018. 11. J. Fry and E. T. Cheah, “Negative bubbles and shocks in
cryptocurrency markets,” Int. Rev. Financ. Anal., vol. 47, pp. 343– 352, 2016.
12. D. Stosic, D. Stosic, T. B. Ludermir, and T. Stosic, “Nonextensive triplets in cryptocurrency exchanges,” Phys. A Stat. Mech. its Appl., vol. 505, pp. 1069–1074, 2018.
13. “Cryptocurrency Definition | Investopedia.” [Online]. Available: https://www.investopedia.com/terms/c/cryptocurrency.asp.
[Accessed: 16-Jul-2018].
14. “Time Series Forecasting With Prophet.” [Online]. Available: https://www.johnwittenauer.net/time-series-forecasting-with-prophet/. [Accessed: 24-Jul-2018].
15. “How to Create an ARIMA Model for Time Series Forecasting with
Python.” [Online]. Available:
https://machinelearningmastery.com/arima-for-time-series-forecasting-with-python/. [Accessed: 24-Jul-2018].
16. “Simple Exploration Notebook - Cryptocurrencies | Kaggle.”
[Online]. Available:
https://www.kaggle.com/sudalairajkumar/simple-exploration-notebook-cryptocurrencies. [Accessed: 24-Jul-2018].
17. “Cryptocurrency-Pricing-Analysis.” [Online]. Available:
https://cdn.patricktriest.com/blog/images/posts/crypto-markets/Cryptocurrency-Pricing-Analysis.html. [Accessed: 24-Jul-2018].
18. “Measuring Forecast Accuracy: Approaches to Forecasting : A Tutorial | Supply Chain Resource Cooperative | NC State University.” [Online]. Available: https://scm.ncsu.edu/scm-
articles/article/measuring-forecast-accuracy-approaches-to-forecasting-a-tutorial. [Accessed: 24-Jul-2018].
JEBA PRIYA S. is working as an Assistant Professor in the Department of Computer Sciences Technology, Karunya Institute of Technology and Sciences, Coimbatore.Her area of research is in the field of Computer Networks, Machine Learning and Pattern Techniques. She has published ten papers in reputed journals includes Scopus indexed and Springer.
AUTHORS PROFILE
SHAMILA EBENEZER A. is working as Assistant Professor in the Department of Computer Sciences and Engineering, Karunya Institute of Technology and Sciences, India