Article
Vulnerability of Maize Yields to Droughts in Uganda
Terence Epule Epule1,*, James D. Ford1, Shuaib Lwasa2and Laurent Lepage3
1 Department of Geography, McGill University, 805 Sherbrooke St West, Burnside Hall 614,
Montreal, QC H3A 0B9, Canada; [email protected]
2 Department of Geography, Makerere University, P.O. Box 7062, Kampala, Uganda; [email protected] 3 Institut des Sciences De L’environnement, Universitédu QuébecàMontréal, Case postale 8888,
Succursale Centre-ville Montréal, Montréal, QC H3C 3P8, Canada; [email protected] * Correspondence: [email protected]; Tel.: +1-514-400-1780 or +1-438-887-4528
Academic Editor: Athanasios Loukas
Received: 22 September 2016; Accepted: 17 February 2017; Published: 2 March 2017
Abstract:Climate projections in Sub-Saharan Africa (SSA) forecast an increase in the intensity and frequency of droughts with implications for maize production. While studies have examined how maize might be affected at the continental level, there have been few national or sub-national studies of vulnerability. We develop a vulnerability index that combines sensitivity, exposure and adaptive capacity and that integrates agroecological, climatic and socio-economic variables to evaluate the national and spatial pattern of maize yield vulnerability to droughts in Uganda. The results show that maize yields in the north of Uganda are more vulnerable to droughts than in the south and nationally. Adaptive capacity is higher in the south of the country than in the north. Maize yields also record higher levels of sensitivity and exposure in the north of Uganda than in the south. Latitudinally, it is observed that maize yields in Uganda tend to record higher levels of vulnerability, exposure and sensitivity towards higher latitudes, while in contrast, the adaptive capacity of maize yields is higher towards the lower latitudes. In addition to lower precipitation levels in the north of the country, these observations can also be explained by poor soil quality in most of the north and socio-economic proxies, such as, higher poverty and lower literacy rates in the north of Uganda.
Keywords:Uganda; vulnerability; sensitivity; exposure; adaptive capacity; droughts; maize; spatial pattern
1. Introduction
The climate in most African countries south of the Sahara is warming, as seen in a 0.2–2.0◦C increase in temperatures during the past 35 years [1]. The rain-fed character of agriculture in Africa presents significant challenges [1–9], with small-scale farmers responsible for most agricultural production in Sub-Saharan Africa (SSA) and least equipped to adapt [10,11]. The need for new integrative approaches that monitor resilience, adaptive capacity, vulnerability and the sensitivity of African agriculture to droughts is urgent [12,13] because the effects of droughts will be reflected in the degree of vulnerability, exposure, sensitivity and adaptive capacity of cropping systems [12–18].
In Uganda, agriculture contributes about 20% to the gross do mestic product (GDP), 48% to export earnings [19] and employs about 73% of the population. More than four million households depend on small-scale farming for their livelihoods [19], with poverty reduction contingent on improvements in agriculture [16,19,20]. Agricultural systems in Uganda are highly sensitive to climatic conditions, and major droughts in the last decade have had significant impacts, including in 2006 that resulted in higher food prices and droughts in 2008, 2009, 2010 and 2011, which compromised hydro-power generation and livestock and food production. The damages associated with the 2010 and 2011 droughts led to
Water2017,9, 181 2 of 17
a deficit of 2.8 trillion (2.8×10¹²) Uganda shillings, an equivalent of US$ 1.2 billion (US$1.2×10⁹); or 7% of Uganda’s GDP [21,22].
Downscaled climate scenarios for Uganda illustrate that temperature increases are more consistent to the GCM projections than precipitation. The rise in temperature may still not, however, reach the 5.8◦C projected [23]. Mean daily precipitation projections for Uganda show that for the period of March, April and May, precipitation will increase by about 6.4 mm during 2071–2100; this is higher than the increase of 6.2 mm recorded during the period of 1961–1990. The other seasons, June, July, August and September, October, November, still had higher mean daily precipitation during 1961–1990 than projections for 2071–2100. These projections show that precipitation will be improved for sowing and harvesting in the south of Uganda since the season of March, April and May covers the growing season months for maize in the south. In the north, for March, April and May, the projected rise in precipitation will only be good for sowing with the growing period affected negatively. Temperature projections show that there will be a rise in mean daily temperatures for March, April and May from 23.0 to 23.9◦C for the 1961–1990 and 2071–2100 periods, respectively. June, July, August and September, October, November will also have higher 2071–2100 temperatures than 1961–1990 [23–26]. However, recent reports from the famine early warning systems network indicate that there has been an increase in seasonal mean temperature in many parts of Uganda, Ethiopia and Kenya. Regional climate models suggest drying over most parts of Uganda, Kenya and South Sudan in August and September by the end of the 21st century, all associated with a weakening Somali jet and Indian Ocean monsoon. Declines in surface water discharge in the Upper Nile Basin of Uganda have also been recorded. Projection of surface temperature changes over east Africa may approach 6◦C by 2100 in an extreme scenario, while more conservative changes show increases just around the 2◦C mark. In the case of precipitation, projections show changes in the range of +20% or−20% by the year 2100 [1,23].
Maize (Zea mays) is among the most widely-cultivated crops in the world (maize, wheat, rice, soybeans, barley, sorghum) and the most affordable and most widely grown in Africa and Uganda [10,27,28]. In Uganda, maize is a common staple food consumed as fermented dough, roasted, used as corn porridge or converted into beer and is produced primarily (~90%) by small-scale farmers [20,29–32]. The spatial pattern of vulnerability of maize yields to droughts in Uganda is unclear; however, because of rising temperatures and declining precipitation, they may have varying effects on yields [33,34]. For instance, Ugandan maize performs well under temperatures of between 20 and 22◦C, but decreases when temperatures rise to about 27◦C [19]. Ugandan maize is also grown across the country in differing agro-climatic zones, requiring medium (500 mm/growing season month) to high (800 mm/growing season month) precipitation [29,30]).
In assessing the vulnerability of a crop to droughts, the general scholarship has focused on the magnitude of precipitation deficit (meteorological drought) and temperature changes [35,36]. Yet, small droughts may trigger larger crop losses, while larger droughts may not have such effects due to differences in the sensitivity and adaptive capacity at the household to community to regional scales [14]. Indeed, many modeling approaches to assessing the vulnerability of agricultural systems focus only on projecting changes in meteorological conditions and associated crop impacts, failing to integrate socio-economic proxies of sensitivity and adaptive capacity with biophysical determinants of the effects of droughts on crop yields [14–18]. In this context, we develop a vulnerability index that captures exposure, sensitivity and adaptive capacity, using the index to assess the national and spatial pattern of vulnerability of maize yields to droughts in Uganda.
population movements inter alia [37]. Since the 1990s, the continent has witnessed a relative increase in precipitation and greenness as evidenced by normalized difference vegetation index (NDVI) [37].
2. Materials and Methods
2.1. Study Area
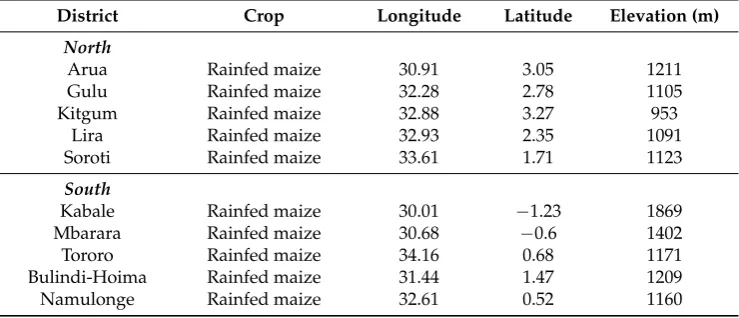
[image:3.595.113.483.446.605.2]Uganda is located in East Africa and in 2013 had a population of ~36 million [30,41–43]. This humid equatorial country has mean annual precipitation between 800 mm and 1500 mm: in the south, precipitation is bi-modal (March–May and September–November) and uni-modal in the north (April–October) [41,42]. Temperature varies little across the nation [30,41]. This study is designed to reflect the vulnerability of maize yields to droughts at both the national and district level scales, with Table1representing the 10 districts that are covered by this study. These sites/districts were selected because: they have data on maize yield, precipitation and the proxy socio-economic variables, such as literacy and poverty rates; they are located either in the north or the south of the country; they are host to maize farms and weather stations; they have more than 60% of their population involved in agriculture; 90% of the maize farms are owned by small-scale farmers; and the sites are representative of the region in which they are found, for example the sites in the north have a uni-modal maize growing season, while those in the south have a bi-modal one. The rationale of including both national-and district-level scales of analyses provides a baseline against which comparisons can be made. For example, even though interesting findings come out of the north-south comparisons, comparing the north-south scale findings with the national scale findings helps to further situate the district level in the context of what obtains at the national scale. In most cases, when district-scale observations are higher/lower than national-scale observations, the degree of intensity of vulnerability can be judged as either exceptionally high or exceptionally low relative to national-scale observations.
Table 1.Locational coordinates and altitude of the 10 districts under investigation.
District Crop Longitude Latitude Elevation (m)
North
Arua Rainfed maize 30.91 3.05 1211
Gulu Rainfed maize 32.28 2.78 1105
Kitgum Rainfed maize 32.88 3.27 953
Lira Rainfed maize 32.93 2.35 1091
Soroti Rainfed maize 33.61 1.71 1123
South
Kabale Rainfed maize 30.01 −1.23 1869
Mbarara Rainfed maize 30.68 −0.6 1402
Tororo Rainfed maize 34.16 0.68 1171
Bulindi-Hoima Rainfed maize 31.44 1.47 1209
Namulonge Rainfed maize 32.61 0.52 1160
2.2. Methodology
Water2017,9, 181 4 of 17
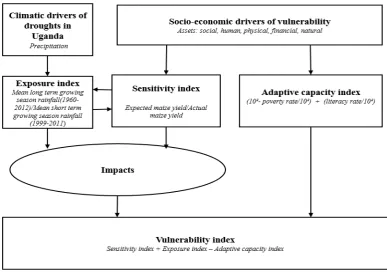
ability of farmers to adapt to changes [8,30,50–54]. In our approach, we develop a sub-index for each of these components of vulnerability that incorporates agro-ecological, climatic and socio-economic aspects of vulnerability to droughts, combining them together to create a composite vulnerability index (Equation (1)) (Figure1):
VUmi =SEmi+EXmi−ADCmi (1)
whereVUmiis the maize yield vulnerability index,SEmiis the maize yield sensitivity index,EXmiis the maize yield exposure index andADCmiis the maize yield adaptive capacity index.
Water2017, 9, 181 4 of 17
adaptive capacity of maize or the ability to absorb the shocks caused by the decline in precipitation, as well as the ability of farmers to adapt to changes [8,30,50–54]. In our approach, we develop a sub-index for each of these components of vulnerability that incorporates agro-ecological, climatic and socio-economic aspects of vulnerability to droughts, combining them together to create a composite vulnerability index (Equation (1)) (Figure 1):
= + − (1)
[image:4.595.102.490.216.489.2]where is the maize yield vulnerability index, is the maize yield sensitivity index, is the maize yield exposure index and is the maize yield adaptive capacity index.
Figure 1. Theoretical framework for assessing vulnerability and the summary of the quantification procedure.
The approach builds upon other vulnerability indices, including the Notre Dame Global Adaptation Index (ND-GAIN) [55], the crop-drought indicator [14] and the water-poverty index [56,57], but is notable in that it is developed specifically for application in an African maize farming context.
2.3. Sensitivity Index
Sensitivity is defined as the reductions in maize yields/harvest that are due to climate change, climate variations and extreme events [44,49,58–60], or the manifestations of a climatic stimulus on cropping systems. For the 10 sites, time series data from 1999 to 2011 on actual maize yields (tons/ha/year) were collected from the Global Yield Gap Atlas [19]. At the national scale, time series data from 1961 to 2014 on actual maize yields (hectograms/ha/year converted to tons/ha/year) were collected from FAOSTAT [61].The periods 1999–2011 and 1961–2014 were selected because of the availability of data. The actual maize yield data were subjected to detrending by removing a linear model of the time series of the actual maize yield by dividing the projected linear trend by the actual linear trend (see Equation (2)). Detrending helps remove the repercussions of increased technology, illustrates annual maize yield variations as a result of precipitation and reduces the effects of consistent errors in reporting [27,53,61]. The expected yields were projected for each year by using the trend line equation for a simple linear regression (Equation (2)). The sensitivity index for maize yields was computed by dividing the mean expected maize yields by the mean actual maize yields (Equation (3)); similar procedures are used by [13,14] in their study in which they identified the
Figure 1.Theoretical framework for assessing vulnerability and the summary of the quantification procedure.
The approach builds upon other vulnerability indices, including the Notre Dame Global Adaptation Index (ND-GAIN) [55], the crop-drought indicator [14] and the water-poverty index [56,57], but is notable in that it is developed specifically for application in an African maize farming context.
2.3. Sensitivity Index
similar procedures are used by [13,14] in their study in which they identified the socio-economic indicators associated with sensitivity and resilience to droughts for each of China’s key grain crops. The higher the sensitivity index, the more significant the effects of droughts on maize yields.
EXPy=ax+b (2)
whereEXPyis the expected maize yield,xis the year,ais the linear trend andbis the intercept when EXPy=ax.
SEmi= EXPy
ACTy (3)
whereSEmiis the maize yield sensitivity index,EXPyis the mean expected maize yield andACTyis the mean actual maize yield.
2.4. Exposure Index
Exposure in the context of this study describes the extent and nature of the stimulus reflected in the magnitude, intensity and duration of the drought [1,44,49]. Precipitation data were used to reflect the extent to which maize is exposed to droughts. Furthermore, precipitation data adequately reflects the drought situation in Uganda because precipitation varies greatly from one site to another. Therefore, to be able to understand the severity of the droughts, it becomes important to verify the short- and long-term growing season precipitation data. Temperature on the other remains an important climate change-related variable, but in Uganda, the temperatures are relatively high within and outside of the maize growing seasons; as such, to be able to understand the nature of the droughts, it is adequate to place emphasis on precipitation data. As such, the maize growing season precipitation data were collected. To be able to collect the appropriate maize growing season precipitation data, the maize growing seasons were identified across Uganda, from which spatial variations in the maize growing seasons were observed across Uganda. According to various maize crop calendars [62–64], the south of Uganda has bi-modal maize growing seasons. The first maize growing season begins with sowing in February and March, growing in April and May, while harvesting occurs in June and July. The second maize growing season in the south of Uganda begins with sowing in September and October, growing in November and harvesting in December.
Water2017,9, 181 6 of 17
precipitation in September, while the second mean short-term growing season in the south may also be delayed to October or November (Figure2). In the north, April usually ushers the beginning of rains in what has been termed the mean long-term growing reason, while when rains are delayed, there is a shift to May and July. The higher the exposure index, the more significant the effects of the droughts on maize yields. According to Redsteer et al. [66], several case studies around the world indicate that droughts can only be partly attributed to deficient or erratic precipitation, as droughts appear to be centered over several other drivers, including temperature. Others include variables, such as poverty, rural vulnerability and increased water demand due to urbanization, industrialization, soil conditions and governance systems inter alia [66]. It is for this reason that we decided to validate the assertion that temperatures do not change the results by using mean long-term growing season temperatures from 1941 to 2014 and mean short-term growing season temperatures from 1961 to 2014 obtained from the climate portal of the World Bank Group [65] and used to compute the exposure index based on temperature data (Equation (6)).
EXmir=
µLTmgsppt(1960to2012)
µSTmgsppt(1999to2011)
(4)
whereEXmiris the maize yield exposure index for the site-level analysis (10 sites),µLTmgsppt(1960to2012)
is the mean long-term maize growing season precipitation from 1960 to 2012 for each of the 10 sites andµSTmgsppt(1999to2011)is mean short-term maize growing season precipitation from 1999 to 2011
for each of the 10 sites.
EXmi_nsp=
µLTmgsppt(1941to2014)
µSTmgsppt(1961to2014)
(5)
EXmi_nst =
µLTmgst(1941to2014)
µSTmgst(1961to2014)
(6)
where EXmi_nsp is the maize yield exposure index at the national scale based on precipitation data, EXmi_nst is the maize yield exposure index at the national scale based on temperature data, µLTmgsppt(1941to2014). is the mean long-term maize growing season precipitation from 1941 to 2014 at
the national scale andµSTmgsppt(1961to2014)is the mean short-term maize growing season precipitation
from 1961 to 2014 at the national scale.µLTmgst(1941to2014)is the mean long-term maize growing season temperature from 1941 to 2014 at the national scale.µSTmgst(1961to2014)is the mean short-term maize growing season temperature from 1961 to 2014 at the national scale.
Water2017, 9, 181 6 of 17
April usually ushers the beginning of rains in what has been termed the mean long-term growing reason, while when rains are delayed, there is a shift to May and July. The higher the exposure index, the more significant the effects of the droughts on maize yields. According to Redsteer et al. [66], several case studies around the world indicate that droughts can only be partly attributed to deficient or erratic precipitation, as droughts appear to be centered over several other drivers, including temperature. Others include variables, such as poverty, rural vulnerability and increased water demand due to urbanization, industrialization, soil conditions and governance systems inter alia [66]. It is for this reason that we decided to validate the assertion that temperatures do not change the results by using mean long-term growing season temperatures from 1941 to 2014 and mean short-term growing season temperatures from 1961 to 2014 obtained from the climate portal of the World Bank Group [65] and used to compute the exposure index based on temperature data (Equation (6)).
=μ
μ (4)
where is the maize yield exposure index for the site-level analysis (10 sites),
μ is the mean long-term maize growing season precipitation from 1960 to 2012 for each of the 10 sites and μ is mean short-term maize growing season precipitation from 1999 to 2011 for each of the 10 sites.
_ =
μ
μ (5)
_ =
μ
μ (6)
where _ is the maize yield exposure index at the national scale based on precipitation data,
[image:6.595.113.481.539.690.2]_ is the maize yield exposure index at the national scale based on temperature data, μ is the mean long-term maize growing season precipitation from 1941 to 2014 at the national scale and μ is the mean short-term maize growing season precipitation from 1961 to 2014 at the national scale. μ is the mean long-term maize growing season temperature from 1941 to 2014 at the national scale. μ is the mean short-term maize growing season temperature from 1961 to 2014 at the national scale.
Figure 2. Maize crop calendar for Uganda. Source: the authors’ conceptualization inspired by FAO [63].
2.5. Adaptive Capacity Index
Adaptive capacity is the ability of maize production systems to adjust to climate change, extreme events and climate variability and to take advantage of the opportunities to cope with the consequences of climate change and variability [1,8,49,67]. The magnitude of the effects a drought has on maize yields is often determined by the adaptive capacity of maize systems and types to manage the effects of droughts. Simelton et al. [14] observed that small droughts might have relatively large effects on maize yields in the face of inadequate adaptive capacity and vice versa
Figure 2.Maize crop calendar for Uganda. Source: the authors’ conceptualization inspired by FAO [63].
2.5. Adaptive Capacity Index
of climate change and variability [1,8,49,67]. The magnitude of the effects a drought has on maize yields is often determined by the adaptive capacity of maize systems and types to manage the effects of droughts. Simelton et al. [14] observed that small droughts might have relatively large effects on maize yields in the face of inadequate adaptive capacity and vice versa because high adaptive capacity lowers vulnerability. A variety of socio-economic proxies have been suggested for use in indicator-based approaches for vulnerability assessment, including: level of education and poverty, availability of safety nets and transportation systems [68–74].
To assess the adaptive capacity of maize farming, this study used two socio-economic proxies: poverty (%) (Material asset) and literacy rates (%) (Human asset). Poverty rate in the context of this study refers to material rather than financial assets because; “ . . . income poverty measures provide important but incomplete guidance to redress multidimensional poverty”, Alkire and Santos [75]. Income shows higher rates of poverty than reality, and not all households have the ability to translate income into health or educational expenses [76]. The poverty rate data were collected based on indicators, such as: size of the household, type of floor, source of water, type of toilet, presence or absence of electricity; and were obtained from Daniels [76]. The literacy rate data were collected from [77].
Poverty and literacy rates were selected as the main socio-economic proxies because of limited data on the other potential proxies, such as route network, safety nets, natural resources (irrigation), etc., and also because these two proxies capture and impact most proxies. For example, poverty reduction can lead to improvements in the literacy rates (human assets), and the spillover effects of these could be reflected in improved transport and route networks (physical assets), improved ownership of property (material assets) and improved disposable income (financial assets), as well as the ability to harness rivers and streams for irrigation. Opportunities for people to sustainably utilize resources (natural assets, such as rivers) may emerge. It is important to however note that increased access to irrigation may help reduce the problem of the decline in precipitation. However, in Uganda, this is possible in the south, as most of the rivers in the south flow all year round, while those in the north are seasonal; this spatial variation in irrigation potential may often affect the feasibility of irrigation in many parts of the country. It is possible that reduced poverty rates in any region of the country can enhance access to irrigation through the creation of capital intensive boreholes and easy access to knowledge on new techniques of irrigation or even rainwater harvesting. As such, irrigation potential is linked to both the natural all year-round distribution of water resources and the ability of the people to harness these resources, which is also linked to poverty and literacy rates. Precipitation and access to irrigation also move in the same direction. A region with higher precipitation is likely going to have more water in its rivers, and this will enhance the feasibility of irrigation. However, even when rivers are available, the absence of knowledge and financial capabilities may render the irrigation potential worthless. The Government of Uganda depends on growth in the agriculture sector to trigger economic growth [22]. According to Daniels [76] and the Uganda Bureau of Statistics (UBOS) [77], poverty reduction among farming households will drive growth in other sectors in Uganda. In addition, ~87% of Ugandans live in rural areas, and about 30% of all rural people (10 million men, women and children) are still below the national poverty line. Reducing poverty through agriculture is therefore a critical and the main avenue to developing other sectors [16,22]. When poverty rates are high, farmers tend to have low adaptive capacity because they are unable to either purchase drought-resistant maize seeds or unable to invest in irrigation, fertilizers and other farm inputs. Low literacy rates will mean low adaptive capacity, since the farmers might be unable to interpret and understand communications, such as changes in planting dates, the availability of drought-resistant varieties and to secure other sources of livelihood sustenance (see Equation (7)).
ADCmi=
102−Pr 102
+
Lr 102
Water2017,9, 181 8 of 17
where ADCmi is the maize yield adaptive capacity index, Pr is the poverty rate (%) and Lr is the literacy rate (%).
3. Results
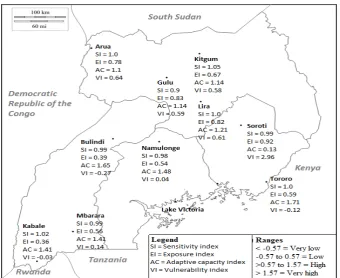
To assess the strength of the indices, the following ranges were used to categorize the indices: <−0.57 = very low,−0.57 to 0.57 = low, >0.57 to 1.57 = high, >1.57 = very high (see Figure3). At the national level, a vulnerability index of 0.6 (high) based on exposure dependent on precipitation data is recorded. The parallel sensitivity, exposure and adaptive capacity indices are 1.06 (high), 0.99 (high) and 1.45 (high), respectively (Table2). It can be said that the degree of vulnerability, sensitivity and exposure are high. However, when national-level exposure is computed based on temperature data, the results are exactly the same as when it is based on precipitation data. This is seen as the mean long-term growing season temperature (1941–2014) is 22.82911◦C, while the mean short-term growing season temperature (1961–2014) is 22.93344161◦C; this gives an exposure index of 0.99 (high), which is exactly the same when exposure is based on precipitation data. As such, the sensitivity and vulnerability indices are the same when exposure is based on precipitation data, as well as when it is based on temperature data. The adaptive capacity index is relatively also high at the national scale due to a lower vulnerability index. A lot of effort is being put in place to enhance resilience, and this involves the totality of adaptations for the entire country; however, it is inferior to those observed in the south and superior to those in the north.
[image:8.595.113.484.636.701.2]From the perspective of sites, the sites in the north have higher vulnerability indices when compared to the south (Figure3). The lowest vulnerability index recorded in the north is 0.58 in Kitgum, and this is higher than the highest recorded in the south, which is 0.27, recorded in Bulindi-Hoima (Figure3). Considering observations from all of the other sites, it can be said that maize yields are more vulnerable to droughts in the north of Uganda than in the south. The exposure indices assume the same trajectory as the vulnerability indices. The lowest exposure index in the north is 0.67, recorded in Kitgum, and it is higher than the highest in the south, which is 0.59, recorded in Tororo (Figure3). The sensitivity indices seem to be an exception in which the lowest index in the north (0.9) is lower than the highest in the south (1.02). However, if we compute the mean sensitivity index for all five sites for both regions, it is observed that the mean sensitivity index for both regions is 0.99. Overall, it can be said that maize yields in the north of Uganda are overwhelmingly more vulnerable and more exposed to droughts than in the south. All of the vulnerability indices in the south are lower than the 0.6 recorded at the national scale, while those recorded in the north either spiral around the national average of 0.6 and peak at 2.96 in Soroti. The exposure indices are higher nationally as the 0.99 recorded at the national level is higher than those obtained in the north and the south; those recorded in the north are higher than those of the south. The site-level sensitivity indices for the north and south of Uganda are very close to the national average of 1.06; but generally lower, as the mean for both the north and the south is 0.99.
Table 2.National-scale estimates of the vulnerability of maize yield to droughts in Uganda based on precipitation and temperature data.
Parameters Precipitation Estimates Temperature Estimates
Sensitivity index 1.06 1.06
Exposure index 0.99 0.99
Adaptive capacity index 1.45 1.45
Vulnerability index 0.6 0.6
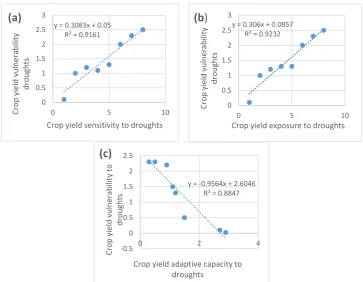
91% of the variations in vulnerability can be explained by the level of sensitivity of maize. Furthermore, the higher the exposure, the higher the level of vulnerability and vice versa. The coefficient of determination of 0.92 means that about 92% of the changes in vulnerability can be explained by the exposure (Figure4b). As seen on Figure5a–c, towards higher latitudes in Uganda (north), the exposure, sensitivity and vulnerability of maize yields to droughts increases and vice versa.
[image:9.595.128.469.165.443.2]Water2017, 9, 181 9 of 17
Figure 3. The spatial pattern of crop yield sensitivity, exposure, adaptive capacity and vulnerability indices for various districts/sites in Uganda.
Figure 4. Relationship between crop yield vulnerability to droughts and (a) crop yield sensitivity to droughts, (b) crop yield exposure to droughts and (c) crop yields’ adaptive capacity to droughts.
y = 0.3083x + 0.05 R² = 0.9161
0 0.5 1 1.5 2 2.5 3
0 5 10
Crop yield vulnerability
droughts
Crop yield sensitivity to droughts
(a)
y = 0.306x + 0.0857 R² = 0.9232
0 0.5 1 1.5 2 2.5 3
0 5 10
Crop yield vulnerability
droughts
Crop yield exposure to droughts
(b
)
y = -0.9564x + 2.6046 R² = 0.8847
-0.5 0 0.5 1 1.5 2 2.5
0 2 4
Crop yield vulnerability to
droughts
Crop yield adaptive capacity to droughts
(c)
Figure 3.The spatial pattern of crop yield sensitivity, exposure, adaptive capacity and vulnerability indices for various districts/sites in Uganda.
Water2017,9, 181 10 of 17
Water2017, 9, 181 9 of 17
[image:10.595.116.480.86.368.2]Figure 3. The spatial pattern of crop yield sensitivity, exposure, adaptive capacity and vulnerability indices for various districts/sites in Uganda.
Figure 4. Relationship between crop yield vulnerability to droughts and (a) crop yield sensitivity to droughts, (b) crop yield exposure to droughts and (c) crop yields’ adaptive capacity to droughts.
y = 0.3083x + 0.05 R² = 0.9161
0 0.5 1 1.5 2 2.5 3
0 5 10
Crop yield vulnerability
droughts
Crop yield sensitivity to droughts
(a)
y = 0.306x + 0.0857 R² = 0.9232
0 0.5 1 1.5 2 2.5 3
0 5 10
Crop yield vulnerability
droughts
Crop yield exposure to droughts
(b
)
y = -0.9564x + 2.6046 R² = 0.8847
-0.5 0 0.5 1 1.5 2 2.5
0 2 4
Crop yield vulnerability to
droughts
Crop yield adaptive capacity to droughts
[image:10.595.126.469.419.721.2](c)
Figure 4.Relationship between crop yield vulnerability to droughts and (a) crop yield sensitivity to droughts, (b) crop yield exposure to droughts and (c) crop yields’ adaptive capacity to droughts.
Water2017, 9, 181 10 of 17
The highest adaptive capacity index in the north is 1.21, recorded in Lira, while in the south, the highest is 1.71, recorded in Tororo (Figure 3). In general, all of the sites in the south have higher adaptive capacity indices than those in the north. The implication here is that maize production farmers in the south have a higher adaptive capacity to droughts than those in the north, based on the indicators used. When the adaptive capacity is high in the south, vulnerability is low. The scatter plots of adaptive capacity to droughts against vulnerability illustrates that, when adaptive capacity is high as in the south of Uganda, vulnerability is low (Figure 4c). On the other hand, when adaptive capacity is lower, as is observed in the north of Uganda, vulnerability is high. The coefficient of determination of 0.88 shows that about 88% of the changes in vulnerability can be explained by the changes in adaptive capacity. The latter observation is the same in the relationship between adaptive capacity, on the one hand, and sensitivity and exposure, on the other hand. Adaptive capacity also varies with latitude; as we move towards the higher latitudes (north), adaptive capacity reduces, while at lower latitudes (south), it is higher (Figure 5d). For the national-scale analysis, the adaptive capacity index is 1.45. It is higher than the records obtained in the north of the country, but lower than those observed in the south of the country, which are cumulatively higher, with the highest adaptive capacity index in the south being 1.71 recorded in Tororo.
Figure 5. Relationship between latitude and (a) crop yield exposure to droughts, (b) crop yield sensitivity to droughts, (c) crop yield vulnerability to droughts and (d) crop yield adaptive capacity to droughts.
Adaptive capacity is the most important of all of the indices because we cannot determine the trajectory of climate in the future, but we can determine how to respond to climate shocks through adaptations. The status of sensitivity and exposure will either remain the same, worsen or reduce with adequate adaptations. What is key here is that more investments need to be made to enhance adaptive capacity, which though a relatively new concept, stands to determine the future of vulnerability. Notwithstanding the magnitude of a drought, adaptive capacity remains very
y = 3.2205x - 4.6522 R² = 0.9411
-2 -1 0 1 2 3 4
0 1 2 3
Latitude
Crop yield exposure to droughts
(a
)
y = 2.4194x - 3.3617 R² = 0.8424
-2 -1 0 1 2 3 4 5
0 2 4
Latitude
Crop yield sensitivity to droughts
(b)
y = 1.2648x - 0.7899 R² = 0.7546
-2 -1 0 1 2 3 4
0 1 2 3 4
Latitude
Crop yield vulnerability to droughts
(c)
y = -2.4915x + 5.4388 R² = 0.9105
-2 -1 0 1 2 3 4
0 1 2 3
Latitude
Crop yield adaptive capacity to droughts
(d
)
Adaptive capacity is the most important of all of the indices because we cannot determine the trajectory of climate in the future, but we can determine how to respond to climate shocks through adaptations. The status of sensitivity and exposure will either remain the same, worsen or reduce with adequate adaptations. What is key here is that more investments need to be made to enhance adaptive capacity, which though a relatively new concept, stands to determine the future of vulnerability. Notwithstanding the magnitude of a drought, adaptive capacity remains very important because small droughts can trigger heavy damages to crops when adaptive capacity is weak. Simelton et al. [14] also support this view when they observe that climate change studies should be based on adaptations, being that the magnitude of a drought does not really matter a great deal if adaptations are adequate.
4. Discussion
The argument that vulnerability, exposure and sensitivity to droughts increase towards the north of Uganda while adaptive capacity decreases is consistent with previous studies [67,77–82]. There is an inverse relationship between latitude and precipitation in the Sahel [77,79–81]. The tendency for temperatures to increase with the increase in latitude and for precipitation to decrease with the increase in latitude is also consistent with a study conducted in Canada on the influence of droughts on tree mortality across Canada. The results show that between 1960 and 2000, higher temperatures and lower precipitation levels recorded above latitude 54◦north while lower temperatures and higher precipitation levels recorded towards lower latitudes were responsible for the increased tree mortality (51◦–54◦ and <51◦ north) [80]. In Uganda, this can be explained by the fact that in the south of Uganda, precipitation is bi-modal (March–May and September–November) and uni-modal in the north (April–October) [41,42,65]. The low levels of precipitation recorded in the north can be used to explain the high level of maize yield vulnerability. The spatial variations and distribution of precipitation can be explained by variations in sea surface temperatures in the distant tropical Pacific and Indian oceans. The south also has lakes, like Lake Victoria, Lake Albert and Lake Edwards, which help in enhancing precipitation [41]. Findings by Thomson et al. [7] also highlight the importance of climate on food security in SSA.
The socio-economic differences between the north and the south of Uganda can explain these observations. Daniels [76] argued that in 2010, the poverty rate in the north was 46.2% and higher than the 21.8% recorded in the south. Poor people are unable to invest in inputs, such as fertilizers, high-yielding drought-resistant maize varieties and irrigation infrastructure [72]. The UBOS [77] reported that the literacy rates in the south ranged between 63% and 75%, while in the north, they ranged between 60% and 63%; with a national average of 69.6%. It can be said that when poverty is high, literacy rates are often low, and communities become more vulnerable to droughts because low education translates into reduced earning capacity, limited ability to comprehend early weather warnings and shifts in planting dates. IFAD [16] supports these assertions by noting that small-holder farmers in northern Uganda lack: vehicles and roads to transport their produce, technological inputs to increase production and reduce pests and have limited access to financial services that can boost their incomes and expand production. The assertion that the north of Uganda is the poorest region of the country is supported by IFAD [16], which argues that the government of Uganda depends on the agricultural sector to drive growth and contribute to poverty reduction in the north and all of Uganda.
Water2017,9, 181 12 of 17
expenses [76]. Physical assets such as farm to market roads may determine how fast a community responds to hazards, as seen in the degree of rapidity with which relief or external support gets to the affected communities [32,56,68,69]. The level of education (human asset) does affect the ability to understand climate change-related information [89].
The spatial distribution of fertile volcanic soils in western Uganda around Lake Edward with average productivity in the greater south can also explain the variations. Fertile clay soils are also found in the southwest of the Nebbi district and around Jinja and central Uganda. Around the, ‘Fertile Crescent’, some 40–48 km wide around Lake Victoria from Jinja to Masaka, deep red loams occur [19,90]. In the north, most of the districts ranging from Gulu, Kitgum to Moroto and most of Kotido, Kumi and Soroti have mostly soils that are shallow and sandy with low productivity [19,60,90]. With threats of desertification and low average annual precipitation, the problems of food security are only likely to be accentuated in the north of Uganda. Besides, the situation may even deteriorate as model-based projections of surface temperature changes over east Africa may approach 6◦C by 2100 in an extreme scenario, while more conservative changes show increases just around the 2◦C mark [91,92]. In the case of precipitation, projections show changes in the range of +20% or−20% by the year 2100. In spite of this distribution, it is worth mentioning that the south has patches of infertile soils, such as the montane soils around the upper slopes of Mount Elgon and parts of western Uganda. The Singo Hills north of Lake Wamala in central Uganda are no exception. As such, it is observed that the influence of soils is restricted and should be handled with caution. On the other hand, much of the spatial and temporal variations in the response of different crops to climate change across east Africa have been attributed to changes in temperature and to a lesser extent changes in water resource distribution [82,93,94]. Even though precipitation is reported to have begun recovering from the 1990s [39], in most of Africa, droughts still remain recurrent due to problems of timing and distribution of the precipitation increase [37,40].
5. Conclusions
The results show that maize yields are more vulnerable to droughts in most of the northern sites in Uganda than in the south and nationally. In terms of adaptive capacity, the sites in the south of the country have higher adaptive capacity. Latitudinally, it is observed that vulnerability, sensitivity and exposure increase with the increase in latitude, while adaptive capacity is higher at lower latitudes. This spatial pattern can be explained by a plethora of factors, such as climatic, socio-economic and soil quality-related factors. This index can be used to examine the vulnerability of other crops to various climatic stimuli and other hazards, such as floods, winds and even volcanic eruptions or natural hazards in general. The adaptive capacity sub-component of the index provides a statistical basis for the evaluation of adaptation to hazards. The vulnerability index successfully integrates socio-economic and biophysical variables, and the results are consistent with previous studies.
This vulnerability index can definitely be used to examine the vulnerability of other crops and communities in developing countries to various global environmental change processes. The adaptive capacity sub-component of the index provides a statistical basis for the evaluation of adaptations based on proxies in developing countries to global environmental change processes and, just like the main index itself, could be used in assessing vulnerability and adaptability in the context of other major global environmental change processes. In addition to testing the applicability of these indices in other developing countries, the current requirements with respect to further research in the area of adaptation indices should emphasize the creation of a conceptual framework, as well as a detailed methodology and a global adaptation index that can monitor, track and evaluate the current status of adaptation progress in different parts of the world. Such an index could also provide a platform from which different stakeholders (civil society, private sector and public sector) could evaluate their level of involvement and success in climate change adaptation. Designing scenarios and testing the effects of future temperature changes could be a good way of evaluating and forecasting future vulnerability.
Acknowledgments: This work was supported by a grant from the Social Science and Humanities Research Council of Canada Grant Number 756-2016-0003 and from one of James Ford’s research grants.
Author Contributions:Terence Epule Epule designed the study; collected and analyzed the data and wrote the paper. James D. Ford edited and supervised the paper, while Shuaib Lwasa and Laurent Lepage also edited and made suggestions to improve the paper.
Conflicts of Interest:The authors declare no conflict of interest.
References
1. Intergovernmental Panel on Climate Change (IPCC). Climate Change 2007: Impacts, Adaptations and Vulnerability; Contributions of the Working Group 2 to the Fourth Assessment Report of the IPCC; Cambridge University Press: Cambridge, UK, 2007; p. 976.
2. Parry, M.L.; Rosenzweig, C.; Iglesias, A.; Livermore, M.; Fischer, G. Effects of climate change on global food production under SRES emissions and socio-economic scenarios. Glob. Environ. Chang. 2004,14, 53–67. [CrossRef]
3. Challinor, A.; Wheeler, T.; Garforth, C.; Kassam, A. Assessing the vulnerability of food crop systems in Africa to climate change.Clim. Chang.2007,83, 382–399. [CrossRef]
4. Schlenker, W.; Lobell, D.B. Robust negative impacts of climate change African agriculture.Environ. Res. Lett. 2010,5, 014010. [CrossRef]
5. Ford, J.D.; Gough, W.A.; Laidler, G.J.; MacDonald, J.; Irngaut, C.; Qrunnut, K. Sea ice, climate change, and community vulnerability in northern Foxe Basin, Canada.Clim. Res.2009,38, 137–154. [CrossRef]
6. Ford, J.D. Vulnerability of Inuit food systems to food insecurity as a consequence of climate change: A case study from Igloolik, Nunavut.Reg. Environ. Chang.2009,9, 83–100. [CrossRef]
7. Thomson, H.; Berrang-Ford, L.; Ford, J.D. Climate Change and Food Security in Sub-Saharan Africa: A Systematic Literature Review.Sustainability2010,2, 2719–2733. [CrossRef]
8. Ford, J.D.; McDowell, G.; Shirley, J.; Pitre, M.; Siewierski, R.; Gough, W.; Statham, S. The dynamic multi-scale nature of climate change vulnerability: An Inuit harvesting example. Ann. Assoc. Am. Geogr.2013,103, 1193–1211. [CrossRef]
9. Barros, V.R.; Field, C.B.; Dokken, D.J.; Mastrandrea, M.D.; Mach, K.J.; Bilir, T.E.; Chatterjee, M.; Ebi, K.L.; Estrada, Y.O.; Genova, R.C. (Eds.)Climate Change 2014: Impacts, Adaptation, and Vulnerability. Contribution of Working Group II to the Fifth Assessment Report of the Intergovernmental Panel on Climate Change; Cambridge University Press: Cambridge, UK; New York, NY, USA, 2014.
10. Challinor, A.; Simelton, E.S.; Fraser, E.D.; Hemming, D. Increased crop failure due to climate change. Assessing adaptation options using models and socio-economic data for wheat in China.Environ. Res. Lett. 2010,5, 034012. [CrossRef]
Water2017,9, 181 14 of 17
12. Cooper, P.; Dimes, J.; Rao, K.; Shapiro, B.; Shiferaw, B.; Twomlow, S. Coping better with current climatic variability in the rain-fed farming systems of sub-Saharan Africa: An essential first step in adapting to future climate change?Agric. Ecosyst. Environ.2008,126, 24–35. [CrossRef]
13. Shi, W.; Tao, F. Vulnerability of maize yield to climate change and variability during 1961–2010.Food Secur. 2014,6, 471–481. [CrossRef]
14. Simelton, E.; Fraser, E.D.G.; Termansen, M.; Foster, P.M.; Dougill, A.J. Typologies of crop-drought vulnerability: An empirical analysis of the socioeconomic factors that influence the sensitivity and resilience to drought of three major food crops in China (1961–2001).Environ. Sci. Policy2009,12, 438–452. [CrossRef] 15. Kaizzi, K. Application of the GYGA Approach to Uganda. 2014. Available online:http://www.yieldgap.
org/gygamaps/excel/GygaUganda.xlsx(accessed on 3 May 2016).
16. International Fund for Agricultural Development (IFAD).Enabling Poor Rural People to Overcome Poverty in Uganda: Rural Poverty in Uganda; IFAD: Rome, Italy, 2012.
17. Comenetz, J.; Caviedes, C. Climate variability, political crises, and historical population displacements in Ethiopia.Glob. Environ. Chang. Part B Environ. Hazards2002,4, 113–127. [CrossRef]
18. Green, R. The political economy of drought in Southern Africa 1991–1993.Health Policy Plan.1993,8, 256–266. [CrossRef]
19. Kaizzi, K. Global Yield Gap Atlas: Uganda. 2016. Available online:http://www.yieldgap.org/gygamaps/ excel/GygaUganda.xlsx(accessed on 3 May 2016).
20. Poate, C.D. A Review of Methods for Measuring Crop Production from Small-holder Producers.Exp. Agric. 1988,24, 1–14. [CrossRef]
21. Fraser, E.D.G. Travelling in antique lands: using past famine to develop an adaptability/resilience framework to identify food systems vulnerability to climate change.Clim. Chang.2007,83, 495–514. [CrossRef] 22. Department of Disaster Management; Office of the Prime Minister.The 2010–2011 Integrated Rainfall Variability
Impacts, Needs Assessment and Drought Risk Management Strategy; Office of Prime Minster of Uganda: Kampala, Uganda, 2012.
23. Houghton, J.T.; Ding, Y.; Grigg, D.J.; Noguer, M.; Van der Linden, P.J.; Dai, X.; Maskell, K.; Johnson, C.A.
Climate Change 2001: The Scientific Basis; Contribution of Working Group I to the Third Assessment Report of the Intergovernmental Panel on Climate Change; Cambridge University Press: Cambridge, UK, 2001; p. 881. 24. Robock, A.; Turco, R.; Harwell, M.A. Use of general circulation model output in the creation of climate
change scenarios for impact analysis.Clim. Chang.1993,23, 293–335.
25. Ward, P.; Lasage, R.Downscaled Climate Change Data from the HADCM3 and ECHAM5 Models on Precipitation and Temperature for Ethiopia and Kenya; Report W-09/05; Vrije Universiteit: Amsterdam, The Netherlands, 2009.
26. McSweeney, C.; Lizcano, G.; New, M.; Lu, X. The UNDP Climate Change Country Profiles: Improving the accessibility of observed and projected climate information for studies of climate change in developing countries.Bull. Am. Meteorol. Soc.2010,91, 157–166. [CrossRef]
27. Lobell, D.B.; Field, C. Global scale climate-crop yield relationships and the impacts of recent warming.
Environ. Res. Lett.2007,2, 014002. [CrossRef]
28. Epule, T.E.; Bryant, C.R. Maize production responsiveness to land use change and climate trends in Cameroon.
Sustainability2015,7, 384–397. [CrossRef]
29. Mutai, C.C.; Ward, M.N. East African rainfall and the tropical circulation/convection on intra-seasonal to inter-annual timescales.Am. Meteorol. Soc.2010,3, 3915–3939.
30. Moss, R.H.; Edmonds, J.A.; Hibbard, K.A.; Manning, M.R.; Rose, S.K.; van Vuuren, D.P.; Carter, T.R.; Emori, S.; Kainum, M.; Kram, T.; et al. The next generation of scenarios for climate change research and assessment.
Nature2010,463, 747–756. [CrossRef] [PubMed]
31. Challinor, A. Towards the development of adaptation options using climate and crop yield forecasting at seasonal to multi-decadal timescales.Environ. Sci. Policy2009,12, 453–465. [CrossRef]
32. Epule, T.E.; Bryant, C.R.; Akkari, C.; Daouda, O. Can organic fertilizers set the pace for a greener arable agricultural revolution in Africa? Analysis, synthesis and way forward.Land Use Policy2015,47, 179–187. [CrossRef]
33. Duvick, D.N.; Cassman, K.G. Post-green revolution trends in yield potential of temperate maize in North-Central United States.Crop Sci.1999,39, 1622–1630. [CrossRef]
34. Kulcharik, C.J.; Serbin, S. Impacts of recent climate change on Wisconsin corn and soyabean yield trends.
35. Mishra, A.K.; Singh, V. A review of drought concepts.J. Hydrol.2010,391, 202–216. [CrossRef] 36. Mishra, A.K.; Singh, V. Drought modeling—A review.J. Hydrol.2011,403, 157–175. [CrossRef]
37. Epule, T.E.; Peng, C.; Lepage, L.; Chen, Z. The causes, effects and challenges of Sahelian droughts: A critical review.Reg. Environ. Chang.2014,14, 145–156. [CrossRef]
38. Tarhule, A. Damaging rainfall and flooding: The other Sahel hazard. Clim. Chang. 2005, 72, 355–377. [CrossRef]
39. Faure, H.; Gac, J. Will the Sahelian droughts end in 1985?Nature1981,291, 475–478. [CrossRef] 40. Zeng, N. Droughts in the Sahel.Science2003,302, 999–1000. [CrossRef] [PubMed]
41. Farley, C.; Farmer, A. Uganda Climate Change Vulnerability Report. USAID, 2013. Available online:https:// www.climatelinks.org/sites/default/files/asset/document/ARCC-Uganda%2520VA-Report.pdf(accessed on 25 May 2016).
42. Government of Uganda, Ministry of Water and Environment.Inception Report: Climate Change Vulnerability Assessment, Adaptation Strategy and Action Plan for the Water Resources Sector in Uganda; One World Sustainable Investments, Directorate of Water Resource Management: Kampala, Uganda, 2008.
43. Mubiru, J.; Banda, E.J.K.B. Monthly average daily global irradiation map for Uganda: A location in the equatorial region.Ren. Energy2012, 412–415. [CrossRef]
44. Sherman, M.; Ford, J.D.; Lianos-Cuentas, A.; Valdivia, M.J.; IHACC Research Group. Food system vulnerability amidst the extreme 2010–2011 flooding in the Peruvian Amazon: A case study from the Ucayali region.
Food Secur.2016,8, 551–570. [CrossRef]
45. McCarthy, J.J.; Canziani, O.F.; Leary, N.A.; Dokken, D.J.; White, K.S. (Eds.) Climate Change 2001: Impacts, Adaptation and Vulnerability; Cambridge University Press: Cambridge, UK, 2001.
46. O’Brien, K.; Eriksen, S.; Nygaard, L.P.; Schjolden, A. Why different interpretations of vulnerability matter in climate change discourses.Clim. Policy2007,7, 73–88. [CrossRef]
47. Füssel, H.M.Development and Climate Change. Background Note: Review and Quantitative Analysis of Indices of Climate Change Exposure, Adaptive Capacity and Sensitivity and Impacts; World Development Report; Potsdam Institute of Climate Impact Research: Potsdam, Germany, 2009.
48. Sherman, M.; Ford, J.D. Market engagement and food insecurity after a climatic hazard.Glob. Food Secur. 2013,2, 144–155. [CrossRef]
49. Ford, J.D.; Keskitalo, E.C.H.; Smith, T.; Pearce, T.; Berrang-Ford, L.; Duerden, F.; Smit, B. Case study and analogue methodologies in climate change vulnerability research.Wiley Interdiscip. Rev. Clim. Chang.2010,1, 374–392. [CrossRef]
50. Ford, J.D.; Smit, B. A framework for assessing the vulnerability of communities in the Canadian Arctic to risks associated with climate change.Arctic2004,57, 389–400. [CrossRef]
51. Ford, J.D.; Smit, B.; Wandel, J.; MacDonald, J. Vulnerability to climate change in Igloolik, Nunavut: What we can learn from the past and present.Polar Rec.2006,42, 127–138. [CrossRef]
52. Smit, B.; Wandel, J. Adaptation, adaptive capacity and vulnerability.Glob. Environ. Chang.2006,16, 282–292. [CrossRef]
53. Easterling, W.E.; Aggarwal, P.K.; Batima, P.; Brander, K.M.; Erda, L.; Howden, S.M.; Kirilenko, A.; Morton, J.; Soussan, J.F.; Schmidhuber, J.; et al. Food, fibre and forest products. InClimate Change 2007: Impacts, Adaptation and Vulnerability. Contribution of Working Group II to the Fourth Assessment Report of the Intergovernmental Panel on Climate Change; Parry, M.L., Canziani, O.F., Palutikof, J.P., van der Linden, P., Hanson, C., Eds.; Cambridge University Press: Cambridge, UK, 2007; pp. 273–313.
54. Nelson, D.R.; Adger, N.; Brown, K. Adaptation to environmental change: Contributions of a resilience framework.Ann. Rev. Environ. Res.2007,32, 395–419. [CrossRef]
55. Chen, C.; Noble, I.; Hellmann, J.; Coffee, J.; Murillo, M.; Chawla, N. University of Notre Dame Global Adaptation Index Country Index Technical Report. 2015. Available online: http://index.nd-gain.org: 8080/documents/nd-gain_technical_document_2015.pdf(accessed on 9 June 2016).
56. Sullivan, C. Calculating a water poverty index.World Dev.2002,30, 1195–1210. [CrossRef]
57. Adger, W.N.; Brooks, N.; Bentham, G.; Agnew, M.; Eriksen, S.New Indicators of Vulnerability and Adaptive Capacity in Technical Report, 7; Tyndall Centre for Climate Research: Norwich, UK, 2004.
Water2017,9, 181 16 of 17
59. IPCC. IPCC Expert Meeting on the Science of Alternative Matrices. 2009. Available online:http://citeseerx. ist.psu.edu/viewdoc/download?doi=10.1.1.171.674&rep=rep1&type=pdf(accessed on 23 January 2017). 60. Fermont, A.; Benson, T. Estimating Yield of Food Crops Grown by Smallholder Farmers: A Review in the
Uganda Context. IFPRI Discussion Paper No. 01097. Available online:http://www.ifpri.org/publication/ estimating-yield-food-crops-grown-smallholder-farmers(accessed on 10 May 2016).
61. Food and Agricultural Organization of the United Nations Statistics Division, FAO. FAOSTAT. 2016a. Available online:http://faostat3.fao.org/download/Q/QC/E(accessed on 5 May 2016).
62. Sacks, W.J.; Deryng, D.; Foley, J.A.; Ramankutty, N. Crop planting dates: an analysis of global patterns.
Glob. Ecol. Biogeogr.2010,19, 607–620.
63. Global Yield Gap Atlas, GYGA. FAO Crop Calendars for Maize, Sorghum, Millet, Rice and Barley. 2013. Available online:http://www.yieldgap.org/gygamaps/pdf/Details%20on%20crop%20information%20to% 20calibrate%20crop%20models%20for%20Uganda.pdf(accessed on 1 May 2016).
64. Food and Agricultural Organization of the United Nations, FAO. Uganda Crop Calendar (Major Crops). 2016b. Available online:http://www.fao.org/giews/countrybrief/country.jsp?code=UGA(accessed on 4 May 2016).
65. World Bank Group. Climate Change Knowledge Portal for Development Practitioners and Policy Makers. 2016. Available online:http://sdwebx.worldbank.org/climateportal/index.cfm?page=country_historical_ climate&ThisRegion=Africa&ThisCCode=UGA(accessed on 2 May 2016).
66. Redsteer, M.; Kelley, K.; Francis, H.; Block, D. Global Assessment Report on Disaster Risk Reduction: Chapter 3: Drought Risk. 2011. Available online:http://www.preventionweb.net/english/hyogo/gar/ 2011/en/bgdocs/Redsteer_Kelley_Francis_&_Block_2010.pdf(accessed on 23 January 2017).
67. Brocks, N.; Adger, W.N.; Kelly, P.M. The determinants of vulnerability and adaptive capacity at the national level and the implications for adaptation.Glob. Environ. Chang.2005,15, 151–162. [CrossRef]
68. Sivakumar, M.V.K.; Das, H.P.; Brunini, O. Impacts of present and future climate variability and change on agriculture and forestry in the arid and semi-arid tropics.Clim. Chang.2005,70, 31–72. [CrossRef]
69. Hentschel, J.; Lanjouw, J.O.; Lanjouw, P.; Poggi, J. Combining census and survey data to trace the spatial dimensions of poverty: A case study of Ecuador.World Bank Econ. Rev.2000,14, 147–165. [CrossRef] 70. Alderman, H.; Babita, M.; Demombynes, G.; Makhatha, N.; Özler, B. How low can you go? Combining
census and survey data for mapping poverty in South Africa.J. Afr. Econ.2002,11, 169–200. [CrossRef] 71. Smit, B.; Pilifosova, O. From adaptation to adaptive capacity and vulnerability reduction. InClimate Change,
Adaptive Capacity and Development; Smith, J.B., Klein, R.J.T., Huq, S., Eds.; Imperial College Press: London, UK, 2003.
72. Bangladesh Bureau of Statistics and United Nations World Food Programme.Local Estimation of Poverty and Malnutrition in Bangladesh; Bangladesh Bureau of Statistics: Dhaka, Bangladesh, 2004.
73. Benson, T.; Chamberlin, J.; Rhinehart, I. An investigation of the spatial determinants of the local prevalence of poverty in rural Malawi.Food Policy2005,30, 532–550. [CrossRef]
74. Minot, N.B.; Baulch, H.; Epprecht, M.Poverty and Inequality in Vietnam: Spatial Patterns and Geographic Determinants; Research Report No. 148; International Food Policy Research Institute: Washington, DC, USA, 2006.
75. Alkire, S.; Santos, M.E.Acute Multidimensional Poverty: A New Index for Developing Countries; OPHI Working Paper No. 38; Oxford Poverty and Human Development Initiative: Oxford, UK, 2010.
76. Daniels, L. Measuring Poverty Trends in Uganda with Non-Monetary Indicators. 2011. Available online:http://www.fao.org/fileadmin/templates/ess/pages/rural/wye_city_group/2011/documents/ session3/Daniels_-_Paper.pdf(accessed on 9 May 2016).
77. Uganda Bureau of Statistics, UBOS. 2002 Uganda Population and Household Census Analytical Report: Education and Literacy. 2006. Available online:http://www.ubos.org/onlinefiles/uploads/ubos/pdf% 20documents/2002%20CensusEducAnalyticalReport.pdf(accessed on 9 May 2016).
78. Lobell, D.B.; Schlenker, W.; Costa-Roberts, J. Climate trends and global crop production since 1980.Science 2011,333, 616–620. [CrossRef] [PubMed]
79. Nicholson, S.E.; Trucker, C.J.; Ba, M.B. Desertification, drought and surface vegetation: An example from the West African Sahel.Bull. Am. Meteorol. Soc.1998,79, 815–829. [CrossRef]
81. Peng, C.; Ma, Z.; Lei, X.; Zhu, Q.; Chen, Q.; Wang, W.; Liu, S.; Li, W.; Fang, X.; Zhou, X. A drought-induced pervasive increase in tree mortality across Canada’s boreal forests. Nat. Clim. Chang. 2011,1, 467–471. [CrossRef]
82. Thornton, P.; Jones, P.G.; Alagarswamy, G.; Anderson, J.; Herrero, M. Adapting to climate change: Agricultural systems and household impacts in East Africa.Agric. Syst.2010,103, 73–82. [CrossRef] 83. Sen, A.K. Poverty and famines: An essay on entitlement and deprivation. Clarendon Press: Oxford, UK, 1981. 84. Moser, C.O.N. The asset vulnerability framework: Reassessing urban poverty reduction strategies.World Dev.
1998,26, 1–19. [CrossRef]
85. Minot, N.; Epprecht, M.; Anh, T.T.T.; Trung, L.Q.Income Diversification and Poverty in the Northern Uplands of Vietnam; Research Report No. 145; International Food Policy Research Institute: Washington, DC, USA, 2006. 86. Gbetibouo, G.; Ringler, C.; Hassan, R. Vulnerability of the South African farming sector to climate change
and variability: An indicator approach.Nat. Res. Forum2010,34, 175–187. [CrossRef]
87. Defiesta, G.; Rapera, C. Measuring adaptive capacity of farmers to climate change and variability: Application of a composite index to an agricultural community in the Philippines.J. Environ. Sci. Manag.2014,17, 48–62. 88. Pretty, J. Social capital and the collective management of resources.Science2003,302, 1912–1914. [CrossRef]
[PubMed]
89. Scoones, I. Sustainable Rural Livelihoods: A Framework for Analysis in Working Paper, 72; Institute of Development Studies: Sussex, UK, 1998.
90. Rakodi, C.A. Capital assets framework for analyzing household livelihood strategies: Implications for policy.
Dev. Policy Rev.1999,17, 315–342. [CrossRef]
91. Niang, I.; Ruppel, O.C.; Abdrabo, M.A.; Essel, A.; Lennard, C.; Padgham, J.; Urquhart, P. IPCC Working Group II: Climate Change Assessment Report. Chapter 22 Africa. 2014. Available online:https://www.ipcc. ch/pdf/press/ipcc_leaflets_2010/ipcc_ar5_leaflet.pdf(accessed on 23 January 2017).
92. Olsson, L.; Opondo, M.; Tschakert, P.; Argawal, A.; Eriksen, S.H.; Ma, S.; Zakieldeen, A.A.; Cutter, S. Livelihoods and Poverty. InClimate Change 2014: Impacts, Adaptation, and Vulnerability. Part A: Global and Sectoral Aspects. Contribution of Working Group II to the Fifth Assessment Report of the Intergovernmental Panel on Climate Change; Field, C.B., Barros, V.R., Dokken, D.J., Mach, K.J., Mastrandrea, M.D., Bilir, T.E., Chatterjee, M., Ebi, K.L., Estrada, Y.O., Genova, R.C., et al., Eds.; Cambridge University Press: Cambridge, UK; New York, NY, USA, 2014; pp. 793–832.
93. Osbahr, H.; Dorward, P.; Stern, R.; Cooper, S. Supporting agricultural innovation in Uganda to respond to climate risk: Linking climate change and variability with farmer perceptions.Exp. Agric.2010,47, 293–316. [CrossRef]
94. Okonya, J.; Syndikus, K.; Kroschel, J. Farmer’s perception of and coping strategies to climate change: Evidence from six agro-ecological zones of Uganda.J. Agric. Sci.2013,5, 252–263.
![Figure 2.Figure 2. Maize crop calendar for Uganda. Source: the authors’ conceptualization inspired by FAO [63]](https://thumb-us.123doks.com/thumbv2/123dok_us/7746903.166457/6.595.113.481.539.690/figure-figure-calendar-uganda-source-authors-conceptualization-inspired.webp)