οο
en
σι
Demographic
o
û
LUoo
σι
σι
Demographic
statistics
Data 1995-98
It can be accessed through the Europa server (http://europa.eu.int).
Cataloguing data can be found at the end of this publication.
Luxembourg: Office for Official Publications of the European Communities, 1999
TABLE OF CONTENTS
INTRODUCTION IX
THE DEMOGRAPHIC SITUATION OF THE EUROPEAN UNION X
EXPLANATORY NOTES XIV
LIST OF GROUPS OF COUNTRIES XXIII
DESCRIPTION OF EUROSTATS DEMOGRAPHIC DATABASE XXVI
EUROSTAT PUBLICATIONS XXVIII
LIST OF NATIONAL STATISTICAL INSTITUTES XXXI
A - POPULATION CHANGE
Tables:
A-1
A-2
A-3
A-4
A-5
A-6
Population'change in EU-15, 1960-1998 3
Crude rate of natural increase, 1960-1997 4
Crude rate of net migration, 1960-1997 4
Crude rate of increase, 1960-1997 4
Population change, 1996 6
Population change, 1997 7
Figures:
A-1
A-2
A-3
Total population in EU-15 2
Population increase in EU-15 2
Live births and deaths in EU-15 2
Β - POPULATION STRUCTURE
Tables:
B-1: Population on 1 January, total, 1960-1998 12
B-2: Population on 1 January, males, 1960-1998 14
B-3: Population on 1 January, females, 1960-1998 16
B-4: Proportion of total population aged 0-14,1960-1997 18
B-5: Proportion of total population aged 15-24,1960-1997 18
B-6: Proportion of total population aged 65-79, 1960-1997 20
B-7: Proportion of total population aged 80+, 1960-1997 20
B-8: Age dependency ratio, 1
s'variant, 1960-1997 22
B-9: Age dependency ratio, 2
ndvariant, 1960-1997 22
B-10: Population by age group on 1 January 1997, total 24
B-11 : Population by age group on 1 January 1997, males 26
B-12: Population by age group on 1 January 1997, females 28
B-13: Average population, 1960-1997 30
B-14: Average population by age group, total, 1996 32
B-15: Average population by age group, males, 1996 34
B-16: Average population by age group, females, 1996 34
B-17: Population by citizenship on 1 January 1996, total 36
B-18: Population by citizenship on 1 January 1996, males 38
B-19: Population by citizenship on 1 January 1996, females 40
B-20: Proportion of population by age group and household position on 1 January 1995, males 42
B-5: Dependency ratio of the young in EU-15 11
B-6: Dependency ratio of the old in EU-15 11
B-7: Age pyramid on 1 January 1997 by Member State 50
B-8: Population by citizenship group on 1 January 1996 by Member State 55
B-9: Population by citizenship group on 1 January 1996 in EU-15 55
B-10: Main groups of non-nationals on 1 January 1996 in EU-15 56
B-11: Non-national population of the EU-15,1985-1996 56
C - THE EUROPEAN UNION AND ITS REGIONS
Table:
C-1: Main demographic indicators by region, 1995 80
Figures:
C-1
C-2
C-3
C-4
C-5
C-6
C-7
C-8
C-9
Population density, 1995 59
Crude rate of total population increase, 1995 61
Crude rate of natural population increase, 1995 63
Crude rate of net migration, 1995 65
Proportion of population aged under 15 years, on 1 January 1995 67
Proportion of population aged under 15 years, on 1 January 2015 69
Proportion of population aged 65 and over, on 1 January 1995 71
Proportion of population aged 65 and over, on 1 January 2015 73
Total age dependency ratio, on 1 January 1995 75
C-10: Total age dependency ratio, on 1 January 2015 77
D - THE EUROPEAN UNION IN THE WORLD
Tables:
D-1
D-2
D-3
D-4
Population of the major regions of the world, 1950-2025 95
Main demographic indicators for the major regions of the world, 1995 95
Main demographic indicators for the European countries, 1997 96
Main demographic indicators for the Mediterranean countries, 1997 102
Figures:
D-1: World population 94
E - FERTILITY
Tables:
E-1: Main indicators of fertility in EU-15, 1960-1997 107
E-2: Live births, 1960-1997 108
E-3: Live births outside marriage, 1960-1997 108
E-4: Proportion of live births outside marriage, 1960-1997 108
E-5: Proportion of live births of first birth order, 1960-1996 110
E-6: Proportion of live births of second birth order, 1960-1996 110
E-7: Proportion of live births of third birth order, 1960-1996 112
E-8: Proportion of live births of fourth and more birth order, 1960-1996 112
E-16: Proportion of childless women by generation, 1930-1962 120
E-17: Proportion of women with only one child by generation, 1930-1962 120
E-18: Proportion of women with two children by generation, 1930-1962 122
E-19: Proportion of women with three children by generation, 1930-1962 122
Figures:
E-1
E-2
E-3
Total fertility rate and completed fertility in EU-15 106
Mean age of women at childbearing by calendar year and generation in EU-15 106
Fertility rates by age of the mother, by Member State 124
F - NUPTIALITY
Tables:
F-1: Main indicators of nuptiality in EU-15,1960-1997 131
F-2: Marriages, 1960-1997 132
F-3: Crude marriage rate, 1960-1997 132
F-4: First marriages, males, 1960-1996 134
F-5: First marriages, females, 1960-1996 134
F-6: Proportion of first marriages, males, 1960-1996 136
F-7: Proportion of first marriages, females, 1960-1996 136
F-8: Marriages of widowers, 1960-1996 138
F-9: Marriages of widows, 1960-1996 138
F-10: Marriages of divorced males, 1960-1996 140
F-11 : Marriages of divorced females, 1960-1996 140
F-12: Total first marriage rate, males, 1960-1996 142
F-13: Total first marriage rate, females, 1960-1996 142
F-14: Mean age at first marriage, males, 1960-1996 144
F-15: Mean age at first marriage, females, 1960-1996 144
F-16: Proportion of ever-married males bygeneration, 1930-1962 146
F-17: Proportion of ever-married females by generation, 1930-1962 146
F-18: Divorces, 1960-1997 148
F-19: Crude divorce rate, 1960-1997 148
F-20: Total divorce rate, 1960-1996 150
F-21: Mean marriage duration at divorce, 1960-1996 150
F-22: Proportion of marriages dissolved by divorce by marriage cohort, 1950-1980 152
F-23: Mean marriage duration at divorce by marriage cohort, 1950-1980 152
Figures:
F-1: Crude marriage and divorce rate in EU-15 130
F-2: Proportion of marriages dissolved by divorce by calendar year and marriage cohort in EU-15 130
G - MORTALITY
Tables:
G-1
G-2
G-3
G-4
G-5
G-6
Main indicators of mortality in EU-15,1960-1997 157
Deaths, total, 1960-1997 158
Deaths, males, 1960-1997 158
Deaths, females, 1960-1997 158
Life expectancy at certain ages, males, 1960-1997 160
G-12: Infant mortality rate, 1960-1997 182
G-13: Neonatal mortality rate, 1960-1996 182
G-14: Early neonatal mortality rate, 1960-1996 182
G-15: Stillbirths, 1960-1996 184
G-16: Late foetal mortality rate, 1960-1996 184
G-17: Perinatal mortality rate, 1960-1996 184
Figures:
G-1
G-2
G-3
G-4
Life expectancy at birth in EU-15 156
Life expectancy at birth, difference between males and females in EU-15 156
Infant mortality rate in EU-15 156
Probabilities of dying by sex and age by Member State 186
H - INTERNATIONAL MIGRATION
Tables:
H-1
H-2
H-3
H-4
H-5
H-6
H-7
H-8
Total net migration, 1960-1997 194
Immigration, 1985-1996 196
Emigration, 1985-1996 198
Asylum-seekers, 1985-1996 200
Refugees, 1985-1996 200
Acquisition of citizenship, 1980-1996 202
Immigration by main groups of citizenship, 1996 204
Emigration by main groups of citizenship, 1996 204
Figures:
H-1
H-2
H-3
H-4
Total net migration in EU-15 206
Immigration and emigration, 1996 206
Acquisition of citizenship in EU-15 206
Immigration and emigration by main groups of citizenship, 1996 207
I - POPULATION PROJECTIONS
Tables:
1-1
I-2
I-3
I-4
I-5
I-6
I-7
I-8
I-9
Assumptions used for the most recent national population forecasts 210
Population by age group on 1 January 2000, national forecasts 212
Population by age group on 1 January 2005, national forecasts 212
Population by age group on 1 January 2010, national forecasts 214
Population by age group on 1 January 2020, national forecasts 214
Base population used for national household scenarios 216
Aggregated assumptions used for national household scenarios 218
Population by household position on 1 January, national scenarios 224
Private households by size on 1 January, national scenarios 230
J - SELECTED CENTRAL AND EASTERN EUROPEAN COUNTRIES, CYPRUS AND
MALTA
Tables:
J-1
J-2
Population on 1 January, total, 1960-1998 236
J-7: Population by age group on 1 January 1997, total 240
J-8: Population by age group on 1 January 1997, males 242
J-9: Population by age group on 1 January 1997, females 244
J-10: Proportion of live births outside marriage, 1960-1997 246
J-11: Total fertility rate, 1960-1997 246
J-12: Net reproduction rate, 1960-1996 246
J-13: Mean age of women at childbearing, 1960-1996 248
J-14: Completed fertility by generation, 1945-1962 248
J-15: Marriages, 1960-1997 250
J-16: Crude marriage rate, 1960-1997 250
J-17: Total first marriage rate, females, 1960-1996 252
J-18: Mean age at first marriage, females, 1960-1996 252
J-19: Divorces, 1960-1997 254
J-20: Crude divorce rate, 1960-1997 254
J-21: Total divorce rate, 1960-1996 254
J-22: Life expectancy at certain ages, 1960-1997 256
J-23: Deaths of children under one year, 1960-1997 260
J-24: Infant mortality rate, 1960-1997 260
INTRODUCTION
Eurostat's
"Demographic Statistics 1998"
sets out
data relating not just to the European Union and its 15
Member States, but also to the other member
countries of the European Economic Area plus
Switzerland, as well as selected Central and Eastern
European countries, Cyprus and Malta.
In this edition of the yearbook, the provisional main
demographic indicators for the previous calendar year
- collected for the first time together with the Council
of Europe - are also presented. The national reports
on the demographic situation in each country,
however, refer to 1996.
Moreover, for the first time, data for the EU Member
States are provided on past and future population
structures by sex, age and household position as well
as on households by size.
which will save users considerable time and will
minimize the risk of errors from multiple data
acquisition. Further information on this database is
given in the following pages.
The tables have been compiled directly from the data
provided by the National Statistical Institutes and from
international publications (United Nations, US Bureau
of the Census, Council of Europe) for other
non-reporting countries.
The demographic indicators of the EEA countries,
Switzerland and the aggregations of countries have
been compiled using
SYSCODEM,
a series of
programs designed to ensure comparability between
countries. The system permits the use of a common
method for computation of the various demographic
indicators.
To avoid this publication becoming too bulky, events,
rates, and probabilities for each year of age are not
presented as tables, but in graph form.
Data by single years of age nevertheless remain
available in the Eurostat demographic database,
Eurostat's thanks go to the National Statistical
Institutes and the Council of Europe, whose
co-operation has been an essential factor in the
completion of this publication.
THE DEMOGRAPHIC SITUATION IN THE EUROPEAN UNION
General features
With its 375 million inhabitants on the 1st of January
1998, the European Union is the third largest world
power after China (1 234 million) and India (976
million). It is ahead of the United States (269 million).
The present Union covers nearly 75% of the
European population (excluding most of the former
Soviet Union, parts of the former Republic of
Yugoslavia and Turkey). The 12 Central and Eastern
European countries (
1), many of which are potential
future Member States of the European Union, have a
total population of about 110 million inhabitants.
Poland is the biggest of those countries with a
population of 38.7 million. Romania (22.5 million),
Czech Republic and Hungary - both with populations
of 10 million - are in the middle and the rest are
countries with less than 10 million inhabitants.
The EU's share of the world population has been
decreasing for a long time. In 1950 the countries
which now comprise the EU embraced almost 12%
of mankind. Currently this figure is less than 7%. The
population of most of the less developed countries
continues to grow rapidly, whilst the crude population
growth rate of the EU is relatively low. In 1997 it was
2.3%
0, which was three times lower than that
reported for the USA. In India, for example, the
increase was six times higher than seen in the EU.
In most other developed countries, population
growth was somewhat lower than in the EU, and in
most of the countries of Central Europe the
population was in decline.
The six largest EU countries by area (France, Spain,
Sweden, Germany, Finland and Italy) occupy nearly
80% of the total territory. The five countries with
biggest populations i.e. Germany, United Kingdom,
France, Italy and Spain represent 80% of the whole
population of the Union. Population density ranges
from only 15 inhabitants per square km in Finland to
nearly 400 inhabitants in Netherlands. The
population is densest in the middle of Europe
running in a belt from the North of Italy through
South and West Germany and Benelux countries to
Southern England. Border regions of the EU to every
direction are less densely populated. In 1991, more
than half of the population in EU countries lived in
urban settlements being defined as compact areas
with a population density of at least 500 persons per
square km. The percentage ranges, however, from
only 21% in Sweden to 77% in United Kingdom.
In 1995 the total fertility rate in the EU reached a
new post-war low of 1.42 children per woman. The
level in 1996 and 1997 is estimated at 1.44, similar
to that of 1994. For Japan and for many other more
developed countries, similar low levels have been
estimated, although the rate in the USA is above 2.
Most of the less developed countries have recorded
levels of well above 3.
The completed fertility of post war generations has
been steadily declining and is now around 1.8, well
below reproduction level (2.1 children per woman).
According to the most recent data (1996, 1997),
however, the fall in fertility seems to have reached
the bottom after decades of almost continuous
decline.
The age structure of the EU population has been
changing, not only through fewer births but also
through an expanding life span.
Since 1945 life expectancy at birth in the EU has
increased almost continuously. After falling back in
1995 the upward trend was resumed in 1996. For
the Union as a whole, it is estimated that all-time
highs have been reached: at birth girls can now
expect to live an average of 80.5 years and boys
74.1 years, which is 10 years more than recorded in
1945.
The corresponding figures for the United States were
72.8 for men and 79.5 for women and for Japan 77.0
and 83.3. In most other developed countries,
average life spans are shorter than in the EU: the
most extreme case appears to be the Russian
Federation, where the average man (woman) now
lives 13.1 (7.4) years less than his (her) EU
counterpart. Similar or even greater differences can
be found in most less developed countries although
the deficit in China is relatively small, with boys living
six years less than their EU counterparts and girls
nine years less than theirs.
countries the share varies between 1% and 4%. For
EU-nationals, Luxembourg (29%) and Germany
(5%) have the greatest share of EU non-nationals
while in the other countries the percentage ranges
from just 0% to 2%.
47% of immigrants to EU countries are citizens of
some EU country. They are either returning to their
own country or moving to another EU country. 31%
of immigrants are nationals of European countries
which are not members of the EU and 22% are
non-Europeans.
Half of the foreigners from outside the Community
come from other countries in Europe, especially
Turkey, former Yugoslavia, Poland and former
USSR. The Maghreb countries (Morocco, Algeria
and Tunisia) account for 18.2% of the resident
non-nationals.
Returning nationals account for a substantial
proportion of the immigration flows into EU countries.
In Denmark, Spain, Italy, Ireland and the United
Kingdom, half of all immigrants are returning
nationals.
European Union: short and
medium-term trends
Slowdown in population growth
Population growth in the European Union is still
positive, but its current level (2.3 fe) is one third that
recorded at the beginning of the sixties. Over the
same period, the natural growth rate fell steadily
(from almost 8 fe to 0.9 fe in 1997). The overall
population increase was positive in all fifteen
countries of the Union. However, the natural
increase was negative in Germany (-0.6 fe) and in
Italy (-0.4 fe).
Migration is still important
Since the mid-1980s, international migration has
rapidly gained in importance as a component of
population change. During the period 1990-1997,
total net migration to the EU amounted to well over 6
million people. In 1995, immigration contributed
nearly 75% of EU population growth, a new post-war
high. Although the share of net migration decreased
both in 1996 (71%) and 1997 (61%), it is still a major
Germany, Italy and Sweden would be in decline.
This is also nearly so in Greece and in Spain. In
France, natural increase is still more important, as is
the case in Ireland, the Netherlands, Austria and
Finland. A recent feature of Ireland is that it has also
a fairly significant level of net migration.
Upturn in fertility?
Between 1960 and 1975 the average age of women
at the birth of their first child fell, but has since
increased steadily in all the countries of the Union.
The resultant birth lag has compounded the fall in
the total fertility indicator reaching the bottom of 1.42
children per woman in 1995. The levels in 1996 and
1997 were at 1.44, similar to that in 1994. The EU's
total fertility rate seems to have bottomed out after
years of decline.
Countries with the highest fertility at the beginning of
the 1980s (southern Europe, Ireland) are those
where it has since fallen most (by more than 30%),
with the result that at present the total fertility
indicator is lowest in Spain (1.15) and in Italy (1.22).
It is highest in Ireland (1.92), followed by Finland and
Denmark (1.75) and France, Luxembourg and
United Kingdom (1.71). The fertility rate in Sweden,
previously among the highest in the Union, continued
its sharp fall from 1.73 in 1995 to 1.60 in 1996 and
1.52 in 1997.
Life expectancy is increasing
The age structure of the EU population has been
changing, not only through fewer births but also
through expanding life span. Life expectancy at birth
is a main indicator used to measure mortality
differences between sexes, and changes over time.
Since 1945 life expectancy at birth in the EU has
increased almost continuously. The increase slowed
down in early 1990's although a slight increase has
still continued.
Ageing of the populations of the EU Member States
gains ground both 'bottom-up' through fewer births
and 'top-down' through extending longevity. During
the period 1975 - 1996 the number of people aged
under 25 within the EU dropped from 135 million to
113 million (- 22 million), while during the same time
the number of people aged 65 or more increased
from 45 to 58 million (+ 13 million).
In all EU countries the number of old people will
increase considerably. Particularly, in the currently
least aged Member States of the Union, Finland,
Ireland, Luxembourg and the Netherlands, the
elderly population will grow rapidly. However, by
2050 Italy and Spain are expected to be the most
aged EU countries.
At the regional level regions with a high percentage
of aged are to be found in the central and southern
regions of France, the Iberian peninsula, Italy,
Sweden, south-west England and Wales. In 2025
most regions will have substantially higher shares of
elderly than in 1995.
According to population projections, ageing will
accelerate in the future, especially when the
post-war big generations leave the child-bearing age and
move into the "old age brackets".
Demographic trends in selected Central
and Eastern European countries
01Since 1990 the countries of Central and Eastern
Europe have experienced a new wave of
demographic changes, particularly in the field of
relational and reproductive behaviour. These rapid
demographic changes are a reflection of the radical
political, economic and social changes which the
countries of this region are currently undergoing.
The level of fertility, which varies from one country to
another, has dropped in all these countries below the
level required to maintain the long-term replacement
of population (around 2.1 children per woman). This
usually indicates the growing importance of first and
second births. In the Baltic States, Bulgaria and
Romania, first births already account for more than
50% of all births. The significance of this trend is
(') Albania, Bulgaria, Czech Republic, the former Yugoslav
behavioural patterns of families and the present
attitude of young couples towards the desired
number of children, which seems to be getting lower
and lower.
Indeed, fertility levels in Central and Eastern
European countries have been dropping faster
during the last 16 to 17 years than the EU average.
In 1980 the total fertility rates in all those countries
were well over the EU average (1.82) while the
situation was reversed in 1997, topping the EU
average (1.44) only in Poland (1.51) and in the
former Yugoslav Republic of Macedonia (1.90 in
1996). In fact the fertility levels of the Central and
Eastern European countries are now rather similar to
the levels found in the rest of Europe.
The fall in fertility rates has led to negative natural
increase of the population in most of these countries.
Also the total population change has become
negative, because net migration does not
compensate negative natural increase, as it has
done in the EU countries. In fact, positive total
increase (per 1000 population) was recorded in 1997
only in Poland (0.5), Slovak Republic (1.6) and in the
former Yugoslav Republic of Macedonia (6.9).
Marriage, as an institution, has seen considerable
changes also in the Central and Eastern European
countries during the past 16 - 17 years. The
marriage rates of these countries have traditionally
been high and exceeded the EU average (6.3) in
every country concerned. In recent years there has
been a clear convergence towards the same levels
as in the EU, with a little more than half of them
exceeding the EU average and slightly less than half
diving under. In divorce rates there has also been
some sort of convergence, but of a different kind.
The traditionally high divorce rates of the Central and
Eastern European countries have gone down or
remained at the same level, while in the EU
countries there has been a general increase of
divorce rates from the 1980s.
rates for 1996 and 1997.
Infant mortality rate, also an important mortality
indicator, has on the other hand dramatically
declined also in many Central and Eastern European
countries, albeit from higher levels than in the EU. In
1996 and 1997 they have roughly reached the levels
of the EU countries in early 1980s.
EXPLANATORY NOTES
GENERAL
The statistics on births, marriages and deaths
published in this book are those supplied by the
national systems for the registration of such events.
The registration system is run under the authority of
the Ministry of the Interior or the Ministry of Justice, or
both, except in Ireland and the United Kingdom where
they come under the Office of the Registrar-General,
a self-contained department.
In certain cases the statistics on marriages and
divorces have been taken from other sources. In a
number of Member States data on marriages may be
drawn from records of church weddings. Divorce
statistics are drawn from court records. Divorce was
not allowed in Ireland before 1995. In most countries
the data are centralised by the Ministry of the Interior
and forwarded to the national statistical institute.
definition leads to significant differences, particularly
in analysis by age, since the exact age in rates
expressed in terms of "age last birthday" is likely to
be around half a year more than that for rates
compiled by reference to "age reached".
To cope with this problem Eurostat has established
SYSCODEM,
a permanent conversion method first
used in 1991, which for statistics on fertility and first
marriages, permits comparability of data compiled
according to any definition from across the European
Union. This system was made available to Eurostat
by INED, the French National Institute of
Demographic Studies.
Throughout the book, data for Germany refer to the
Federal Republic within its frontiers after 3 October
1990. Data for France are for metropolitan France,
including Corsica.
Statistics on population, births, marriages and deaths
cover both nationals and non-nationals habitually
resident in the country concerned. Demographic
events not taking place on the territory are not
brought into national statistics. The statistics of births,
marriages and deaths contained in this publication
relate to the events which took place during the year,
not to the events registered during the year.
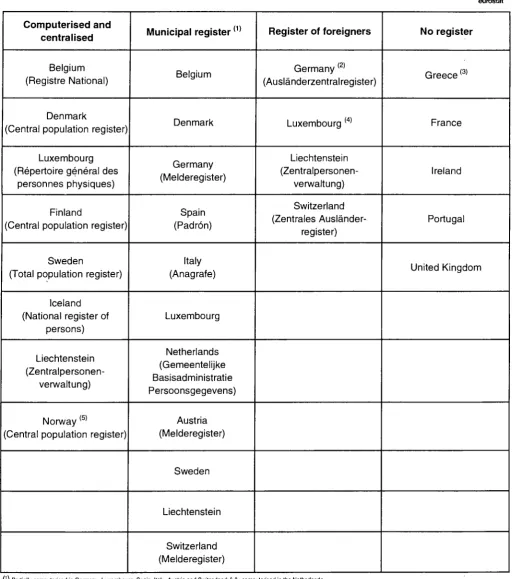
Nine of the Union's 15 Member States maintain
municipal population registers (Table 1). The principle
of such registers is an exhaustive and
continuously-updated record of the population. In most cases the
administration of the local territorial unit is responsible
for maintaining the population register (births, deaths,
changes of residence, etc.).
One cause of variation in the data used is the lack of
uniform definitions for the events registered, or
uniform registration of events, or uniform statistical
exploitation of civil population records.
Two definitions of age may be used for the
classification of events occurring in a given year by
age of the person concerned:
• the age reached during the calendar year under
review, i.e. the year of observation minus the year
of birth;
• the age in full years at the time of the event, i.e.
the age last birthday.
The totals for the Union referto all 15 Member States;
the totals for the Economic and Monetary Union
(EUR-11) refer to the 11 participating countries in the
EURO.
The data for the European Economic Area do not
include those for Liechtenstein when these are not
available. In a few cases figures are estimated by
Eurostat when the countries cannot provide data for a
single year.
The figures relating to the Selected Central and
Eastern European countries, Cyprus and Malta,
originally provided by the Council of Europe, have
been checked and extended to the latest available
years from the National Statistical Institute.
The remaining countries data have been taken from
the Council of Europe, the United Nations and the US
Bureau of the Census.
The graphs contain some estimates made by
Eurostat.
CHAPTERS A AND B: POPULATION
CHANGE AND STRUCTURE
eurostat
Computerised and
centralised
Belgium
(Registre National)
Denmark
(Central population register)
Luxembourg
(Répertoire général des
personnes physiques)
Finland
(Central population register)
Sweden
(Total population register)
Iceland
(National register of
persons)
Liechtenstein
(Zentralpersonen-verwaltung)
Norway
<5)(Central population register)
Municipal register
(1)Belgium
Denmark
Germany
(Melderegister)
Spain
(Padrón)
Italy
(Anagrafe)
Luxembourg
Netherlands
(Gemeentelijke
Basisadministratie
Persoonsgegevens)
Austria
(Melderegister)
Sweden
Liechtenstein
Switzerland
(Melderegister)
Register of foreigners
Germany
(2)(Ausländerzentral register)
Luxembourg
(4)Liechtenstein
(Zentralpersonen-verwaltung)
Switzerland
(Zentrales
Ausländer-register)
No register
Greece
(3>France
Ireland
Portugal
United Kingdom
(') Partially computerised in Germany, Luxembourg, Spain, Italy, Austria and Switzerland; fully computerised in the Netherlands (2) Computerised and cc ntralised register
(3) Records are kept at municipal level lor Greek nationals only
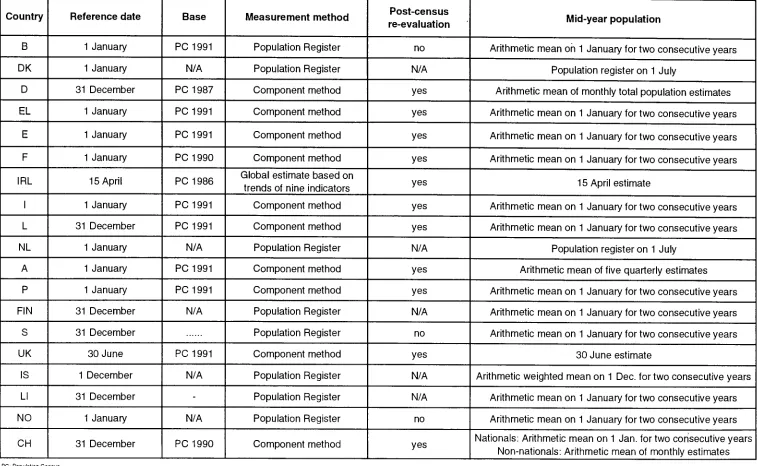
[image:17.595.48.562.50.630.2]April, and the United Kingdom at 30 June. These
estimates then serve as a mean population.
Iceland estimates its population at 1 December.
The remaining countries principal estimates are made
either at 1 January or at 31 December. The
estimation method varies according to the
observation method.
• Belgium, Denmark, the Netherlands, Finland,
Sweden, Iceland and Norway rely on the state of
the population register at a given date.
• Germany, Luxembourg and Italy use the register
to obtain a figure of net migration which, added to
the natural balance, gives the total population
increase. Switzerland calculates its national
population by the same process, but its
non-national population is obtained from the register of
foreign nationals.
• Greece, Portugal and France compile net
migration from various sources, while the United
Kingdom estimates it from a specific survey at the
frontier (the International Passenger Survey).
• Ireland makes a global estimate of its population
using a number of indicators and calculates net
migration (Labour Force Survey) applying natural
movement of population theory.
• Spain estimates annual population figures by
projections based on the latest available census
by using the component method.
Total average mean population is in general the
arithmetical mean of the population at 1 January of
two consecutive years (Table 2), except in:
• Germany, where the arithmetical mean is that of
each of the twelve months;
• Austria, where the arithmetical mean is that of five
quarterly estimates;
• Denmark and the Netherlands, who take the
population register total at 30 June or 1 July.
As indicated in Table 2, a number of countries make
post facto
amendments to their estimates following a
census. The countries which have already transmitted
corrected data for their latest inter-census years are
Greece, Spain, France, Ireland, Italy, Austria,
Portugal, the United Kingdom and Switzerland. In
Luxembourg, no posf
facto
amendments were made
to the population figures following the latest census,
are not more reliable than STATEC's estimates.
Countries use different sources to identify their
population by nationality:
• Belgium, Denmark, Germany, Italy, Luxembourg,
Netherlands, Finland, Sweden, Iceland,
Liechtenstein, Norway and Switzerland use the
population register;
• France and Austria supply latest census results;
• Ireland and the United Kingdom draw their
estimates from the Labour Force Survey;
• Spain, Greece and Portugal use a count of
residence permits.
Eurostat compiles all net migration in chapter A by
taking the difference between total and natural
population increases. This assumes that any
movement of population not attributable to natural
change (births and deaths) is attributable to
migration.
The new tables on the population structure by age
group and household position on 1 January 1995 for
males and females are basically derived from the
European Labour Force Survey 1995. These data
were used as base population numbers for the
compilation of national household scenarios (see
chapter I).
CHAPTER C: THE EUROPEAN UNION
AND ITS REGIONS
Regional demographic statistics at NUTS 2 level are
for 1995, the latest available year.
The sum of total population, births and deaths at
regional level presented in this chapter may produce
slightly different results from national totals. This is
because regional breakdowns are not always fully
known or refer to the different definitions.
Eurostat has also calculated net migration at regional
level, again using the difference between total and
natural population increases. The crude rates
obtained from this are set out in a map.
Table 2: Annual population estimates
L ^
Country
Β
DK
D
EL
E
F
IRL
I
L
NL
A
Ρ
FIN
S
UK
IS
LI
Reference date
1 January
1 January
31 December
1 January
1 January
1 January
15 April
1 January
31 December
1 January
1 January
1 January
31 December
31 December
30 June
1 December
31 December
Base
PC 1991
N/A
PC 1987
PC 1991
PC 1991
PC 1990
PC 1986
PC 1991
PC 1991
N/A
PC 1991
PC 1991
N/A
PC 1991
N/A
-Measurement method
Population Register
Population Register
Component method
Component method
Component method
Component method
Global estimate based on
trends of nine indicators
Component method
Component method
Population Register
Component method
Component method
Population Register
Population Register
Component method
Population Register
Population Register
Post-census
re-evaluation
no
N/A
yes
yes
yes
yes
yes
yes
yes
N/A
yes
yes
N/A
no
yes
N/A
N/A
Mid-year population
Arithmetic mean on 1 January for two consecutive years
Population register on 1 July
Arithmetic mean of monthly total population estimates
Arithmetic mean on 1 January for two consecutive years
Arithmetic mean on 1 January for two consecutive years
Arithmetic mean on 1 January for two consecutive years
15 April estimate
Arithmetic mean on 1 January for two consecutive years
Arithmetic mean on 1 January for two consecutive years
Population register on 1 July
Arithmetic mean of five quarterly estimates
Arithmetic mean on 1 January for two consecutive years
Arithmetic mean on 1 January for two consecutive years
Arithmetic mean on 1 January for two consecutive years
30 June estimate
Arithmetic weighted mean on 1 Dec. for two consecutive years
THE WORLD
Information on countries outside the Eurostat data
collect presented here are generally from
international organisations, in particular the United
Nations, the US Bureau of the Census and the
Council of Europe.
Readers should bear in mind that different countries
use different statistical systems. Data cannot be
assumed to be as comparable as they are between
the Member States of the European Union.
The total population may differ slightly from the sums
of other chapters, due to the use of data from
different years and from different sources.
CHAPTER E: FERTILITY
Fertility rates by age and mean age of women at
childbearing have been recalculated by Eurostat to
the same definition, the age reached during the year
of the event. This permits rates to be recombined by
generation.
The procedure for conversion of rates by age last
birthday to rates by age reached in the calendar year
is described in a work by G. Calot
La mesure des
taux en démographie - âge en années révolues ou
âge atteint dans l'année civile. Incidence du choix de
la définition. Application à la fécondité générale
(France, 1946-1981),
INED TRAVAUX ET DOCUMENTS
No 104, 1984.
The definition of birth order differs between countries.
For this reason birth order data have not been
included in any single table, and the total for the
Union has not been established. The birth order
published is that covering the entire reproductive life
of the mother, used in Denmark, Greece, Spain,
Ireland, Italy, Netherlands, Austria, Portugal, Finland,
Sweden, Iceland and Norway. The birth order
published for Belgium, Germany, France,
Luxembourg, the United Kingdom and Switzerland is
the birth order within the current marriage. France,
Italy, the Netherlands, Portugal and Austria have the
data in both formats.
Estimates for generations which have not yet
completed their productive career are based upon the
ceteris paribus
assumption that future rates will be
the same as the most recent observations. However,
this approach is not applied to the latest generations,
whose life cycle is not sufficiently advanced.
For first marriages, all countries except two have data
by age reached during the year; Ireland and United
Kingdom have data for age last birthday. First
marriage rates have been recomputed by Eurostat by
reference to age reached.
Divorce figures give a valuable insight into trends
within individual countries. Because of the differences
between countries' divorce laws, however, the
comparison of divorce rates and numbers requires
great circumspection.
The divorce indicators by length of marriage - the
total divorce rate, the proportion of marriages
dissolved by divorce by cohort and the mean
marriage duration at divorce - are derived from the
divorce rates by duration of marriage.
These divorce rates have been computed by Eurostat
as the ratio between the number of divorces taking
place at each duration reached during the year and
the initial number of marriages of the corresponding
cohort. Therefore, for England and Wales these rates
are the ratio between the number of divorces at each
duration in completed years (i. e. at last anniversary)
and the average number of marriages in the related
two consecutive previous years.
However, all these rates may slightly
over/under-estimate divorces, since the computations disregard
mortality and international migration of couples.
Estimates for cohorts which have not yet reached the
end of their life are based upon the
ceteris paribus
assumption that future marriage (or divorce) rates will
be the same by age (or by duration of marriage) as
the most recent observations. However, this
approach is not applied to the latest cohorts, whose
life cycle is not sufficiently advanced.
CHAPTER G: MORTALITY
Data on life expectancy at different ages have been
supplied by countries for the period 1960-80. For
years after 1985 life expectancy has been
recomputed by Eurostat.
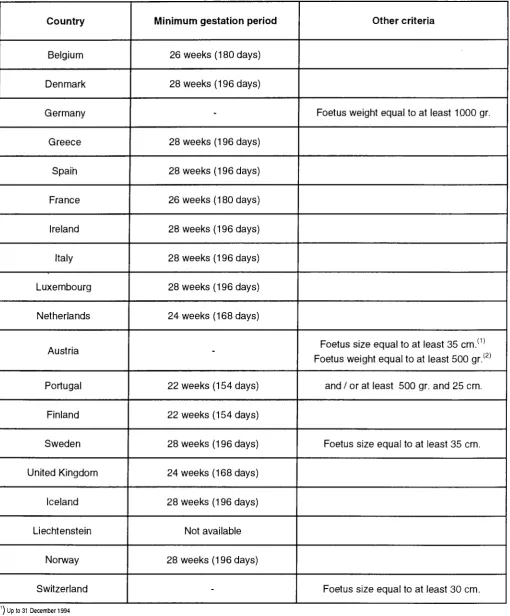
Table 3: Current definitions of foetal death
30
Country
Belgium
Denmark
Germany
Greece
Spain
France
Ireland
Italy
Luxembourg
Netherlands
Austria
Portugal
Finland
Sweden
United Kingdom
Iceland
Liechtenstein
Norway
Switzerland
Minimum gestation period
26 weeks (180 days)
28 weeks (196 days)
-28 weeks (196 days)
28 weeks (196 days)
26 weeks (180 days)
28 weeks (196 days)
28 weeks (196 days)
28 weeks (196 days)
24 weeks (168 days)
-22 weeks (154 days)
22 weeks (154 days)
28 weeks (196 days)
24 weeks (168 days)
28 weeks (196 days)
Not available
28 weeks (196 days)
-Other criteria
Foetus weight equal to at least 1000 gr.
Foetus size equal to at least 35 cm.
1'
1Foetus weight equal to at least 500 gr.
(2)and / or at least 500 gr. and 25 cm.
Foetus size equal to at least 35 cm.
Foetus size equal to at least 30 cm.
, ) Up to 31 December 1994
in the measurement of perinatal mortality (Table 3).
Perinatal mortality therefore includes stillbirths and
late foetal death after a minimum gestation period
(ranging from 22 to 28 weeks according to the
country) and some infant mortality (in different
proportions according to the country).
Causes of death are defined on the basis of the
International Classification of Diseases (ICD) - World
Health Organisation (WHO). Before the reference
year 1996, all countries, except Denmark, used the
ICD-9
threvision. From the reference year 1996
onwards, and for Denmark since the reference year
1994, the ICD-10
threvision is used by Netherlands.
The change from ICD-9 to ICD-10 has led Eurostat to
change, for the reporting year 1996 onwards, some of
the 'groupings' used in the tables G-7 and G-8.
Where this may lead to a disruption in the data series,
it is identified in the footnotes.
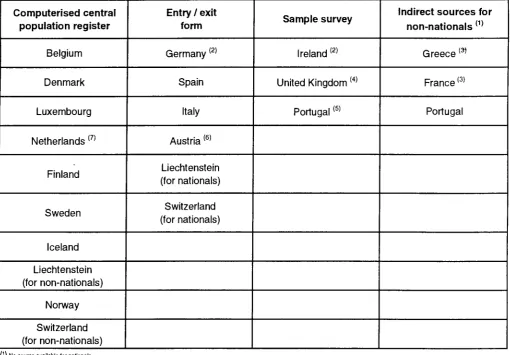
CHAPTER H;
MIGRATION
INTERNATIONAL
The quality of the data produced by the contributing
states is partly dependent upon the type of
administrative system employed in the country, and
upon the way it works (Table 4).
Immigration
Immigration data generally record immigration by
nationals and non-nationals. In France and Portugal,
however, only immigration by non-nationals is
recorded.
The immigration time series from 1960 onwards is
complete for only five countries: Belgium, Denmark,
Netherlands, Finland and Norway. Austria and
Liechtenstein do not produce complete series, and
the partial series produced are not considered
reliable. Greece, France and Portugal have only
provided data since 1991, respectively 1992.
Generally, different definitions are used for nationals
and non-nationals.
For nationals, the following definitions of an immigrant
are in use:
• a person coming or returning from abroad with
the intention of residing in the country (Belgium,
Italy, Luxembourg, Spain and Switzerland) for a
minimum period (Portugal, Finland, Sweden,
Iceland: 1 year; Netherlands .Norway: 6 months;
12 months after spending the previous 12 months
abroad (United Kingdom) or who is already
resident having previously spent one year abroad
(Ireland).
For non-nationals, the following definitions are in use;
an immigrant is:
• a person arriving from abroad with the intention of
residing in the country for a minimum period
(Netherlands and Norway: 6 months; Iceland:
1 year) and in possession of a residence permit
(Belgium, Denmark for nationals of the Nordic
countries, Italy, Luxembourg and Spain:
3 months; Switzerland: 1 year; Portugal, Finland,
Sweden) or of residing as an owner-occupier,
tenant or subtenant (Germany);
a person intending to reside for more than
12 months after spending the previous 12 months
abroad (United Kingdom) or who is already
resident having previously spent one year abroad
(Ireland).
Emigration
Five countries have no data on emigration: Greece,
Spain, France, Austria and Liechtenstein.
An emigrant is:
• a person going abroad with the intention of
residing there (Belgium, Denmark, Spain, Italy,
Luxembourg, Iceland and Switzerland) for a
minimum period (Norway: 6 months; Netherlands,
Portugal, Finland and Sweden: 1 year) or a
person leaving the residence previously occupied
(Germany);
• a person who intends to reside abroad for more
than 12 months after residing in the country for
the previous 12 months (United Kingdom) or who
is already living abroad but previously lived in the
country for one year (Ireland).
CHAPTER I: POPULATION
PROJECTIONS
National population projections by sex and age are
produced by national statistical institutes (regularly
and irregularly), United Nations (every 2 years) and
Eurostat (every 3-5 years).
Table 4: Sources of data on international migration
eurostat
Computerised central
population register
Belgium
Denmark
Luxembourg
Netherlands
<7)Finland
Sweden
Iceland
Liechtenstein
(for non-nationals)
Norway
Switzerland
(for non-nationals)
Entry / exit
form
Germany
(2)Spain
Italy
Austria
(6>Liechtenstein
(for nationals)
Switzerland
(for nationals)
Sample survey
Ireland
(2)United Kingdom
<4)Portugal
(5)Indirect sources for
non-nationals
(1)Greece
(3)France
(3)Portugal
(') No source available tor nationals
(2) A parallel source (the "Auslãnderzentralregister") exists tor the non-national population
(3) A specific question is asked during the Labour Force Survey
(') International Passenger Survey: a voluntary survey organised at frontiers by the ONS. Ot the 100 000 persons leaving the country each year, approximately 1 000 can be regarded as emigrants, and of the 60 000 persons entering the country some 2 500 can be regarded as immigrants (s) Survey on exit migration tlows ot nationals and non-nationals
(6) In force since 1 April 1995