[3!B
eurostat
OFICINA ESTADISTICA DE LAS COMUNIDADES EUROPEAS
DE EUROPA:ISKE FA:LLESSKABERS STATISTISKE KONTOR
STATISTISCHES AMT DER EUROPAISCHEN GEMEINSCHAFTEN
HATIHIKH YnHPEIIA TON EYPOnATKON KOINOTHTON
STATISTICAL OFFICE OF THE EUROPEAN COMMUNITIES
OFFICE STATISTIQUE DES COMMUNAUTES EUROPEENNES
ISTITUTO STATISTICO DELLE COMUNITA EUROPEE
BUREAU VOOR DE STATISTIEK DER EUROPESE GEMEENSCHAPPEN
SERVIQO DE ESTATISTICA DAS COMUNIDADES EUROPEIAS
L-2920 Luxembourg -Tel. 43 01-1 -Telex COMEUR LU 3423
B-1 049 Bruxelles, rue de Ia Loi 200 -
Tel.
299 11 11
Las publicaciones de Eurostat est{m clasificadas por temas y por series. La clasificaci6n se encuentra al final de
Ia obra. Para mayor informaci6n sobre las publicaciones, rogamos se pongan en contacto con Eurostat.
Para los pedidos, dirijanse a las oficinas de venta cuyas direcciones figuran en Ia pagina interior de Ia
contracubierta.
Eurostats publikationer er klassificeret efter emne og serie. En oversigt herover findes bag i hmftet. Yderligere
oplysninger om publikationerne kan fAs ved henvendelse til Eurostat.
Bestilling kan afgives til de salgssteder, der er anf121rt pA omslagets side 3.
Die Veroffentlichungen von Eurostat sind nach Themenkreisen und Reihen gegliedert. Die Gliederung ist hinten in
jedem Band aufgeflihrt. Genauere AuskOnfte Ober die Veroffentlichungen erteilt Eurostat.
lhre Bestellungen richten Sie bitte an die VerkaufsbOros, deren Anschriften jeweils auf der dritten Umschlagseite
der Veroffentlichungen zu finden sind.
Ot
eKMoet~ Til~Eurostat
TQ~IVOIJOUVTatKQTO 9t1Ja KQI KQTO Oetpa. H
GKptj3l'J~ TQ~tV61Jil011ava<ptpeTat OTO
TtAo~
K68e
tK~oon~.fta
AemoiJeptOTepe~ nAilpo<pop(e~oxenK6 IJE
n~ eKMoet~.IJnope!Te va
aneueu-veoee OTilV Eurostat.
fta
n~ napayyeA!e~IJnope!Te va aneueuveoee OTa ypa<pe!a
n<i>AilOil~.TWV ono!wv ot
~teueuvoet~avaypa<povTat OTil
oeA!~a3 Tou
e~w<puMou.Eurostat's publications are classified according to themes and series. This classification is indicated at the end of
the publication. For more detailed information on publications, contact Eurostat.
Orders are obtainable from the sales offices mentioned on the inside back cover.
Les publications d'Eurostat sont classees par theme et par serie. Cette classification est precisee
a
Ia fin
de l'ouvrage. Pour des informations plus detaillees sur les publications, contactez Eurostat.
Pour les commandes, adressez-vous aux bureaux de vente dont les adresses sont indiquees
a
Ia page 3
de Ia couverture.
Le pubblicazioni deii'Eurostat sono classificate per tema e per serie. Tale classificazione
e
precisata alia fine
dell'opera. Per informazioni pill dettagliate sulle pubblicazioni rivolgersi aii'Eurostat.
Per eventuali ordinazioni rivolgersi a uno degli uffici" di vendita i cui indirizzi figurano nella
3a
pagina della
copertina.
De publikaties van Eurostat zijn ingedeeld naar onderwerp en serle. Deze indeling is achter in het boek
opgenomen. Voor nadere informatie over de publikaties kunt u zich wenden tot Eurostat.
Gelieve bestellingen op te geven bij de verkoopbureaus, waarvan de adressen op bladzijde 3 van de omslag zijn
vermeld.
As publica96es do Eurostat estao classificadas por tema e por serie. Esta
classifica~tiioesta indicada no fim da
obra. Para mais informa96es sobre as publicacoes e favor contactar Eurostat.
EXTERNAL TRADE
Monthly statistics
10
D
1995
Luxembourg: Office for Official Publications of the European Communities, 1995
©
ECSC-EC-EAEC, Brussels • Luxembourg, 1995
Reproduction is authorized, except for commercial purposes, provided that the source is acknowledged.
Printed in Germany
Contents
Preface • • . • • . • • • • • • • . • • • • • . • • • •.• • • • • • • • • • • • • • • • • • . • • • . • • . • • • • • • • • • • • • • • • • • • • • • • • • • • •• • • • • • • • • • • • • • • • • • • • • • • • • • •
IV
Abbreviations • • • • • • . • • . • • • • • • • . • • • • • • • • • • • • • • • • . • • • • • • • • • • • • • • • • . • • • • • . . • • . • • • • • • • • • • • • . . . • • • • • • • • • • • • • • • • • • • • • .
IX
Trends In European Union trade ••••••••••••• , ••••••••••••••••••••••••••••••• , •••• , • , , •••••••••• , •••••••••••• , , • •
XI
Table OA: Results of seasonal adjustment •••••• ; • • • . . • • • • • • • • • • • . • • • • • • . . • • • • • • • • • • • • • • • • • • • • • • • • • • • • • • • • • • • . • • •
XII
Table 08: Global trends . . • . . • • . • • • • • • • • • . • • . • • • • • • • • • • • • • • • • • • • • • • • • • • • • • • • • • • • • • • • • • • • • • • • • • • • • • • . • . . • • • • • • • •
XIV
Table OC: Trade by partner countries • • . • • • . • • • • • • • • • • • . • . • . • • • • • • • • • • . • • • • . • • • • • • • • • • • • • • • • • . • • • • . • . . • • • . • • . • • •
XVIII
Table OD: Trade by products • • • • • • . • • • • • • • • • • • . • • • • • • • • . . . • . . • • • • • • • • • • • • • . • • • • • • • • . • • • • • • • • • . • • • • • . • • • • • • • • • . •
XX
Trends In Indices
Table OE: Indices of value, volume and unit value . • • • . • • . • • • • • • • • • • • . • . • • • • • • • • • • • • • • • • • • • • • • • • • . • • • • • • • • • • • • • • • • •
XXII
Table OF: Cover rate, volumes ratio and terms of trade . . • • .. • .. . • • • • . .. .. .. • .. .. .. .. .. .. .. . .. . .. • • • • .. .. .. .. .. . . • •
XXIV
Table OG: Development of Indices of European Union trade • • • • • . • • • • • • • • • • • • • • • • • • . . • • • • . . • • • • • • • • • • . • • • • • • • . • • • • •
XXVI
World trade •••••••••••••••••••••••••••••••••••••••••••••••••••••••• , ••••••••••• , , ••••••••••••••••••••••••••••••
Table 1 A: Trends In world trade • • . • • • . . • • • • • • • • • • • • • • • • • • • . • • • • • • • • • . . • • • • • • • • • • • • • . • • • • • • • • • • • • • • • • . • . • • • • • • • •
3
Table 18: Comparison of trade patterns of EU, the USA, Japan and Switzerland • . • • • • • • • • • • • • • • • • • • • • • • • • • • • • • . • • • • • •
6
Table 1 C: Trends In the trade of the most Important third countries .. .. • • • .. .. .. .. • • • • .. .. .. .. • • .. .. .. • .. • • .. .. .. • .. •
8
Table 1 D: Main trading partners of the third countries • • . . • • • • • • • • • • • • • • • • • . • • • • • • • • • • • • • • • • • • • • • • • • • • • • • • • • • • • • • • •
12
Table 1E: Main trading partners of the EU • • • • • • • • • • . • • • • • • • • • • • . • • • • • • • • • • • • • • • • • • • • • • • • • • • • • • • • • • • • • • • • • • • • . • • •
14 .
Trading partners ... , , ... :. • .. .. • .. • .. .. • .. .. • • • .. • • .. • • ..
15
Table 2A: Development In EU trade •.••.•...••••..•.•••••...••• : • • • • • • • • • • • • • . • • • • • • • • • • • • . • • • • • • • • . • • • • • • . • • •
16
with the rest of the world, the USA, Japan and Switzerland • • . • . • • • • • • • • • • . • • • . • • • • • • • • • • • • • • • • • • • • • . • • • • •
17
Table 28: Trends In the trade of goods with main partners - annual data •.••••.•..•••• ; • . • . . • . . • • • • • . • • • • • • • • • • • . . • • •
18
Table 2C: Trends In the trade of goods with main trading partners- monthly data • • • . • . • • • • • • • • • • • • • • • • • • • • • . • • • • • • • • •
19
Table 2D: Pattern of trade with main trading partners, by product • • • • • • • • • • • • • • • • . • • • • • . • • • • • • • • • • • . • • • • • • • • • • • . • • • •
24
Products traded • • • • • • • • • • • • • • • • • • • • • • • • • • • • • • • • • • • • • • • • • • • • • • • • • • • • • • • • • • • • • • • • • • • • • • • • • • • • • • • • • • • • • • • • • • • • • • • •
29
Table 3A: Main products traded - annual data • • • . • . . • • • • • • • • • • • • • • • • • • • • • • • • • • • • • • • • . • • • • • • • • • • . • • • • • • • • • • • . . • • • •
30
Table 38: Main products traded- monthly data...
31
Table 3C: Geographical pattern of trade, by main products • • • • • • • • • • • • • • • • • • • • . . . • • • • • • • . . • . . . • • • • • . . • • • • • • • • • . . • . •
34
Table 3D: Trade in agricultural products (main categories of product) . • • • • • • • • • . • • • • • • • . . • • • • • . • • • . • • • • . • • . . • • • • • • • • •
42
Table 3E: EU trade in petroleum and petroleum derivatives • • • • . • • . . . • • • . • . . . • • • • • . . . • • • • • • • . . . . • • • • • • • • • . . • • • • • • . .
50
Member States' external trade •••••••••••••••• , • • • • • • • • • • • • • • • • • • • • • • • • • • • • • • • • • • • • • • • • • • • • • • • • • • • • • • • • • • • • • • • • • •
55
Table 4A: Trends In the UE's external trade, by Member State . • . • • • • • • • • . • • • • . • . • . • • • • • • • . . . • • • • • . . • • • • • • • • . . • • • • . •
57
Table 48: Trends in Member States' trade, by geographical zone • • • • . • • • • • • • . • • • • • • • • • . • • • • • • • • • • • • • • • • • • • • • • • • • • • .
58
Table 4C: Geographical pattern of trade of Members States . • • . . • • • • • • • • . • • • • • • • • • • • • • • • • • • • • • • • . . • • • • • • • • . • • • • • . • .
66
Table 4D: Pattern of trade of Member States by product . . • • .. • .. .. • • • .. .. .. • .. • • .. . .. • .. • .. . .. • .. .. .. . • • .. • • .. . • • •
74
EU trade by mode of transport • • • • • • • • • • • • • • • • • • • • • • • • • • • • • • • • • • • • • • • • • • • • • • • • • • • • • • • • • • • • • • • • • • • • • • • • • • • • • • • • • •
83
Table 5: EU trade by mode of transport • • . • • • • • . • • . • • • • • • • • • • . • • • . . . • • • • . • • . • • • • • • • • • • • • • • • . • • • • • • • • • • • • • • • • • •
84
Annexes...
87
Foreword
1.
Introduction
The monthly bulletin on external trade, published by Eurostat
in
the B series, Short-tenn trends, sets out to provide within the
shortest possible deadlines data on short-tenn trends in the European Union's external trade. In particular, it contains data on the
European Union's trade flows with its trading partners and the various economic areas and a breakdown of this data by major
product group. The bulletin also provides an overview, based on data from various international sources, of the place occupied by
the European Union
in
the external trade of its main trading partners and of third countries. Trade flows between MemberS tates are
recorded under the Intrastat system and will be published at a later date.
The European Union's external trade statistics at the most detailed classification level are published monthly on CD-ROM (B
series: Intra and extra-EU trade).
Trends in external trade since 1958 and a comparison with world trade are contained in the publication "External Trade Statistical
Yearbook (Series A)".
External trade statistics are also available on line via the Eurostat data banks (Comext).
The catalogue ofEurostat publications and a detailed methodological description can be found in" External Trade Statistics User's
Guide"
published in all languages of the European Union .
2.
Sources
Since 1978, the Member States have transmitted European Union external trade statistics according to a unifonn methodology laid
down by Council Regulation (EEC) No 1736175. This regulation was amended to take account of the new developments in 1988, i.e.
the introduction of the new external trade classification entitled "Combined Nomenclature" (CN) and the new "Single
Administrative Document".
The tables in this bulletin are compiled by Eurostat from the detailed data transmitted on magnetic tape by the Member States; these
data are broken down according to the eight-digit subheadings of the Combined Nomenclature.
Eurostat wishes to take this opportunity of thanking the relevant departments in the Member States for their cooperation, which
enables it to compile these harmonized European Union statistics and to ensure their quality.
3.
Coverage
The results of the European Union statistics relate to special trade. This comprises:
1)
imports of goods placed in free circulation on their arrival at or on leaving warehouses, Jmports for inward processing and
imports after outward processing (customs procedures);
2)
exports of European Union goods, exports after inward processing and exports for outward processing (customs procedures).
Transit and warehousing traffic are not covered by European Union statistics.
4.
Statistical territory
The statistical territory of the European Union comprises the customs territory of the European Union excluding the French
overseas departments. Thus Greenland, the Canary Islands and Ceuta and Melilla are not covered, while the Azores and Madeira for
Portugal and the Balearics for Spain are.
5.
Goods classification
In
this publication the results are broken down by the sections and divisions of the UN Standard International Trade Classification
(SITC Rev. 3 since 1988) by means of correspondence tables drawn up by Eurostat on the basis of the Combined Nomenclature
(CN).
6.
Trading partners: countries and economic areas
The results of the European Union are broken down by country of origin, country of consigment and country of destination in
accordance with the "Country nomenclature for statistics on European Union external trade and trade between its Member States",
referred to as the Geonomenclature (Geonom).
When goods that originate in third countries and are not in free circulation in the European Union are imported, EU statistics state the
country of origin. When such goods are exported, the country of destination is specified.
7.
Units
Values
The statistical value of goods on import is equal to the customs valuation or to a value determined by reference to the concept of
customs valuation (in the case, for example, of imports from other Member States). It is the CIF value (cost, insurance, and freight).
The statistical value of goods on export is equal to their value at the place and time at which they leave the statistical territory of the
exporting Member State.
It
is the FOB value (free on board).
The value is expressed in European units of account (ecus). The ecu is a "basket" currency unit based on the market exchange rates
of a certain quantity of each European Union currency according to a weighting system involving the five-year average of each
Member State's gross national product and intra-EU trade balance. The rates used in this bulletin are averages of daily rates. The
bulletin contains a table showing the conversion rates used.
Quantity
The statistics give the net weight of the goods.
8.
Confidentiality
Most Member States take measures to guarantee the confidentiality of certain flows of goods. The relevant legislation, the
procedures for implementing it and the range of goods subject to secrecy vary from one Member State to another.
This confidentiality applies to the most detailed level of the classification used for collecting the data; it may therefore refer to all or
only part of a subheading of the Combined Nomenclature. Similarly, confidentiality may apply to imports only or to exports only
and to only some of the variables recorded (value, statistical procedure, quantities, country, partner, etc.).
Measures are taken during collection and during processing by Eurostat to minimise the effect of these headings on the results for the
European Union as a whole; in particular, trade data on these headings are included at higher levels of aggregation and in the totals.
9..
Corrections
Every month the Member States send Eurostat a magnetic tape containing the results for the current month.
In
order to correct these results, the Member States also send every month a magnetic tape containing monthly corrections covering
Indices
1.
Introduction
Changes over time in the value of trade are influenced by variations in prices and the quantities marketed. Indices are used to
measure these two effects. In general, a system of indices is chosen so that the product of the volume index and the price index
expresses the value index. Several systems of indices meeting this requirement may be regularly used. The results obtained by using
one system will generally be different from those obtained by using another. For various reasons the Member States do not use a
common system, and the level of breakdown of their indices by product group and by partner area also varies. Eurostat has therefore
devised its own external trade indices which enable it to calculate, for each Member State, European Union indices on a strictly
comparable basis. These indices may be consulted on the Trend database developed by Eurostat.
2.
Sources of data
There are basically two ways of obtaining information on prices: conducting price surveys by directly approaching importers and
exporters and using data collected by the customs authorities. At present only customs data are available in all the Member States.
Eurostat therefore calculates indices of unit values (values divided by quantities) and uses them as price variation indicators. The
computing programs contain a system for automatically identifying extreme unit values pointing to unlikely price movements.
3.
Extreme values
To avoid a number of restrictions involved in using customs data, Eurostat decided to adopt two basic principles in calculating unit
value indices: using the most detailed data possible and always bearing in mind that the object of the exercise is to break down
variations in value into a "price" component and a "volume" component. 1\vo rules are applied in order to exclude unlikely price
movements. The first is that, given the general level of inflation, the price of a product should not be very different from its level a
year ago. Any variation of five or more points is regarded as suspect. The second- more restrictive- rule is that the variation in the
price of a product in relation to the most recent month for which data are available should not be very different from the average price
variation for similar products. Applying these rules prevents extreme variations due to factors that are unconnected with prices and
would otherwise distort the unit value index. For products whose unit values are rejected, the variations are taken to be the same as
those for similar products.
4.
Classification used
The United Nations Standard International Trade Classification (SITC), revised for the third time in 1988, was drawn up on the basis
of the Harmonized Commodity Description and Coding System (HS). Using tables of correspondence between the various
classifications (Nimexe, Combined Nomenclature and SITC), Eurostat has been able to publish an uninterrupted time series of
external trade indices from 1979 to the present.
From 1994 onwru-ds, external trade publications will give indices calculated from 1989 on the basis of the following SITC Rev. 3
aggregates:
TOTAL:
all commodities;
0+
1:
foods, beverages and tobacco;
2+4:
crude materials, except fuels;
3:
fuels
5+6+ 7+8: manufactured goods.
5.
Types of indices and rebasing
Eurostat calculates Fisher's "ideal" annual chain indices. Since the ''basket of goods" marketed at international level varies rapidly
over time, the annual chain permits the updating of the index weightings. Each month the changes in unit values in the product
groups at detailed level are weighted in order to obtain the changes in unit values in the various major product categories. Since these
changes are based on the previous year, a chain of unit values is obtained. The corresponding volume index chain is the ratio of the
unit value variation to the variation in value for the month in question compared with the monthly average for the previous year. The
indices published each month are calculated by multiplying the above-mentioned chains by the annual indices for the previous year,
a fixed reference period having been chosen (at present 1990). The annual unit value chains are obtained by weighting the monthly
chains by the volumes, while the annual volume chains are calculated by dividing the annual value variations by the unit value
chains.
6.
General comments
Only data on normal trade (statistical procedure 1) are used to calculate the unit value indices; however, data on total trade
(covering all the statistical procedures) are used to calculate the value indices from which the volume indices are obtained.
The unit value indices are calculated on the basis of values expressed in ecus.
EU:
UEBL:
DK:
D:
GR:
E:
F:
IRL:
1:
NL:
P:
UK:
USA:
0:
Symbols and abbreviations used
Total of the EU member States
Belgo-Luxembourg Economic Union (BLEU)
Denmark
Federal Republic of Germany
Greece
Spain
France
Ireland
Italy
Netherlands
Portugal
United Kingdom
United States of America
Data less than half the unit used
Mio:
Million
Mrd:
1000 millions
ECU:
European currency unit
Eurostat: Statistical Office of the European Communities
SITC:
Standard International Trade Classification
B:
DK:
D:
GR:
E:
F:
IRL:
1:
NL:
P:
UK:
Belgique I Luxembourg
Danmark
Deutschland
EA.A<ioa
Espaiia
France
Ireland
Italia
Nederland
Portugal
United Kingdom
Data sources
European Union
Institut national de statistiques, Bruxelles
Danmarks Statistik,
K~benhavnStatistisches Bundesamt, Wiesbaden
E8vut~ ~-ra-rtO'ttX~
YmJQEata
EA.A<ioa~, Ae~vaDirecci6n General de Aduanas e Impuestos Especiales, Madrid
Direction generale des douanes et droits indirects, Paris
Central Statistics Office, Dublin
lstituto centrale di statistica, Roma
Centraal Bureau voor de statistiek, Heerlen
Instituto Nacional de Estatistica, Lisboa
HM Customs and Excise, Statistical Office, Southend-on-Sea
Other countries
Commentary and graphs
The commentary refers to the state of the database on 03.10.95
Available data in this issue
EU UEBL OK D GR E F IRL I NL A p FIN
s
UKDecember 1994
X
X
X
X
X
X
X
X
X
X
X
X
January 1995
X
X
X
X
X
X
X
X
X
X
February 1995
X
X
X
X
X
X
X
X
X
March 1995
X
X
X
X
X
X
X
X
X
April1995
X
X
X
X
X
X
X
X
X
May 1995
X
X
X
X
X
X
X
X
X
June 1995
X
X
X
X
SEASONALADJUSTMENTS:RESULTS
Because of an absence of results for Greece,
Austria, Finland and Sweden, the results in
this month's bulletin are the same as the
ones dealt with in the previous issue.
The slowdown in the growth of the European
Union's exports to the rest of the world,
adjusted for seasonal factors, was more
pronounced in the second half of 1994.
Although growth for the year as a whole was
strong (+ 1 0.6%), it declined steadily as the
year progressed, from 17.1% in the first
quarter, to 13.SOio in the second,
SOlo
in the
third and 4.4% in the final quarter. Following
the decline recorded in September-October,
exports resumed their growth at the end of
the year, rising by + 1
.SOlo
between October
and
November and + 1. 7%
between
November and December.
50
48 46
44 42 40
38 36
Exports
Mrd. ECU· By contrast, the EU's imports from the rest of
the world, adjusted for seasonal factors,
grew at a fairly stable rate throughout 1994
(+ 1 0.5%). The increase observed in the
second half (+10.7%) was nearly four points
higher than that of exports (+6.8%). The
strong growth recorded in November
(+ 1.7%) and, more especially, in December
(+6.2%) accentuated the rebound in imports
observed since mid-1993.
The EU's trade balance, adjusted for
seasonal factors, was close to equilibrium
(ECU -0.1 billion) for 1994 as a whole. A
series of negative monthly results in the
second half of the year, culminating in a
deficit of ECU -2.4 billion in December,
meant that there was no surplus for the year
as a whole.
Imports
Mrd. ECU50.---~
48
46
44 42 40
:
; ;j{
J .
i
32
34
L, .
.
"
30J
A~~
28 ' \ II .• 26 • ' •
24
1
.
1986 1987 1988 1989 1990 1991 1992 1993 1994
Trade Balance
Mrd. ECU8,---~
7
-10
-11 L - - - - ' - - - - ' - - - L - - . . . L . . . . - - I _ _ _..._ _ _ L.____.____J 1986 1987 1988 1989 1990 1991 1992 1993 1994
TABLE OA - EXTERNAL TRADE OF THE EUROPEAN UNION
Seasonally AdJusted Series (1)- Bio. ECU
Period
Exports
Imports
Trade Balance
Not Adjusted
Seasonally
Not Adjusted
Seasonally
Not Adjusted
Seasonally
Adjusted
Adjusted
Adjusted
Jan-91
32,6
34,9
43,0
41,4
-10,4
-6,5
Feb-91
31,6
33,6
37,3
39,3
-5,7
-5,7
Mar-91
34,4
34,3
39,2
39,6
-4,9
-5,2
Apr-91
34,5
33,8
43,3
40,6
-8,8
-6,9
May-91
34,4
34,3
42,2
41,0
-7,9
-6,8
Jun-91
34,6
34,9
40,4
41,8
-5,7
-6,9
Jul-91
38,6
36,1
43,9
42,5
-5,3
-6,5
Aug-91
32,1
36,4
37,0
41,7
-4,9
-5,3
Sep-91
34,3
35,9
41,6
42,6
-7,3
-6,7
Oct-91
40,0
35,8
44,5
40,5
-4,4
-4,8
Nov-91
37,5
37,0
42,2
42,3
-4,7
-5,3
Dec-91
38,4
36,0
38,3
39,6
0,1
-3,5
Jan-92
32,7
35,7
41,4
40,6
. -'8,6
-4,9
Feb-92
34,2
36,1
39,8
41,4
-5,6
-5,2
Mar-92
38,3
36,5
44,0
41,3
-5,7
-4,8
Apr-92
37,0
37,1
42,5
41,6
-5,4
-4,5
May-92
34,0
35,9
40,0
41,7
-6,0
-5,8
Jun-92
35,9
34,8
40,6
39,1
-4,7
-4,3
Jul-92
39,5
36,9
42,3
41,4
-2,7
-4,5
Aug-92
30,3
35,8
33,6
39,5
-3,3
-'3,7
Sep-92
35,8
36,1
40,0
39,5
-4,3
-3,4
Oct-92
39,8
37,1
41,6
39,7
-1,8
-2,6
Nov-92
36,6
36,2
39,7
39,9
-3,1
-3,7
Dec-92
40,9
36,9
40,5
40,3
0,4
-'3,4
Jan-93
31,4
36,3
36,5
38,1
-5,1
-1,8
Feb-93
35,5
38,0
39,5
41,4
-4,0
-3,3
Mar-93
40,8
38,1
43,6
39,7
-2,8
-1,5
Apr-93
39,1
39,2
41,3
40,1
-2,2
-0,9
May-93
38,2
40,5
38,1
39,3
0,1
1,1
Jun-93
42,7
40,6
41,5
40,0
1,2
0,6
Jul-93
42,3
40,6
40,2
40,1
2,1
0,5
Aug-93
35,6
40,6
37,0
41,5
-1,4
-1,0
Sep-93
40,8
41,3
41,6
41,1
-0,9
0,2
Oct-93
45,4
43,2
42,0
41,7
3,5
1,5
Nov-93
45,3
43,4
43,5
41,5
1,9
2,0
Dec-93
49,8
45,1
42,7
43,0
7,1
2,1
Jan-94
37,8
44,0
42,6
44,0
-4,8
0,1
Feb-94
40,8
43,5
42,1
43,8
-1,2
-0,2
Mar-94
47,5
43,7
49,1
44,1
-1,6
~.4Apr-94
43,2
44,5
43,3
43,6
-0,1
0,8
May-94
45,6
46,1
44,7
44,2
0,8
1,9
Jun-94
48,0
45,5
45,3
43,8
2,7
1,7
Jul-94
43,5
42,5
42,9
44,5
0,5
-2,0
Aug-94
41,3
45,9
41,1
44,8
0,2
1,0
Sep-94
44,6
45,3
45,7
45,1
-1,2
0,1
Oct-94
47,2
45,1
46,0
45,5
1,3
-0,4
Nov-94
48,9
46,0
48,3
46,3
0,6
-0,4
Dec-94
50,5
46,7
47,8
49,2
2,7
-2,4
GLOBAL TRENDS IN EXTERNAL TRADE
EUROPEAN UNION EXTERNAL TRADE: Results for 1994.
The European Union's Imports Increased by slightly more than exports during 1994 (+0.2 percentage points). In
the same period, Imports of United States and Japan showed a higher rate of change than exports by 3.7 and 3.9
points respectively.
In 1994, the
European
Union's(~)trade balance went
down to a deficit of ECU 1 billion compared to 1993 when
the Imports and the exports flows were almost in
equilibrium (only a small ECU 0.1 billion deficit).
This performance is the result of a clear upturn in
extra-EU imports (10.8% growth rate agamst the
stagnation registered in 1993), together with the one
percentage point reduction in the exports annual growth
rate (10.6% compared to 11.7% in 1993).
From January to December 1994, the
United States'
trade deficit recorded an ECU 29.2 billion increase
compared to the corresponding period a year earlier,
and it reached ECU 148.1 billion (US dollars 177.2
billion).
In ECU terms, the 1994 imports' rate of change over
1993 was larger than the exports' one (12.3% against
8.6%);
if measured in US dollars, these figures were
14.2% and 10.2% respectively.
In 1994, the
Japanese
trade surplus remained fairly
stable compared to a year earlier, totalling ECU 102.1
billion (ECU 0.3 billion increase over 1993).
In ECU terms the exports' and imports' rates of change
were both largely P.Ositive:
8.3%
and 12.2%
respectively; while, 1f measured in the Japanese
currency -due to the YEN 7.3% appreciation against
the ECU in 1994 - the value of Jafanese exports and
imports stabilised at the same leva of 1993.
(*)
Due to frequent revisions of the monthly figures sent by the member states, the data shown Is not necessan1y Identical to that presented
In the previous publications.
1 billion= 10
930
20
10
;
b_n
I
l
1!!:1
0
·10
91
92
93
94
93
94
12
GR.OB I· IMPORTS AND EXPORTS (CIF, FOB)
(Annual% change)
30
30
20
~
20
~
I
10
10
:~ w ~:
0
rn
fjJ-,
n
0
i
·10
·10
..
i! !
> '• 1"~
'·
1
"..
~
91
92
93
94
93
94
91
92
93
94
93
94
12
12
USA
TABLE OB I - TRADE BALANCE, IMPORTS AND EXPORTS (1)
COUNTRIES
1991
1994
12
European Union
-70,5
-61,0
-o,1
-1,0
-o,7
4,4
7,0
2,7
United States • (3)
-68,9
-80,9
-118,9
-148,1
-43,5
-40,3
-8,2
-10,5
Japan(4)
62,9
82,2
101,8
102,1
23,5
24,0
9,6
8,6
BLEU
-7,2
-5,3
-2,7
-1,0
-o,4
-o,2
-o,2
-o,1
Denmark
1,2
2,2
2,6
2,5
0,7
0,8
0,3
0,3
Germany
6,2
8,8
20,0
25,6
5,6
7,9
4,2
2,4
Greece
-4,4
-4,1
-4,3
-2,8
-o,6
-o,7
-o,s
-o,1
Spain
-12,5
-11,8
-4,3
-4,3
-1,3
-o,9
-o,s
-o,4
France
-3,9
3,2
9,4
10,8
2,7
4,2
2,1
2,0
Ireland
-o,2
0,9
1,2
0,8
0,3
0,2
0,2
0,1
Haly
-6,2
-1,4
11,0
12,7
3,4
3,6
2,3
1,8
Netherlands
-20,5
-20,4
-12,1
-22,0
-6,7
-4,9
-o,6
-1,5
Portugal
-2,8
-2,7
-2,6
-2,7
-o,5
-o,6
-o,2
-o,2
Urited Kingdom
-20,2
-20,3
-18,4
-20,5
-4,9
-4,9
-o,1
-1,6
IMPORTS
% change on the con-espondlng period
of
the previous year
European Union
6,8
-1,4
0,0
10,8
9,3
10,7
3,3
14,4
United States •
(3)1,3
4,2
20,7
12,3
10,0
8,0
16,5
9,6
Japan(4)
4,0
-6,8
14,0
12,2
6,9
16,8
13,3
19,7
BLEU
4,7
-4,6
7,6
10,8
23,6
-14,5
32,6
-1,9
Denmark
3,7
-1,9
-o,7
16,6
17,2
20,6
9,3
19,5
Germany
15,6
-o,1
0,0
9,7
8,4
11,4
-o,2
20,8
Greece
24,1
-2,9
11,8
-14,0
-28,3
-9,8
-7,6
-21,6
Spain
7,8
1,2
-14,9
8,9
13,7
10,6
-6,6
-4,8
France
6,2
-4,5
-1,8
7,4
6,7
10,2
-2,4
14,2
Ireland
9,9
-9,2
37,0
23,0
17,1
23,3
80,4
31,1
Haly
2,2
-4,1
-4,9
9,7
11,7
17,7
4,6
18,4
Netherlands
6,1
2,0
-8,3
80,3
28,5
28,1
-4,7
20,7
Portugal
-2,2
3,6
-4,8
6,7
0,5
10,0
0,5
5,2
Urited Kingdom
-1,9
-o,1
9,7
7,8
-o,4
8,8
11,4
18,5
EXPORTS
%change on the corTeSpondlng period
of
the previous year
European Union
0,9
3,0
11,7
10,6
8,9
6,4
19,5
8,5
United States •
(3)10,1
1,5
14,6
8,6
7,6
8,3
17,9
5,4
Japan(4)
12,9
3,2
17,1
8,3
1,4
7,5
17,8
8,8
BLEU
2,2
2,2
20,6
17,8
14,4
5,4
28,5
0,8
Denmark
0,6
5,7
2,1
18,3
15,7
12,5
14,6
15,1
Germany
1,7
1,6
7,4
11,9
12,7
9,1
19,1
5,1
Greece
12,2
2,5
23,6
14,3
-1,9
89,2
44,9
44,6
Spain
6,9
6,5
17,6
10,4
11,8
6,1
8,4
-o,1
France
8,4
5,7
7,0
8,3
6,8
10,4
9,9
9,6
Ireland
6,8
15,1
57,0
14,4
12,4
8,7
47,2
4,2
Haly
O,S4,0
16,5
10,6
8,2
4,9
22,5
4,7
Netherlands
2,5
4,1
17,2
9,6
7,4
0,9
27,8
-2,9
Portugal
-4,2
9,8
-4,8
8,1
15,1
5,7
24,8
-11,8
Urited Kingdom
-6,7
-o,8
15,9
6,9
0,0
-1,7
25,2
-6,9
Memorandum Item
% change on the corTeSpondlng period
of
the previous year
1USD: ... ECU
2,8
-4,5
10,9
-1,8
-6,8
-8,0
9,8
-7,2
1YEN=-ECU
10,4
1,4
26,2
7,8
-o,1
0,7
28,8
1,9
(1) External Trade Sta!ia&ca exclucing Intra
flows 0~0118CIF, Exports FOB).
(2)Bn .. 1000.000.000
L---G-Lo_a_A_L_T_R_E_N_o_s_I_N_E_XT_E_R_N_A_L_T_R_A_o_e _ _ _ _ _ _ _
...~l
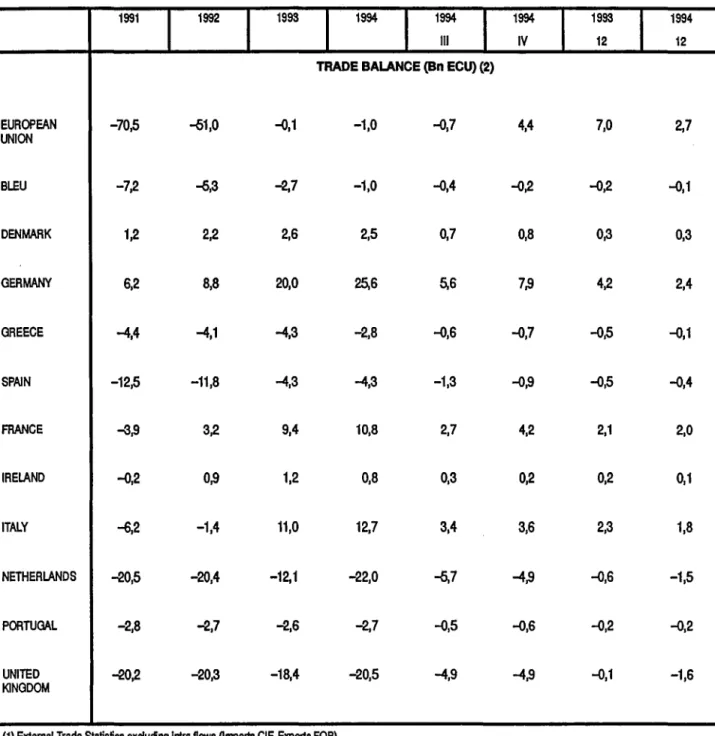
EXTERNAL TRADE BY MEMBER STATES: Results for 1994.
Germany and Italy showed the two largest extra·EU surpluses among the EU countries, while the Netherlands
and the United Kingdom registered the highest external deficits.
In 1994,
Germany registered both the largest extra-EU
surplus among the EU member states (ECU 25.6 billion)
and the most important improvement compared to the
previous year (ECU 5.6 billion). German exports showed
a 11.9% increase over 1993, while imports grew by
9.7%.
During 1994 the
Italian exports increased faster than
imports compared to the same period a year earlier, the
growth rates being 10.6% and 9.7% respectively.
The Italian trade balance improved its surplus by ECU
1. 7 billion, reaching ECU 12.7 billion, from ECU 11 billion
recorded in 1993.
The Dutch extra-EU deficit recorded the most important
deterioration between 1993 and 1994 (ECU 9.9 billion)
and became the largest among the EU countries (ECU
22 billion).
As a matter of fact, the
Netherlands' extra-EU imports
- which include goods entering the Union via Dutch
harbours and than delivered to other member states
-grew very fast in 1994 (30.3%), while the exports' rate
of change was slightly under the EU average (9.6%).
In 1994, the
United Kingdom was the EU country that
experienced the second largest trade deficit, totalling
ECU 20.5 billion.
The UK's trade position showed an ECU 2.1 billion
deterioration with reference to the previous year as a
result of the gap between the imports' and exports'
growth rates (0.9 percentage points).
France's extra-EU trade surplus improved by ECU 1.4
billion in 1994 compared to a year earlier (from ECU 9.4
billion to ECU 10.8 billion).
The rates of change of both imports and exports were
well under the EU average:
7.4% and 8.3%
respectively.
During 1994, the extra-EU exports of the
BLEU and
Greece recorded two of the largest percentage changes
among the EU member states compared to the previous
year (17.8% and 14.3% respectively). On the imports
side, while the BLEU registered a rate of growth close
to the EU average (10.8%), Greece was the only
member state which experienced a reduction in the
extra-EU purchases (-14%).
In consequence, both countries improved their external
trade accounts: the Greek trade deficit went down to
ECU 2.8 billion from the ECU 4.3 billion registered in
1993, and the BLEU's trade balance reduced its deficit
by ECU 1.7 billion.
The external trade surpluses of
Denmark and Ireland
reduced slightly compared to 1993: to ECU 2.5 billion
and ECU 0.8 billion respectively in 1994.
The trade flows of both countries registered dynamic
performances: Danish imports and exports grew
respectively by 16.6% and 13.3% over 1993, while the
corresponding rates for Ireland were 23% and 14.4%.
The external positions of
Spain and Portugal were
almost stable between 1993 and 1994: their extra-EU
deficits registered in 1994 ECU 4.3 billion and ECU 2.7
billion respectively.
The exports' and 1m ports' rates of growth showed a gap
of about 1.5 percent points for both countries.
GR.OB II· MEMBER STATE'S EXTRA-TRADE BALANCE
(BN ECU)
-30~---EU
B·L
DK
D
GR
E
F
IRL
NL
p
UK
TABLE OB 0 - EXTRA- EU TRADE BALANCE (1)
1991
1992
1993
1994
1994
Ill
TRADE BALANCE
(BnECU) (2)
EUROPEAN
-70,5
-Q1,0
-o,1
-1,0
-o,7
UNION
BLEU
-7,2
-Q,3
-2,7
-1,0
-o,4
DENMARK
1,2
2,2
2,6
2,5
0,7
GERMANY
6,2
8,8
20,0
25,6
5,6
GREECE
-4,4
-4,1
-4,3
-2,8
-o,6
SPAIN
-12,5
-11,8
-4,3
-4,3
-1,3
FRANCE
-3~3,2
9,4
10,8
2,7
IRELAND
-o,2
0~1,2
0,8
0,3
ITALY
-6,2
-1,4
11,0
12,7
3,4
NETHERLANDS
-20,5
-20,4
-12,1
-22,0
..IJ,7
PORTUGAL
-2,8
-2,7
-2,6
-2,7
-o,5
UNITED
-20,2
-20,3
-18,4
-20,5
-4,9
KINGDOM
(1) External Trade Statistics exclucing Intra flows
Qmporta
CIF, Exports FOB).
(2)Bn=1000.000.000
1994
1993
1994
IV
12
12
4,4
7,0
2,7
-o,2
-o,2
-o,1
0,8
0,3
0,3
7~
4,2
2,4
-o,7
-o,s
-o,1
-o~
-o,5
-o,4
4,2
2,1
2,0
0,2
0,2
0,1
3,6
2,3
1,8
-4~
-o,6
-1,5
-o,6
-o,2
-o,2
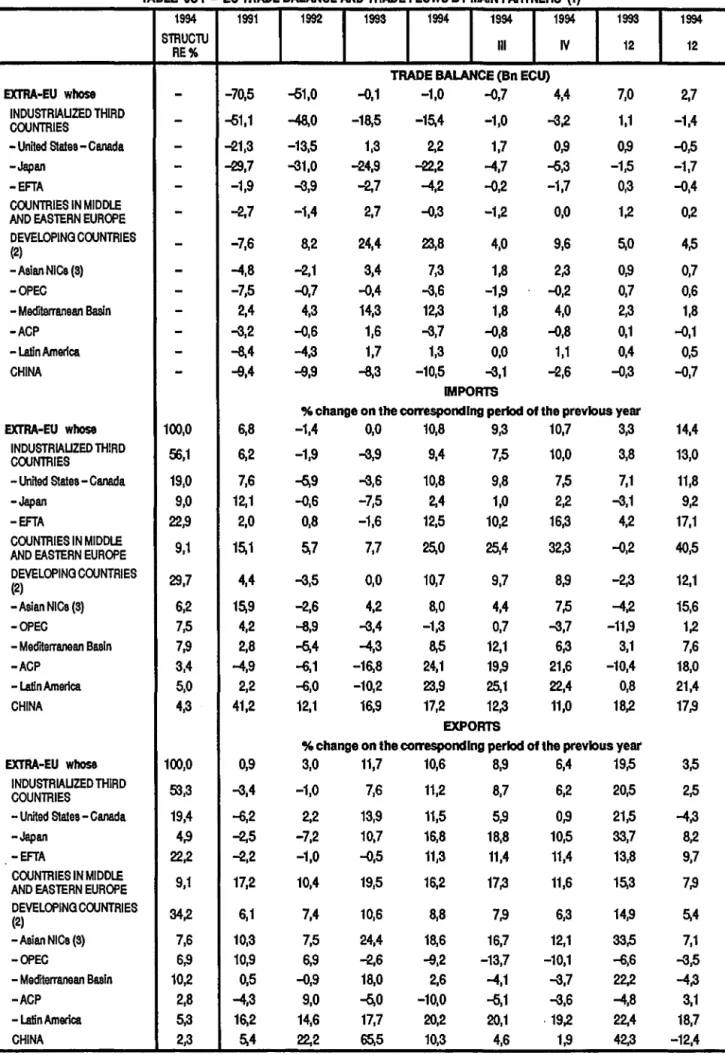
EUROPEAN UNION EXTERNAL TRADE BY PARTNER COUNTRY
TRADE IN TERMS OF VALUE: Results for 1994.
In 1994, the EU trade deficit with Industrialised countries showed an Improvement compared to the previous
year of ECU 3.1 billion. At the same time, the EU trade positions with developing countries,
CEEC's and China worsened by ECU 0.6 billion, ECU 3 billion and ECU 2.2 billion respectively.
The EU trade flows with
industrialised countries,
which accounted for more than a half of the total
extra-EU trade in 1994, recorded an ECU 15.4 billion
deficit compared to ECU 18.5 billion shown in 1993.
While the deficit with Japan dropped by ECU 2.7 billion,
the trade balance with the EFT A countries went down
from ECU 2. 7 billion to ECU 4.2 billion deficit.
The trade balance with the United States and Canada,
countries that in 1994 represented almost 20% of the
total EU external flows, stabilised at ECU 2.2 billion
surplus.
The trade surplus with
developing countries
reduced
slightly to ECU 23.8 billion from ECU 24.4 billion
registered in 1993.
The big increase of the surplus with the Asian NIC's
(ECU 3.9 billion) wasn't sufficient to compensate for the
deterioration of the trade positions with the other areas:
the surpluses with the Mediterranean Countries and with
Latin America reduced by ECU 2 billion and ECU 0.4
billion respectively, and the trade balances with the
OPEC and the ACP countries, went down to almost the
same deficit (ECU 3.6 billion and ECU 3.7 billion
respectively).
In 1994, the EU's trade with the
Central and Eastern
European countries
was almost in balance (showing
a small ECU 0.3 billion deficit). This result represented
a deterioration compared to 1993, when the balance
recorded an ECU 2. 7 billion surplus.
In the year 1994, the deficit with
China
as well went up
to ECU 10.5 billion from ECU 8.3 billion registered in
1993.
During 1994 EU
imports
from the industrialised
countries increased by 9.4% over the previous year.
While imports from the United States-Canada and from
EFT A recorded an increase above the EU average
(1 0.8% and 12.5% respectively) the EU imports from
Japan {9% of the total extra-EU imports) rose by only
2.4%.
.
The value of EU imports from developing countries (30%
of the total 1994 extra-Union purchases) increased by
10.7% between 1993 and 1994.1mports from ACP and
Latin America countries recorded the most dynamic
rates of change (both around 24%), while the flows from
Asian Newly Industrialised and Mediterranean countries
showed lower performances (8% and 8.5%
respectively). EU imports from OPEC countries were
almost stable at the same level registered in 1993 ( ·1.3%
percent change).
The EU imports from Central and Eastern European
countries as well as from China continued the
fast-growing trend shown in the previous two years: the
growth rates in 1994 over a year earlier were 25% and
17.2% respectively.
In the year 1994,
exports
from the EU to the
industrialised countries went up by 11.2% compared to
1993. This result is mainly due to the good performance
of EU exports to Japan (16.8% annual growth), while
sales in the EFT A and US-Canadian markets registered
a rate of growth closer to the average (11.3% and 11.5%
respectively).
The global value of the exports to the developing
countries, which represented in 1994 the 34.2% of the
total extra-EU exports, showed an increase below the
average (8.8%}: while exports to the Asian NICs and to
the Latin American countries showed dramatic rates of
growth (18.6% and 20.2% respectively), the EU exports
to the Mediterranean countries grew only by 2.6% and
the sales to OPEC and ACP countries went down by
9.2% and 10% respectively.
The EU export flows to Central and Eastern European
countries recorded a percentage change in 1994 well
above the EU average (16.2%}, while the exports to
China, after the boom experienced in 1993, were still
growing but at a more moderate rate (10.3%).
GR.OC I· EXTRA· TRADE BALANCE BY MAIN PARTNER COUNTRIES
30
DC
6DC
5
..
20 ~
4
101- 3
USA-CANADA
21-0 ..._ USA-CANADA
--.. EFTA
11-EFTA~
·10 0
---
-H--20 JAPAN JAPAN
-2
-30 -3
93 94 93
TABLE OC I - EU TRADE BALANCE AND TRADE FLOWS BY MAIN PARTNERS (1)
1994 1991 1992 1993 1994 1994 1994 1993
STRUCTU
Ill
IV
12 RE%
TRADE BALANCE (Bn ECU)
EXTRA·EU
whose
-
-70,5
-51,0
-(),1
-1,0
-(),7
4,4
7,0
INDUSTRIAUZED THIRD
--51,1
-48,0
-18,5
-15,4
-1,0
-3,2
1,1
COUNTRIES
- UnHed States- Canada
-
-21,3
-13,5
1,3
2,2
1,7
0,9
0,9
-Japan-
...t;!j,7
-31,0
-24,9
-22,2
-4,7
-5,3
-1,5
-EFTA-
-1,9
-3,9
-2,7
-4,2
-(),2
-1,7
0,3
COUNTRIES IN MIDDLE--2,7
-1,4
2,7
-(),3
-1,2
0,0
1,2
AND EASTERN EUROPE
DEVELOPING COUNTRIES
-
-7,6
8,2
24,4
23,8
4,0
9,6
5,0
(2)
-Asian NICs (3}
-
-4,8
-2,1
3,4
7,3
1,8
2,3
0,9
-OPEC-
-7,5
-(),7
-(),4
-3,6
-1,9
-(),2
0,7
- Mediterranean Basin-
2,4
4,3
14,3
12,3
1,8
4,0
2,3
-ACP-
-3,2
-(),6
1,6
-3,7
-(),8
-(),8
0,1
-Latin Amarica-
-8,4
-4,3
1,7
1,3
0,0
1,1
0,4
CHINA-
-9,4
-9,9
-8,3
-10,5
-3,1
-2,6
-(),3
IMPORTS
%change on the corTespondlng period of the previous year
EXTRA·EU
whose
100,0
6,8
-1,4
0,0
10,8
9,3
10,7
3,3
INDUSTRIAUZED THIRD
56,1
6,2
-1,9
-3,9
9,4
7,5
10,0
3,8
COUNTRIES- UnHed States- Canada
19,0
7,6
-5,9
-3,6
10,8
9,8
7,5
7,1
-Japan9,0
12,1
-(),6
-7,5
2,4
1,0
2,2
-3,1
-EFTA22,9
2,0
0,8
-1,6
12,5
10,2
16,3
4,2
COUNTRIES IN MIDDLE9,1
15,1
5,7
7,7
25,0
25,4
32,3
-(),2
AND EASTERN EUROPE
DEVELOPING COUNTRIES
29,7
4,4
-3,5
0,0
10,7
9,7
8,9
-2,3
(2)-Asian NICs (3)
6,2
15,9
-2,6
4,2
8,0
4,4
7,5
-4,2
-OPEC7,5
4,2
-8,9
-3,4
-1,3
0,7
-3,7
-11,9
- Mad"rterranaan Basin7,9
2,8
-5,4
-4,3
8,5
12,1
6,3
3,1
-ACP3,4
-4,9
-6,1
-16,8
24,1
19,9
21,6
-10,4
- Latin Amarica5,0
2,2
-6,0
-10,2
23,9
25,1
22,4
0,8
CHINA4,3
41,2
12,1
16,9
17,2
12,3
11,0
18,2
EXPORTS
%change on the corTespOndlng period of the previous year
EXTRA·EU
whose
100,0
0,9
3,0
INDUSTRIAUZED THIRD
53,3
-3,4
-1,0
COUNTRIES
- UnHed States- Canada
19,4
-6,2
2,2
-Japan4,9
-2,5
-7,2
-EFTA22,2
-2,2
-1,0
COUNTRIES IN MIDDLE9,1
17,2
10,4
AND EASTERN EUROPE
DEVELOPING COUNTRIES
34,2
6,1
7,4
(2)
-Asian NICs (3}
7,6
10,3
7,5
-OPEC6,9
10,9
6,9
- Maditarranaan Basin10,2
0,5
-(),9
-ACP2,8
-4,3
9,0
- Latin Amarica5,3
16,2
14,6
CHINA2,3
5,4
22,2
(1)
External TradeStatistics Ql!1)orts
CIF,Exports FOB).
Bn•1000.000.000.
(2) Soma counbias belong to several zonae.
11,7
10,6
7,6
11,2
13,9
11,5
10,7
16,8
-(),5
11,3
19,5
16,2
10,6
8,8
24,4
18,6
-2,6
-9,2
18,0
2,6
-5,0
-10,0
17,7
20,2
65,5
10,3
(3) Asian NICalneluda the foDowlng counbias: Singapore,
South
Korea, Taiwanand
Hong Kong.8,9
6,4
19,5
8,7
6,2
20,5
5,9
0,9
21,5
18,8
10,5
33,7
11,4
11,4
13,8
17,3
11,6
15,3
7,9
6,3
14,9
16,7
12,1
33,5
-13,7
-10,1
-6,6
-4,1
-3,7
22,2
-5,1
-3,6
-4,8
20,1
. 19,2
22,4
4,6
1,9
42,3
1994 12
2,7
-1,4
-(),5
-1,7
-(),4
0,2
4,5
0,7
0,6
1,8
-(),1
0,5
-(),7
14,4
13,0
11,8
9,2
17,1
40,5
12,1
15,6
1,2
7,6
18,0
21,4
17,9
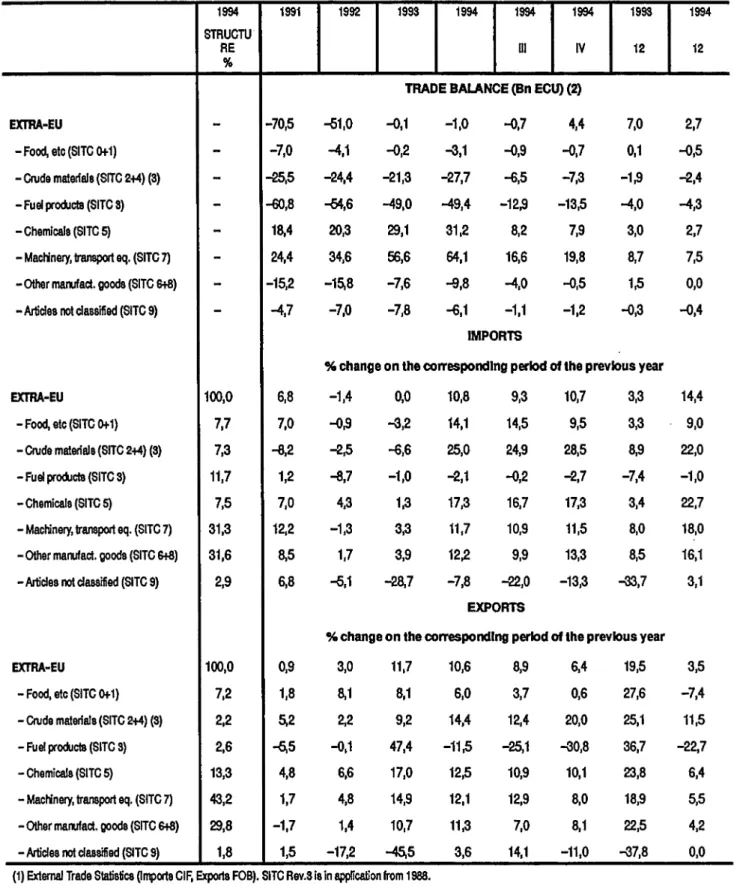
EUROPEAN UNION EXTERNAL TRADE BY PRODUCT
TRADE IN TERMS OF VALUE: Results for 1994.
During 1994, EU trade balance in machinery and transport equipment recorded the most important surplus
(ECU 64.1 billion), while the fuel products showed the largest deficit totalling ECU 49.4 billion.
In 1994, the
primary products' {SITC D-4)
deficit went
up to ECU 80.2 billion compared to the ECU 70.5
registered in 1993.
The EU trade deficit in fuel products (SITC
3)
grew
slightly by ECU 0.4 billion, while the balances for food,
beverages and tobacco (SITC 0+
1)
and raw materials
except fuel (SITC 2+4) showed a more evident
deterioration during 1994 compared to the a year earlier,
of ECU 2.9 billion and ECU 6.4 billion respectively.
As far as the
manufactured products (SITC 5-B)
are
concerned, EU external trade showed a surplus of ECU
85.5 billion compared to the ECU 78.1 billion registered
in 1993.
The EU surplus in
machinery and transport
equipment (SITC 7)
increased by ECU 7.5 billion,
reaching ECU 64.1 billion. The
chemical products
{SITC 5)
also saw their surplus enhanced to ECU 31.2
billion (compared to ECU 29.1 billion registered one year
earlier), while the deficit for
other manufactured goods
(S/TC 6+8}
went up to ECU 9.8 billion from ECU 7.6
billion registered in 1993.
As for the
Import
flows, the primary products covered in
1994 almost 27% of the total extra-EU purchases.
Among them, the raw materials except fuel (SITC 2+4)
were the sections that recorded the most dynamic
performance between the periods January-December
1993 and 1994 (+25%). Food, beverages and tobacco
(SITC 0+ 1) registered a rate of growth of 14.1 %; while,
following the general reduction in international oil prices,
the EU imports of fuel products' (SITC 3) dropped by
2.1 %. As a matter of fact, in 1994, the ECU cost of the
EU's crude oil supplies went down by 4.9% (3.5% if
measured in US dollar) compared to the previous year.
In 1994, chemical products (SITC 5) recorded a dynamic
17.3% growth rate; while imports of machinery and
transport equipment (SITC
7),
and of other
manufactured goods (SITC 6+8) showed 11.7 and 12.2
percent change respectively compared to the previous
year.
· In 1994, the manufactured products represented 86.3%
of the total extra-EU
exports.
Between January-December 1993 and 1994, all the
SITC section grouping processed products showed
rates of change above the average.
These rates were
+
12.5% for the chemical products
(SITC 5), + 12.1% for the machinery and transport
equipment (SITC 7), while the other manufactured
goods (SITC 6+8) recorded a 11.3% increase over the
previous year.
As far as the primary products are concerned, in the
same period, the exports of raw materials other than fuel
(SITC 2+4) went up of 14.4%, while food, beverages and
tobacco (SITC 0+1) and fuel products {SITC 3)
registered relatively weak performances: respectively
+6% and -11.5% growth rate.
GR.OD I· EXTRA-TRADE BALANCE (PRODUCTS GROUPS)
(BN ECU)
15·~