This content has been downloaded from IOPscience. Please scroll down to see the full text.
Download details:
IP Address: 129.11.132.214
This content was downloaded on 18/06/2014 at 11:09
Please note that terms and conditions apply.
The use of transmission electron microscopy in the quantification of nanoparticle dose
View the table of contents for this issue, or go to the journal homepage for more 2014 J. Phys.: Conf. Ser. 522 012055
(http://iopscience.iop.org/1742-6596/522/1/012055)
The use of transmission electron microscopy in the
quantification of nanoparticle dose
N Hondow, R Brydson and A Brown
Institute for Materials Research, School of Process, Environmental and Materials Engineering, University of Leeds, Leeds LS2 9JT, UK
Abstract. There are an increasing number of potential applications for nanoparticles in clinical medicine, including targeted drug delivery and contrast agents for biomedical imaging. Current
in vitro studies are concerned with the biological impact of nanoparticles, with electron microscopy commonly employed to image their intracellular location. It is critical to quantify the absolute nanoparticle dose internalized by cells in a given exposure, and to understand the factors which affect this. In this work we are aiming to develop a full quantitative description of quantum dot uptake by an in vitro cell line. Transmission electron microscopy of thin cell sections provides the location and number of cellular vesicles per 2-D cell slice plus the number of quantum dots per vesicle. These results can then be correlated to other techniques to quantify the internalized nanoparticle dose distribution for whole cells.
1. Introduction
Quantum dot nanoparticles are fluorescent semiconductor nanocrystals commonly 2 to 15 nm in length that are finding numerous biological applications [1]. In particular they are being used in the development of nanomedicines as diagnostic nanoprobes or to label drug molecules or nanocarriers [2]. One of the challenges of nanomedicine is to understand how nanoparticles will be distributed in the body, making it critical to measure the absolute nanoparticle dose internalized by cells and tissues for a given exposure [3].
Predicting internalized dose of nanoparticles is complicated because the dispersion and surface activity can alter in different liquid environments (e.g. water, ionic or physiological media). We have already addressed the representative analysis of dispersions of nanoparticles by TEM following sample preparation by plunge freezing and have specifically quantified the dispersion of quantum dots [4] and other nanoparticles such as silica and zinc oxide [5] in cell culture media. The advantage of TEM analysis is that we can measure and quantify the dispersion and the condition of the primary nanoparticles, identifying the number, size and even the compositional distribution of primary and agglomerated particles.
TEM is commonly employed to image the internal location of nanoparticles taken up by cells and tissues. In vitro, these results are often qualitatively compared to cell line responses measured by standard viability and genotoxicity assays, and are essential to confirm uptake. Optical techniques can be used to track nanoparticles inside live cells, if for example the particles fluoresce such as quantum dots, however resolution is limited to identifying intracellular features such as membrane-bound vesicles loaded with nanoparticles and not individual particles [6]. Only with the improved resolution
Electron Microscopy and Analysis Group Conference 2013 (EMAG2013) IOP Publishing
afforded by TEM can the fundamental unit of dose, individual nanoparticles, be monitored and measured. In this work we present TEM results of human osteosarcoma (U2-OS) cells loaded with quantum dots, in which analytical techniques (energy dispersive X-ray (EDX) spectroscopy and energy filtered TEM (EFTEM)) have been used to confirm the identity of the quantum dots. We have also performed extensive TEM imaging to allow for quantification of nanoparticle uptake [7].
2. Experimental
U2-OS cells were loaded with quantum dots (Qtracker 705, ~10 nm in length, Invitrogen Ltd) as described previously [7]. After 1 hour exposure, the cells were harvested and processed for electron microscopy by fixation, dehydration, resin embedding and thin sectioning [7]; however no conventional heavy metal stains (uranyl acetate or lead citrate) were used. TEM was conducted on two electron microscopes; an FEI Tecani F20 FEG-TEM operating at 200 kV and fitted with a Gatan Orius SC600A CCD camera and an Oxford Instruments X-Max SDD EDX detector, and a JEOL 2100 TEM operated at 120 kV and fitted with a Gatan Tridium energy filter.
3. Results and Discussion
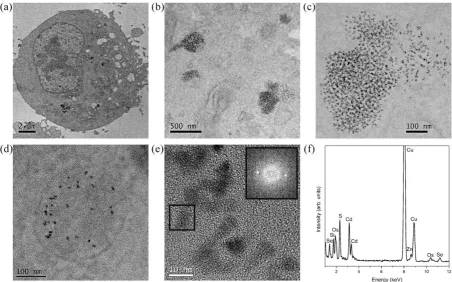
[image:3.595.71.524.381.663.2]TEM imaging of thin sections of human osteosarcoma cells exposed to Qtracker 705 quantum dots (figure 1a) indicates nanoparticles enclosed in membrane bound vesicles (membranes are lightly stained by the osmium tetroxide fixative), confirming uptake by endocytosis. In some instances, nanoparticles can even be imaged entering a cell by endocytosis [4]. The crystalline nature of the quantum dots is confirmed with lattice imaging (figure 1e).
Figure 1. Electron microscopy of thin sections of U2-OS cells exposed to quantum dots. a) Low magnification image of a cell; b) higher magnification image from the centre of the cell; c) and d) higher magnification images of vesicles in (b) containing quantum dots; e) lattice image of quantum dots inside a vesicle with FFT inset; f) EDX spectrum from a group of quantum dots inside a vesicle.
Previous studies have highlighted the importance of distinguishing the identity of nanoparticles internalized by cells in vitro from the stains decorating cellular nano-structures [8]; contrast enhancing heavy metal stains (uranyl acetate or lead citrate are not in this study) and even the osmium tetroxide
Electron Microscopy and Analysis Group Conference 2013 (EMAG2013) IOP Publishing
Journal of Physics: Conference Series522(2014) 012055 doi:10.1088/1742-6596/522/1/012055
fixative (used here), are nanoparticulate themselves. In the first instance, we have used energy dispersive X-ray (EDX) spectroscopy from a collection of quantum dots inside a vesicle (figure 1f) to measure composition; selenium, sulfur, cadmium and zinc are all detected (with silicon, copper and osmium resulting from the TEM grid and the sample preparation). In addition, high magnification imaging (figure 1e) reveals the (100) atomic planes of hexagonal CdSe, absolutely confirming the identification of CdSe-ZnS dots.
[image:4.595.74.524.256.395.2]The elemental distribution over a larger area has been mapped using EFTEM, mapping for cadmium and sulfur (figure 2). This technique also confirms that the particles identified are quantum dots and we have shown it is possible to identify individual dots within the cytoplasm using a combination of HAADF-STEM and elemental analysis [9]. An advantage of not using any post-embedding stain to highlight cellular features is more straightforward nanoparticle identification.
Figure 2. EFTEM analysis of U2-OS cells exposed to quantum dots. a) zero-loss energy filtered TEM image of an area within a cell containing several quantum dot filled vesicles; b) red false-coloured Cd
M4,5 map of (a); c) green false-coloured S L2,3 map of (a).
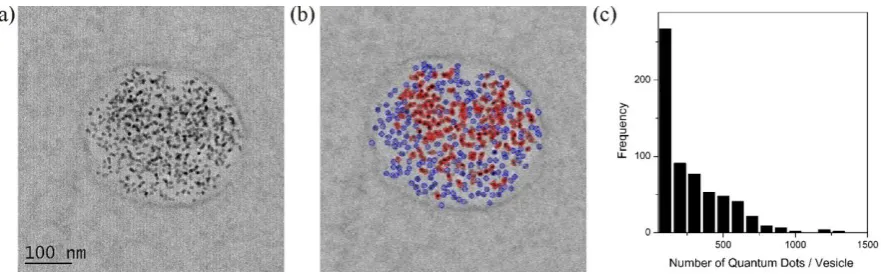
Having established confidence in the accurate identification of quantum dots, counting of dots in vesicles has been undertaken. Images have been taken at a magnification appropriate for individual dots to be identified within in a vesicle (figure 3a). Numerous images have been subjected to analysis (figure 3b) to quantify the number of quantum dots per vesicle [7]. Performing this analysis on a thin section of many different cells (~100), with all quantum dot loaded vesicles quantified, reveals the distribution of quantum dot uptake by endocytic vesicles (figure 3c).
Figure 3. Quantitative TEM imaging to measure the distribution of nanoparticle uptake. a) A membrane bound vesicle containing numerous quantum dots; b) automated counting of quantum
dots; c) frequency plot of number of quantum dots per vesicle.
To obtain the internalized quantum dot dose distribution for a cell population, we have correlated this low-throughput, high-resolution TEM analysis to high throughput, low resolution optical imaging by flow cell cytometry with an imagestream [7]. It is however also possible to use this quantitative TEM imaging method to monitor the quantum dot dose distribution per endocytic
Electron Microscopy and Analysis Group Conference 2013 (EMAG2013) IOP Publishing
[image:4.595.80.521.524.661.2]vesicle over the cell cycle; this sample is fixed immediately after a 1 hour exposure of the quantum dots to U2-OS cells but the distribution (figure 3c) will be compared to another time point in the cell cycle (for example, fixing 24 hours after exposure), potentially examining endosome maturation or merging and even inheritance of quantum dots after cell division. These distributions (figure 3c) and the correlation to whole cell populations [7] suggest that cells exposed to nanoparticles targeted for endocytosis receive a considerably variable dose of nanoparticles by number. This has major implications for the use of nanoparticles as drug delivery vehicles.
4. Conclusions
The use of transmission electron microscopy is essential in the measurement of nanoparticle number or dose internalized by cells and tissues as it can resolve the fundamental unit of dose, the nanoparticle. Analytical TEM techniques, such as EDX spectroscopy and EFTEM, can provide unequivocal evidence that particles imaged are indeed the target particles, and with extensive imaging and image analysis numbers of nanoparticles per membrane bound vesicle or per cell section can be determined. This can then be extrapolated to three dimensions and correlated to other techniques to develop full dose models, or could be repeated at different time points in the cell cycle to examine nanoparticle inheritance.
Acknowledgments
This work has been supported by the EPSRC (EP/H008578/1) and the AXA Research Fund (AXA fellowship to NH). We would like to thank: Prof. Huw Summers, Prof. Paul Rees and Dr M. Rowan Brown (Swansea University) for samples and image analysis; Prof. Martin Saunders (University of Western Australia) for help with EFTEM studies; and K. Brady (Kings College London) for sample preparation.
References
[1] Jamieson T, Bakhshi R, Petrova D, Pocock R, Imani M and Seifalian A M 2007 Biomaterials
28 4717
[2] Wang Y and Chen L 2011 Nanomed.-Nanotechnol. 7 385
[3] Sanhai W R, Sakamoto J H, Canady R and Ferrari M 2008 Nat. Nanotechnol. 3 242
[4] Hondow N S, Brydson R, Wang P, Holton, M R, Rees P, Summers H D and Brown A 2012 J. Nanopart. Res. 14 977
[5] Hondow N S, Wang P, Brydson R, Holton M D, Rees P, Summers H D and Brown A 2012 J. Phys. Conf. Proc. 371 012020
Wallace R, Brown A P B, Brydson R, Milne S J, Hondow N and Wang P 2012 J. Phys. Conf. Proc. 371 012080
[6] Summers H D, Rees P, Holton M D, Brown M R, Chappell S C, Smith P J and Errington R J 2011 Nat. Nanotechnol. 6 170
[7] Summers H D, Brown M R, Holton M D, Tonkin J A, Hondow N, Brown A P, Brydson R and Rees P 2013 ACS Nano 7 6129
[8] Bradenburger C, Clift M J D, Vanhecke D, Mülfeld C, Stone V, Gehr P and Rothen-Rutihauser B 2010 Particle Fibre Toxicol. 7 15
[9] Brown A and Hondow N 2013 ElectronMicroscopy of Nanoparticles in Cells in Summers H D (Ed.) Frontiers of Nanoscience: Nanomedicine (Elsevier)
Electron Microscopy and Analysis Group Conference 2013 (EMAG2013) IOP Publishing
Journal of Physics: Conference Series522(2014) 012055 doi:10.1088/1742-6596/522/1/012055