SDR 121/2013 6 August 2013
Pupils Educated Other than at School, 2012/13 (Experimental Statistics)
This annual Statistical First Release reports on the number of pupils receiving education outside of school funded by Welsh local authorities and the number of pupils receiving elective home education in Wales. The information relates to the number of pupils receiving these forms of education during a census week in January for the academic years 2009/10 to 2012/13. During the 2012/13 academic year the census week was 14th to 18th January 2013.
Data relating to the 2009/10 academic year excludes 2 local authorities who were unable to supply the relevant information. All 22 local authorities provided data for following years.
Key results
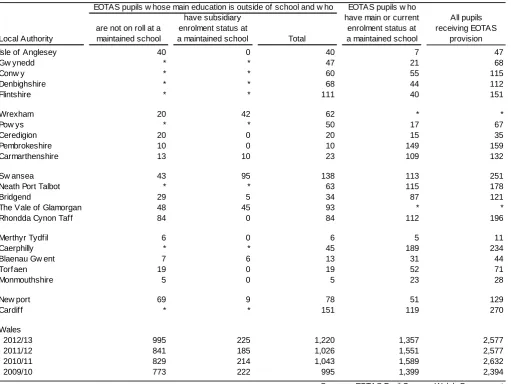
Chart 1: Pupils educated other than at school, by enrolment status at maintained or
special schools
1,589 1,551
1,357
214 185
225
829 841
995
0 500 1,000 1,500 2,000 2,500 3,000
2011 2012 2013
N
u
m
ber
of
pupi
ls
Not on Roll
Subsidiary
Main or Current
Pupils educated other than at school (not including home tuition)
• 2,577 pupils were recorded as being educated other than at school, with 1,220 of these receiving their main education outside of school (Table 1).
• The rate of pupils educated other than at school increased from 2.2 per 1,000 pupils in 2011/12 to 2.6 per 1,000 pupils in 2012/13, the highest that this value has been since 2010/11 (Table 2).
• 84.6 per cent of EOTAS pupils receiving their main education outside of school were recorded as having special educational needs in 2012/13, a decrease of 5.3 percentage points from 2011/12 (Table 4).
• Pupil referral units were the most frequently-used form of education provided to EOTAS pupils, accounting for 42.6 per cent of all education provisions (Table 7).
Statistician: Stephen Hughes Tel: 029 2082 3599 Email: [email protected]
Pupils educated at home
• 1,103 pupils of compulsory school age were reported to be educated at home during 2012/13 (Table 10).
Introduction
Chart 1 shows how the EOTAS pupils’ enrolment statuses in maintained schools have changed since 2010/11 and Table 1 breaks down these data by local authority for the 2012/13 academic year.
Tables 2 and 3 break down the number of pupils whose main education is other than at school by local authority, gender and age for academic years 2009/10 to 2013/13 and show the rate per 1,000 pupils of these data, giving a more reliable measure of differences between groups of pupils.
Tables 4 to 6 break down the number and percentage of pupils whose main education is other than at school by special educational need, free school meal entitlement and ethnic background.
Table 7 shows the types of education being provided for pupils whose main education is other than at school and Chart 2 displays these data graphically.
Tables 8 and 9 display the number of pupils who are registered at a single pupil referral unit or who are dual registered at a pupil referral unit by age, gender and local authority.
Table 10 relates to pupils who are electively home educated and breaks down the figures by local authority. The pupils behind the elective home education data are not included in any other tables in this statistical release.
Contents
page Chart 1 Pupils educated other than at school, by enrolment status at maintained or special
schools 1
Table 1 Number of pupils educated other than at school, by local authority, 2012/13 3 Table 2 Pupils whose main education is other than at school, by local authority 4 Table 3 Pupils whose main education is other than at school, by age and gender 5 Table 4 Pupils whose main education is other than at school, by Special Educational Need
(SEN) provision
6 Table 5 Pupils whose main education is other than at school, by free school meal (FSM)
entitlement
6 Table 6 Pupils whose main education is other than at school, by ethnic background 7 Table 7 Pupils whose main education is other than at school, by educational provision,
2012/13 8
Chart 2 Pupils whose main education is other than at school, by educational provision, 2012/13
8 Table 8 Number of pupils attending Pupil Referral Units in Wales, by age, 2012/13 9 Table 9 Number of pupils attending Pupil Referral Units in Wales, by local authority,
2012/13
10 Table 10 Number of pupils of compulsory school age electively educated at home, by local
Table 1: Number of pupils educated other than at school, by local authority, 2012/13 (a)
EOTAS pupils w hose main education is outside of school and w ho EOTAS pupils w ho
have subsidiary have main or current All pupils are not on roll at a enrolment status at enrolment status at receiving EOTAS Local Authority maintained school a maintained school Total a maintained school provision
Isle of Anglesey 40 0 40 7 47
Gw ynedd * * 47 21 68
Conw y * * 60 55 115
Denbighshire * * 68 44 112
Flintshire * * 111 40 151
Wrexham 20 42 62 * *
Pow ys * * 50 17 67
Ceredigion 20 0 20 15 35
Pembrokeshire 10 0 10 149 159
Carmarthenshire 13 10 23 109 132
Sw ansea 43 95 138 113 251
Neath Port Talbot * * 63 115 178
Bridgend 29 5 34 87 121
The Vale of Glamorgan 48 45 93 * *
Rhondda Cynon Taff 84 0 84 112 196
Merthyr Tydfil 6 0 6 5 11
Caerphilly * * 45 189 234
Blaenau Gw ent 7 6 13 31 44
Torfaen 19 0 19 52 71
Monmouthshire 5 0 5 23 28
New port 69 9 78 51 129
Cardiff * * 151 119 270
Wales
2012/13 995 225 1,220 1,357 2,577
2011/12 841 185 1,026 1,551 2,577
2010/11 829 214 1,043 1,589 2,632
2009/10 773 222 995 1,399 2,394
Sources: EOTAS Pupil Census, Welsh Government Pupil Level Annual School Census, Welsh Government
(a) 2 local authorities failed to provide useable data for the 2009/10 academic year. All 22 local authorities provided data in follow ing years.
• In 2012/13 2,577 pupils received local authority-funded education other than at school. Of these: • 995 pupils only received education other than at school;
• 225 pupils had ‘subsidiary’ enrolment status in maintained schools in PLASC, meaning that their main education was outside of school; and
• 1,357 pupils had ‘main’ or ‘current’ enrolment status in maintained schools in PLASC, which means that their main education was received in a maintained school.
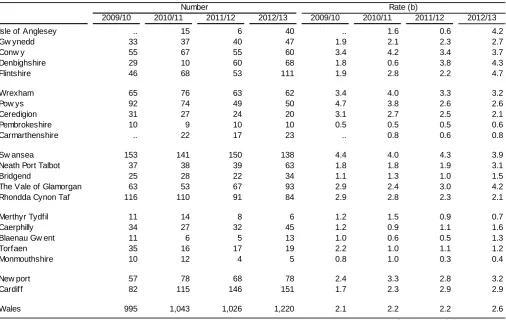
Table 2: Pupils whose main education is other than at school, by local authority (a)
Number Rate (b)
2009/10 2010/11 2011/12 2012/13 2009/10 2010/11 2011/12 2012/13
Isle of Anglesey .. 15 6 40 .. 1.6 0.6 4.2
Gw ynedd 33 37 40 47 1.9 2.1 2.3 2.7
Conw y 55 67 55 60 3.4 4.2 3.4
Denbighshire 29 10 60 68 1.8 0.6 3.8 4.3
Flintshire 46 68 53 111 1.9 2.8 2.2 4.7
Wrexham 65 76 63 62 3.4 4.0 3.3 3.2
Pow ys 92 74 49 50 4.7 3.8 2.6
Ceredigion 31 27 24 20 3.1 2.7 2.5 2.1
Pembrokeshire 10 9 10 10 0.5 0.5 0.5 0.6
Carmarthenshire .. 22 17 23 .. 0.8 0.6 0.8
Sw ansea 153 141 150 138 4.4 4.0 4.3 3.9
Neath Port Talbo
3.7
2.6
t 37 38 39 63 1.8 1.8 1.9 3.1
Bridgend 25 28 22 34 1.1 1.3 1.0 1.5
The Vale of Glamorgan 63 53 67 93 2.9 2.4 3.0 4.2
Rhondda Cynon Taf 116 110 91 84 2.9 2.8 2.3 2.1
Merthyr Tydfil 11 14 8 6 1.2 1.5 0.9 0.7
Caerphilly 34 27 32 45 1.2 0.9 1.1 1.6
Blaenau Gw ent 11 6 5 13 1.0 0.6 0.5 1.3
Torfaen 35 16 17 19 2.2 1.0 1.1
Monmouthshire 10 12 4 5 0.8 1.0 0.3 0.4
New port 57 78 68 78 2.4 3.3 2.8
Cardiff 82 115 146 151 1.7 2.3 2.9 2.9
Wales 995 1,043 1,026 1,220 2.1 2.2 2.2 2.6
Sources: EOTAS Pupil Census, Welsh Government School Census, Welsh Government
(a) 2 local authorities failed to provide useable data for the 2009/10 academic year. All 22 local authorities provided data in follow ing years. (b) Rate per 1,000 pupils. Full- and part-time pupils in maintained nursery, primary, secondary and special schools and pupils w hose main
education is other than at school as in the January School Census and EOTAS Pupil Census.
1.2
3.2
• The rate of pupils whose main education is other than at school remained the same between 2010/11 and 2011/12, but it has increased to 2.6 per 1,000 pupils in 2012/13.
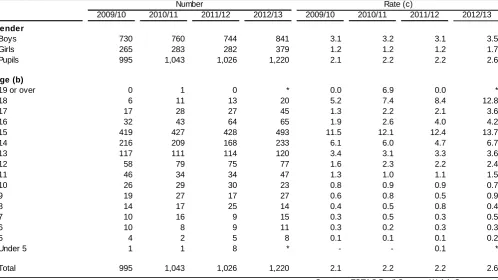
Table 3: Pupils whose main education is other than at school, by age and gender (a)
Number Rate (c)
2009/10 2010/11 2011/12 2012/13 2009/10 2010/11 2011/12 2012/13
Gender
Boys 730 760 744 841 3.1 3.2 3.1 3.5
Girls 265 283 282 379 1.2 1.2 1.2 1.7
Pupils 995 1,043 1,026 1,220 2.1 2.2 2.2 2.6
Age (b)
19 or over 0 1 0 * 0.0 6.9 0.0 *
18 6 11 13 20 5.2 7.4 8.4 12.8
17 17 28 27 45 1.3 2.2 2.1 3.6
16 32 43 64 65 1.9 2.6 4.0 4.2
15 419 427 428 493 11.5 12.1 12.4 13.7
14 216 209 168 233 6.1 6.0 4.7 6.7
13 117 111 114 120 3.4 3.1 3.3 3.6
12 58 79 75 77 1.6 2.3 2.2 2.4
11 46 34 34 47 1.3 1.0 1.1 1.5
10 26 29 30 23 0.8 0.9 0.9 0.7
9 19 27 17 27 0.6 0.8 0.5
8 14 17 25 14 0.4 0.5 0.8
7 10 16 9 15 0.3 0.5 0.3 0.5
6 10 8 9 11 0.3 0.2 0.3 0.3
5 4 2 5 8 0.1 0.1 0.1
Under 5 1 1 8 * - - 0.1 *
Total 995 1,043 1,026 1,220 2.1 2.2 2.2 2.6
Sources: EOTAS Pupil Census, Welsh Government School Census, Welsh Government
(a) 2 local authorities failed to provide useable data for the 2009/10 academic year. All 22 local authorities provided data in follow ing years. (b) Age as on 31 August at the start of the academic year.
(c) Rate per 1,000 pupils. Full- and part-time pupils in maintained nursery, primary, secondary and special schools, independent schools and pupils w hose main education is other than at school as in the January School Census and EOTAS Pupil Census.
0.9 0.4
0.2
• In 2012/13 there were still more than twice as many boys whose main education is other than at school than girls.
• Between 2010/11 and 2011/12 the rate of girls who were educated other than at school remained the same, but in 2012/13 this rate increased by the same amount as the rate for boys (0.4 per 1,000 pupils) (calculated using unrounded data).
• Between 2010/11 and 2012/13 a trend has been seen in pupils of compulsory secondary school age (11-15). The older pupils of this age group are, the more likely they are to be educated other than at school.
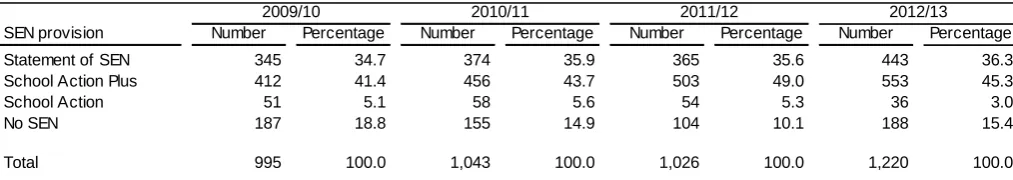
Table 4: Pupils whose main education is other than at school, by special educational
need (SEN) provision (a)
2009/10 2010/11 2011/12 2012/13
SEN provision Number Percentage Number Percentage Number Percentage Number Percentage
Statement of SEN 345 34.7 374 35.9 365 35.6 443 36.3
School Action Plus 412 41.4 456 43.7 503 49.0 553 45.3
School Action 51 5.1 58 5.6 54 5.3 36 3.0
No SEN 187 18.8 155 14.9 104 10.1 188 15.4
Total 995 100.0 1,043 100.0 1,026 100.0 1,220 100.0
Sources: EOTAS Pupil Census, Welsh Government Census, Welsh Government
(a) 2 local authorities failed to provide useable data for the 2009/10 academic year. All 22 local authorities provided data in follow ing years.
• In 2012/13 84.6 per cent of pupils whose main education was other than at school had special educational needs, a decrease of 5.3 percentage points from 2011/12 and the lowest that this value has been since 2010/11.
[image:6.595.43.554.381.451.2]• Since 2010/11 there have been more EOTAS pupils with school action plus than any other special educational need group, and this remains the same in 2012/13.
Table 5: Pupils whose main education is other than at school, by free school meal (FSM)
entitlement (a)
Free school 2009/10 2010/11 2011/12 2012/13
meal entitlement Number Percentage Number Percentage Number Percentage Number Percentage
Entitled to FSM 646 64.9 689 66.1 711 69.3 841 68.9
Not entitled to FSM 349 35.1 354 33.9 315 30.7 379 31.1
Total 995 100.0 1,043 100.0 1,026 100.0 1,220 100.0
Sources: EOTAS Pupil Census, Welsh Government
(a) 2 local authorities failed to provide useable data for the 2009/10 academic year. All 22 local authorities provided data in follow ing years.
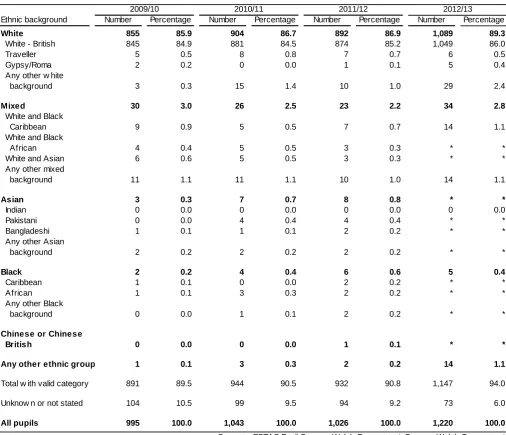
Table 6: Pupils whose main education is other than at school, by ethnic background (a)
2009/10 2010/11 2011/12 2012/13
Ethnic background Number Percentage Number Percentage Number Percentage Number Percentage
White 855 85.9 904 86.7 892 86.9 1,089 89.3
White - British 845 84.9 881 84.5 874 85.2 1,049 86.0
Traveller 5 0.5 8 0.8 7 0.7 6 0.5
Gypsy/Roma 2 0.2 0 0.0 1 0.1 5 0
Any other w hite
background 3 0.3 15 1.4 10 1.0 29 2.4
Mixed 30 3.0 26 2.5 23 2.2 34 2.8
White and Blac
.4
k
Caribbean 9 0.9 5 0.5 7 0.7 14 1.1
White and Black
African 4 0.4 5 0.5 3 0.3 * *
White and Asian 6 0.6 5 0.5 3 0.3 * *
Any other mixed
background 11 1.1 11 1.1 10 1.0 14 1.1
Asian 3 0.3 7 0.7 8 0.8 * *
Indian 0 0.0 0 0.0 0 0.0 0 0
Pakistani 0 0.0 4 0.4 4 0.4 *
Bangladeshi 1 0.1 1 0.1 2 0.2 * *
Any other Asian
background 2 0.2 2 0.2 2 0.2 * *
Black 2 0.2 4 0.4 6 0.6 5 0
Caribbean 1 0.1 0 0.0 2 0.2 *
African 1 0.1 3 0.3 2 0.2 * *
Any other Blac
.0 *
.4 *
k
background 0 0.0 1 0.1 2 0.2 * *
Chinese or Chinese
British 0 0.0 0 0.0 1 0.1 * *
Any other ethnic group 1 0.1 3 0.3 2 0.2 14
Total w ith valid category 891 89.5 944 90.5 932 90.8 1,147 94.0
Unknow n or not stated 104 10.5 99 9.5 94 9.2 73 6.0
All pupils 995 100.0 1,043 100.0 1,026 100.0 1,220 100.0
Sources: EOTAS Pupil Census, Welsh Government Census, Welsh Government
(a) 2 local authorities failed to provide useable data for the 2009/10 academic year. All 22 local authorities provided data in follow ing years. 1.1
• Since 2010/11 the percentage of pupils whose main education is other than at school who were known to be from a White – British ethnic background has been increasing. This value increased by 0.8 percentage points from 85.2 per cent in 2011/12 to 86.0 per cent in 2012/13.
• The percentage of EOTAS pupils reported as minority ethnic origin (pupils whose ethnic
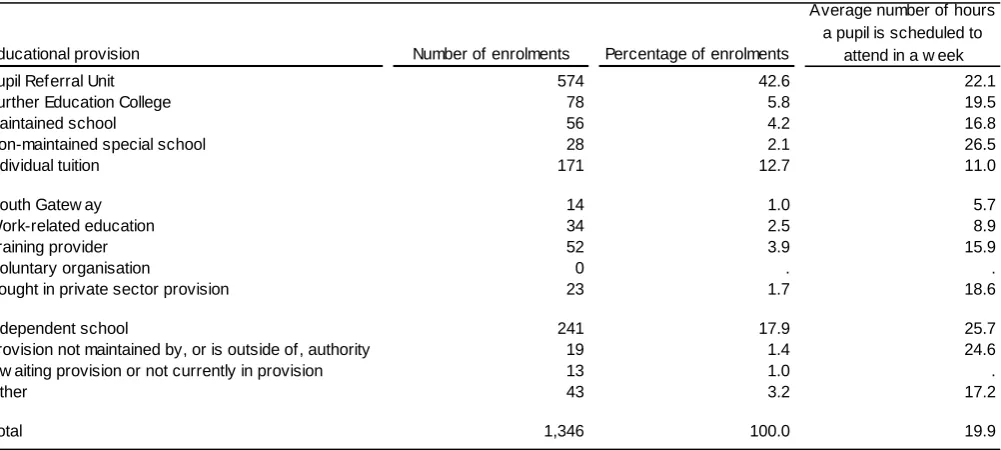
Table 7: Pupils whose main education is other than at school, by educational provision,
2012/13
Since pupils may attend more than one educational provision in a week, some pupils may be counted against more than one provision. That is why the number of enrolments is higher than the number of pupils whose main education is other than at school (1,220 pupils) in Table 1.
Educational provision Number of enrolments Percentage of enrolments
Pupil Referral Unit 574 42.6 22.1
Further Education College 78 5.8 19.5
Maintained school 56 4.2 16.8
Non-maintained special school 28 2.1 26.5
Individual tuition 171 12.7 11.0
Youth Gatew ay 14 1.0 5.7
Work-related education 34 2.5 8.9
Training provider 52 3.9 15.9
Voluntary organisation 0 . .
Bought in private sector provision 23 1.7 18.6
Independent school 241 17.9 25.7
Provision not maintained by, or is outside of, authority 19 1.4 24.6
Aw aiting provision or not currently in provision 13 1.0 .
Other 43 3.2 17.2
Total 1,346 100.0 19.9
Sources: EOTAS Pupil Census, Welsh Government Average number of hours
a pupil is scheduled to attend in a w eek
• In 2012/13 42.6 per cent of pupil enrolments were at Pupil Referral Units, the most popular educational provision; the next most popular educational provision was at independent schools. • 56 pupil enrolments took place in a maintained school as part of the local authority-funded EOTAS
provision;
• The average number of hours of education provided to pupils whose main education is outside of school was 19.9 hours during the census week.
Chart 2: Pupil enrolments, by educational provision, 2012/13
574 241
171 78
56 52 43 34 28 23 19 14 13 0
0 100 200 300 400 500 600
Table 8: Number of pupils attending pupil referral units in Wales, by age, 2012/13
Pupils w ho are registered at a single PRU (c) Pupils w ho are dually registered at a PRU (d)
Age (b) Boys Girls Pupil Boys Girls Pupil
19 or over 0 0 0 0 0 0
18 0 0 0 0 0
17 * * * 0 0 0
16 * * 12 * * *
15 158 100 258 80 41 121
14 94 31 125 78 46 124
13 52 12 64 73 32 105
12 35 8 43 55 14
11 * * 26 18 5 23
10 * * 15 * * 34
9 * * 16 25
8 * * 8 11
7 11 0 11 * *
6 6 0 6 *
5 * * * * *
Under 5 * * 12 * * *
Total 430 171 601 399 148 547
Sources: EOTAS Pupil Census, Welsh Government Pupil Level Annual School Census, Welsh Government
(a) Age as on 31 August 2012.
(b) Figures relate to pupils educated at only one PRU and include pupils receiving other EOTAS provisions or being recorded as having ‘subsidiary’ enrolment status at a maintained or special school in the 2012/13 Pupil-Level Annual School Census (PLASC), but exclude those w ith ‘main’ or ‘current’ enrolment in a maintained or special school in PLASC.
(c) Figures relate to pupils educated at more than one PRU or educated at a PRU w hile having 'main' or 'current' enrolment status at a maintained or special school in the 2012/13 PLASC.
0
69
0 25
0 11
15
* 11
5
• In the 2012/13 academic year 601 pupils were singly registered at a pupil referral unit, with a little over 70 per cent of these pupils being boys;
Table 9: Number of pupils attending pupil referral units in Wales, by local authority,
2012/13
Pupils w ho are registered at a single PRU (b) Pupils w ho are dually registered at a PRU (c)
Local Authority (a) Boys Girls Pupil Boys Girls Pupil
Isle of Anglesey 16 0 16 * * *
Gw ynedd 14 6 20 17 0 17
Conw y 21 13 34 40 10
Denbighshire 11 13 24 33 9 42
Flintshire 69 38 107 25 15 40
Wrexham 30 26 56 * * *
Pow ys * * 19 * * *
Ceredigion * * 14 * * 13
Pembrokeshire * * * 41 17 58
Carmarthenshire * * * 11 7 18
Sw ansea 75 20 95 * *
Neath Port Talbot * * * 16 5 21
Bridgend 5 5 10 26 26 52
The Vale of Glamorgan 35 7 42 * * *
Rhondda Cynon Taff 67 7 74 55 9 64
Merthyr Tydfil 0 0 0 0 0
Caerphilly * * 5 * * 9
Blaenau Gw ent * * 7 * * 18
Torfaen * * 7 35 17 52
Monmouthshire * * * * * *
New port 30 17 47 37 13
Cardiff 9 6 15 7 8
Wales 430 171 601 399 148 547
Sources: EOTAS Pupil Census, Welsh Government Pupil Level Annual School Census, Welsh Government
(a) Refers to the local authority in w hich pupils attended PRUs, not the local authority funding the provision.
(b) Figures relate to pupils educated at only one PRU and include pupils receiving other EOTAS provisions or being recorded as having ‘subsidiary’ enrolment status at a maintained or special school in the 2012/13 Pupil-Level Annual School Census (PLASC), but exclude those w ith ‘main’ or ‘current’ enrolment in a maintained or special school in PLASC.
(c) Figures relate to pupils educated at more than one PRU or educated at a PRU w hile having 'main' or 'current' enrolment status at a maintained or special school in the 2012/13 PLASC.
50
18
0
50 15
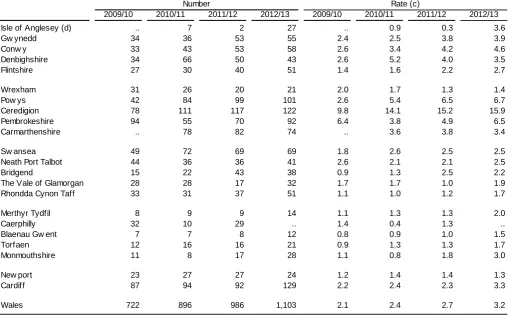
Table 10: Number of pupils of compulsory school age electively educated at home, by
local authority (a) (b)
Number Rate (c)
2009/10 2010/11 2011/12 2012/13 2009/10 2010/11 2011/12 2012/13
Isle of Anglesey (d) .. 7 2 27 .. 0.9 0.3 3.6
Gw ynedd 34 36 53 55 2.4 2.5 3.8 3.9
Conw y 33 43 53 58 2.6 3.4 4.2
Denbighshire 34 66 50 43 2.6 5.2 4.0 3.5
Flintshire 27 30 40 51 1.4 1.6 2.2 2.7
Wrexham 31 26 20 21 2.0 1.7 1.3 1.4
Pow ys 42 84 99 101 2.6 5.4 6.5
Ceredigion 78 111 117 122 9.8 14.1 15.2 15.9
Pembrokeshire 94 55 70 92 6.4 3.8 4.9
Carmarthenshire .. 78 82 74 .. 3.6 3.8 3.4
Sw ansea 49 72 69 69 1.8 2.6 2.5 2.5
Neath Port Talbo
4.6
6.7
6.5
t 44 36 36 41 2.6 2.1 2.1 2.5
Bridgend 15 22 43 38 0.9 1.3 2.5 2.2
The Vale of Glamorgan 28 28 17 32 1.7 1.7 1.0 1.9
Rhondda Cynon Taff 33 31 37 51 1.1 1.0 1.2 1.7
Merthyr Tydfil 8 9 9 14 1.1 1.3 1.3 2.0
Caerphilly 32 10 29 .. 1.4 0.4 1.3 ..
Blaenau Gw ent 7 7 8 12 0.8 0.9 1.0 1.5
Torfaen 12 16 16 21 0.9 1.3 1.3
Monmouthshire 11 8 17 28 1.1 0.8 1.8 3.0
New port 23 27 27 24 1.2 1.4 1.4
Cardiff 87 94 92 129 2.2 2.4 2.3
Wales 722 896 986 1,103 2.1 2.4 2.7 3.2
Sources: EOTAS Pupil Census, Welsh Government
(a) 2 local authorities failed to provide useable data for the 2009/10 academic year. All 22 local authorities provided data in 2010/11 and 2011/12. One local authority w as not able to supply data for electively home educated pupils in 2012/13.
(b) Data relate to pupils aged 5 to 15 on 31 August before the start of the academic year. Where local authorities do not know a pupil's age they w ere asked to provide an estimate.
(c) Rate per 1,000 pupils aged 5-15 on 31 August before the start of the academic year. The denominator includes pupils w hose main education is other than at school, pupils w ho had 'main' or 'current' enrolment status in the January PLASC and pupils w ho are know n to be electively home educated.
(d) Isle of Anglesey did not provide the ages of elective home educated pupils for 2012/13, so it is unknow n w hether their data include pupils outside of the 5-15 age range for this year. It w as not mandatory to provide such information.
".." means that the data item is not available.
1.7
1.3 3.3
• In the 2012/13 academic year 1,103 children were known to be electively home educated in Wales. • Of the local authorities who reported on their electively home educated children Newport had the
Notes
1 Context
1.1 Policy/Operational
Local authorities are required to provide suitable education at school or otherwise than at school for those children of compulsory school age who, by reason of illness, exclusion from school or otherwise, may not for any period receive suitable education unless such arrangements are made for them. In practice, local authorities respond to that duty in widely varying ways, relating to their individual circumstances, such as their geography, socio-economic situation and educational policies. A key action within the Welsh Government’s Behaviour and Attendance Action Plan is to raise the standards of EOTAS provision across Wales, through the implementation of a specific action plan relating to EOTAS. This can be found at the following link:
http://wales.gov.uk/topics/educationandskills/schoolshome/pupilsupport/?lang=en.
1.2 Related Publications
England publish the number of pupils on roll at Pupil Referral Units in the statistical release entitled ‘Schools, Pupils and their Characteristics, January 2013’. The latest available statistics can be found here:
https://www.gov.uk/government/publications/schools-pupils-and-their-characteristics-january-2013.
2 Data Source
The EOTAS Pupil Census is carried out annually and collects data on pupils educated other than at school from local authorities electronically via a secure website. The collection is carried out by the school statistics team in Knowledge and Analytical Services within the Welsh Government.
3 Definitions
3.1 Coverage
The information in this Statistical First Release relates to pupils receiving local authority-funded education outside of the mainstream school environment during a census week each January and the number of pupils of compulsory school age (aged 5 to 15 on 31 August before the start of the academic year) known by local authorities to be electively home educated. For the 2012/13 academic year the census week was 14 to 18 January 2013.
Data for the 2009/10 academic year excluded 2 local authorities that were unable to supply useable data in time for publication and therefore gave an incomplete picture of the number of pupils educated other than at school in Wales. All 22 local authorities provided data for the following academic years.
In 2012/13 data were received on 2,577 pupils receiving education other than at school from all 22 local authorities in Wales. Of the 2,577 pupils receiving EOTAS provision 1,357 were recorded in the January 2013 Pupil-Level Annual School Census as having ‘main’ or ‘current’ enrolment status in maintained primary, secondary or special schools and were therefore considered to be receiving their main education in a maintained school. The remaining 1,220 pupils were considered to be receiving their main education outside of school. The focus of this Statistical First Release is on pupils mainly educated other than at school, but to give a complete picture it was necessary to include all pupils receiving EOTAS provision in Chart 1 and Tables 1, 8 and 9.
Local authorities reported that in 201 2/13 1,190 pupils were being electively home educated. Of these pupils 87 were known to not be of compulsory school age so they were excluded from the figures contained in this release, leaving a total of 1,103 pupils.
educated pupils, meaning that it was not possible to determine whether they were of compulsory school age or not. In 2012/13 Caerphilly did not provide any information regarding electively home educated pupils. It is not mandatory for local authorities to provide this information.
3.2 Definitions of Pupils Educated Other than at School
In the context of this statistical release:• a pupil being educated other than at school (EOTAS) was recorded as receiving or awaiting education provision funded by the local authority otherwise than in a maintained school setting during the census week of the EOTAS Pupil Census. A pupil may also be included in this category if they:
• attend an independent or non-maintained special school for which the local authority is responsible for paying all or part of the tuition fees;
• are placed in a maintained school as part of their education funded by the local authority. • the phrase EOTAS pupil is used to refer to a pupil educated other than at school as defined
above.
• an EOTAS pupil whose main education is other than at school is a pupil being educated other than at school who is either not on roll at a maintained school or is recorded as having a
‘subsidiary’ enrolment status at a maintained school in the January Pupil-Level Annual School Census.
• an EOTAS pupil whose main education is in a maintained school is a pupil being educated other than at school with a ‘main’ or ‘current’ enrolment status in the January Pupil-Level Annual School Census.
• pupils being electively home educated are children whose parents have decided to educate at home rather than at school and are not classed as EOTAS pupils. Although by definition they are educated other than at school, education for these pupils is not funded by the local authority and there is no legal basis under which the local authority can collect personal data about them. Data on electively home educated pupils are restricted to headcounts by local authority and are
provided voluntarily by the local authority. Figures related to pupils electively home educated have been reported in separate tables to those relating to EOTAS pupils.
4 Rounding and Symbols
In tables where figures have been rounded to the nearest final digit, there may be an apparent discrepancy between the sum of the constituent items and the total shown.
The following symbols have been used throughout this publication: . data item is not applicable.
.. data item is not available.
- data item is not zero, but would be rounded to zero because less than half the final digit is shown.
* data item is disclosive.
• Ministers and the Members Research Service in the National Assembly for Wales; • other government departments;
• local authorities and schools;
• ESTYN, Her Majesty’s Inspectorate of Education and Training in Wales; • The Department for Education and Skills in the Welsh Government; • other areas of the Welsh Government;
• the research community;
• students, academics and universities;
• individual citizens, private companies and the media.
These statistics are used in a variety of ways. Some examples of these are: • advice to Ministers;
• to inform the education policy decision-making process in Wales; • to inform ESTYN during school inspections;
• to assist in research in educational attainment.
5.2 Accuracy
The Welsh Government works closely with local authorities in order to ensure all data are validated before tables are published. Data is collated into an electronic return and submitted to the Welsh
Government through DEWi, a secure online data transfer system developed by the Welsh Government. Various stages of automated validation and sense-checking are built into the process to ensure a high quality of data.
Starting in 2011/12, following the collection of the data an additional four week validation period was carried out in which local authorities were sent summary tables of their data and asked to check that they were correct. While most of the data were confirmed to be correct, these checking periods highlighted problems with several local authorities’ data which were resolved, further improving the accuracy of the data.
The first edition of this statistical first release was labelled as ‘experimental statistics’, which are new official statistics undergoing evaluation. Experimental statistics are published in order to involve users and stakeholders in their development and as a means to build in quality at an early stage. Issues raised regarding the coverage and quality of the data behind the statistical first release ‘Pupils Educated Other than at School, 2009/10’ and some of the tables within have been addressed in the latest edition,
improving the accuracy and usefulness of the statistics presented. Despite full coverage for the 2010/11 to 2012/13 academic years, and the improvement in data quality through increased validation and verification checks, the ‘experimental statistics’ label remains this year. Time constraints meant that the thorough evaluation needed to upgrade the data to ‘official statistics’ could not be carried out before publication the publication date, but it will hopefully be completed by the time the 2013/14 data are published.
5.3 Timeliness and Punctuality
DEWi was available for uploading files on 21 January 2013, with local authorities asked to submit data for all pupils receiving or awaiting local authority-funded education outside of the maintained school environment during the census week of 14 to 18 January 2013. Local authorities were then asked to validate their data within the validation period, which closed on 17 May 2013, nearly two months earlier than last year.
5.4 Accessibility and Clarity
This Statistical First Release is pre-announced and then published on the Statistics section of the Welsh Government website. It will be accompanied by more detailed tables about the number of pupils at Pupil Referral Units on StatsWales, a free to use service that allows visitors to view, manipulate, create and download data.
5.5 Comparability
Two local authorities failed to provide useable data for the 2009/10 academic year and the data’s quality was questionable, so caution should be used when comparing data with this year.
Tables 8 and 9 contain the number of pupils only on roll at Pupil Referral Units (PRUs) in Wales by gender, age and local authority, which in previous years have been published in the Welsh
Government’s publication entitled ‘Schools in Wales: General Statistics.’ Prior to 2009/10 the figures for this table were collected directly from PRUs via the STATS1 form. Tables 8 and 9 are now based upon data from the EOTAS Pupil Census and the January Pupil-Level Annual School Census. Because of the change in methodology used the number of pupils that would have been reported as only being on roll at a PRU in the STATS1 form may differ slightly from those that have been produced for this statistical first release.
In the 2009/10 edition of this release Table 4 presented the number of pupils only registered at a PRU (which included pupils registered at more than one PRU) and the number of pupils registered at a PRU and other educational institutions. To meet with user demand this table (now Table 8) was changed in the 2010/11 edition to present the number of pupils only registered at a single PRU and the number of pupils dual registered at more than one PRU or at a PRU and another maintained school. The new definitions have also been used in Table 9 and match the definitions previously used when presenting the number of pupils attending PRUs. Since Table 4 in the 2009/10 release and the same table in subsequent releases have different definitions for single and dual registered pupils it is not
recommended that they be compared. Comparable data are available from the school statistics team within the Welsh Government on request.
Tables and charts in this statistical first release contain data about different groups of EOTAS pupils as defined in section 3.2. Whether the tables and charts are referring to EOTAS pupils whose main
education is other than at school, whose main education is at a maintained school or all EOTAS pupils is clearly indicated, so before comparing two tables or charts please check that they are referring to the same group of EOTAS pupils.
Pupils by age (Table 3) and by SEN (Table 4) can be set in context by comparing to the general school population. The relevant data can be found in the publication of final school census results here: http://wales.gov.uk/topics/statistics/theme/schools/?lang=en.