V
VA
AL
LI
ID
DA
A
TI
T
IO
O
N
N
O
OF
F
C
CI
IN
NI
IT
TA
AP
PR
RI
ID
D
E
E
A
AN
ND
D
P
PA
AN
NT
TO
OP
PR
RA
AZ
ZO
OL
LE
E
I
IN
N
P
PH
HA
AR
R
MA
M
AC
CE
EU
UT
TI
IC
C
AL
A
L
D
DO
OS
SA
AG
GE
E
F
FO
OR
RM
MS
S
B
BY
Y
R
RP
P-
-H
HP
PL
LC
C
Dissertation Submitted to
THE TAMIL NADU Dr. M.G.R MEDICAL UNIVERSITY
CHENNAI- 600 032.
In Partial fulfillment for the award of the degree of
MASTER OF PHARMACY
IN
PHARMACEUTICAL ANALYSIS
Submitted By
Reg.No:
261430216
Under the guidance of
S. JAYASEELAN, M.Pharm, Ph.D
DEPARTMENT OF PHARMACEUTICAL ANALYSIS
J.K.K.NATTRAJA COLLEGE OF PHARMACY
KUMARAPALAYAM-638183
This is to certify that the dissertation work entitled
“
A
A
N
N
A
A
L
L
Y
Y
T
T
I
I
C
C
A
A
L
L
M
M
E
E
T
T
H
H
O
O
D
D
D
D
E
E
V
V
E
E
L
L
O
O
P
P
M
M
E
E
N
N
T
T
A
A
N
N
D
D
M
M
E
E
T
T
H
H
O
O
D
D
V
V
A
A
L
L
I
I
D
D
A
A
T
T
I
I
O
O
N
N
O
O
F
F
C
C
I
I
N
N
I
I
T
T
A
A
P
P
R
R
I
I
D
D
E
E
A
A
N
N
D
D
P
P
A
A
N
N
T
T
O
O
P
P
R
R
A
A
Z
Z
O
O
L
L
E
E
I
I
N
N
P
P
H
H
A
A
R
R
M
M
A
A
C
C
E
E
U
U
T
T
I
I
C
C
A
A
L
L
D
D
O
O
S
S
A
A
G
G
E
E
F
F
O
O
R
R
M
M
S
S
B
B
Y
Y
R
R
P
P
-
-
H
H
P
P
L
L
C
C”,
submitted by the student bearing
Reg. No: 261430216
to “
The
Tamil Nadu Dr.M.G.R.Medical University
–
Chennai
” , in partial
fulfillment for the award of Degree of
Master of Pharmacy
in
Pharmaceutical Analysis
was evaluated by us during the
examination held on………..……….
This is to certify that the work embodied in this dissertation
“A
A
N
N
A
A
L
L
Y
Y
T
T
I
I
C
C
A
A
L
L
M
M
E
E
T
T
H
H
O
O
D
D
D
D
E
E
V
V
E
E
L
L
O
O
P
P
M
M
E
E
N
N
T
T
A
A
N
N
D
D
M
M
E
E
T
T
H
H
O
O
D
D
V
V
A
A
L
L
I
I
D
D
A
A
T
T
I
I
O
O
N
N
O
O
F
F
C
C
I
I
N
N
I
I
T
T
A
A
P
P
R
R
I
I
D
D
E
E
A
A
N
N
D
D
P
P
A
A
N
N
T
T
O
O
P
P
R
R
A
A
Z
Z
O
O
L
L
E
E
I
I
N
N
P
P
H
H
A
A
R
R
M
M
A
A
C
C
E
E
U
U
T
T
I
I
C
C
A
A
L
L
D
D
O
O
S
S
A
A
G
G
E
E
F
F
O
O
R
R
M
M
S
S
B
B
Y
Y
R
R
P
P
-
-
H
H
P
P
L
L
C”,
C
submitted
to The Tamil Nadu Dr.M.G.R.Medical University, Chennai, was carried
out by
Mr. D.RAMESH KANNAN [Reg.No: 261430216],
for the
Partial fulfillment of degree of
MASTER OF PHARMACY
in
PHARMACEUTICAL ANALYSIS
under my guidance and supervision
during the academic year 2015-2016.
Dr. R. SAMBATH KUMAR, M.Pharm., Ph.D., Dr.V.Sekar, M.Pharm., Ph.D.,
Principal, HOD
Mr.S. JAYASEELAN, M.Pharm, Ph.D
Guide
.
This is to certify that the work embodied in this dissertation
entitled
“A
A
N
N
A
A
L
L
Y
Y
T
T
I
I
C
C
A
A
L
L
M
M
E
E
T
T
H
H
O
O
D
D
D
D
E
E
V
V
E
E
L
L
O
O
P
P
M
M
E
E
N
N
T
T
A
A
N
N
D
D
M
M
E
E
T
T
H
H
O
O
D
D
V
V
A
A
L
L
I
I
D
D
A
A
T
T
I
I
O
O
N
N
O
O
F
F
C
C
I
I
N
N
I
I
T
T
A
A
P
P
R
R
I
I
D
D
E
E
A
A
N
N
D
D
P
P
A
A
N
N
T
T
O
O
P
P
R
R
A
A
Z
Z
O
O
L
L
E
E
I
I
N
N
P
P
H
H
A
A
R
R
M
M
A
A
C
C
E
E
U
U
T
T
I
I
C
C
A
A
L
L
D
D
O
O
S
S
A
A
G
G
E
E
F
F
O
O
R
R
M
M
S
S
B
B
Y
Y
R
R
P
P
-
-
H
H
P
P
L
L
C”,
C
submitted to “
The Tamil Nadu Dr. M.G.R. Medical
University
-
Chennai
” , in partial fulfillment to the requirement for the
award
of
Degree
of
MASTER
OF
PHARMACY
in
PHARMACEUTICAL ANALYSIS
, is a bonafide work carried out by
Mr. D.RAMESH KANNAN, [Reg.No.261430216]
during the
academic year 2015-2016, under the guidance and supervision of
Mr . S . JA YA SE ELA N, M .P h a rm, P h. D,
Assistant Professor of
pharmaceutical Analysis, J.K.K. Nattraja College of Pharmacy,
Kumarapalayam.
Place: KUMARAPALAYAM Dr. R. SAMBATHKUMAR, M.Pharm, Ph.D.,
Date: Professor & Principal,
J.K.K.Nattraja College of Pharmacy.
This is to certify that the work embodied in this dissertation
“A
A
N
N
A
A
L
L
Y
Y
T
T
I
I
C
C
A
A
L
L
M
M
E
E
T
T
H
H
O
O
D
D
D
D
E
E
V
V
E
E
L
L
O
O
P
P
M
M
E
E
N
N
T
T
A
A
N
N
D
D
M
M
E
E
T
T
H
H
O
O
D
D
V
V
A
A
L
L
I
I
D
D
A
A
T
T
I
I
O
O
N
N
O
O
F
F
C
C
I
I
N
N
I
I
T
T
A
A
P
P
R
R
I
I
D
D
E
E
A
A
N
N
D
D
P
P
A
A
N
N
T
T
O
O
P
P
R
R
A
A
Z
Z
O
O
L
L
E
E
I
I
N
N
P
P
H
H
A
A
R
R
M
M
A
A
C
C
E
E
U
U
T
T
I
I
C
C
A
A
L
L
D
D
O
O
S
S
A
A
G
G
E
E
F
F
O
O
R
R
M
M
S
S
B
B
Y
Y
R
R
P
P
-
-
H
H
P
P
L
L
C
C”
submitted
in partial fulfillment to The Tamil Nadu Dr.M.G.R. Medical University,
Chennai, in the requirement for the award of degree of
MASTER OF
PHARMACY
in
PHARMACEUTICAL
ANALYSIS
, is a bonafide
work carried out by
Mr. D.RAMESH KANNAN, [Reg. No. 261430216]
during the academic year 2015-2016, under my guidance and direct
supervision in the department of Pharmaceutical analysis, J.K.K.Nataraja
College of Pharmacy, Kumarapalayam.
Mr.S. JAYASEELAN, M.Pharm, Ph.D,
Assistant
Professor,
Department of Pharmaceutical
Analysis,
J.K.K.Nataraja college of Pharmacy,
Kumarapalayam - 638183,
Tamil Nadu.
PLACE: KUMARAPALAYAMThe work presented in this dissertation entitled
“
A
A
N
N
A
A
L
L
Y
Y
T
T
I
I
C
C
A
A
L
L
M
M
E
E
T
T
H
H
O
O
D
D
D
D
E
E
V
V
E
E
L
L
O
O
P
P
M
M
E
E
N
N
T
T
A
A
N
N
D
D
M
M
E
E
T
T
H
H
O
O
D
D
V
V
A
A
L
L
I
I
D
D
A
A
T
T
I
I
O
O
N
N
O
O
F
F
C
C
I
I
N
N
I
I
T
T
A
A
P
P
R
R
I
I
D
D
E
E
A
A
N
N
D
D
P
P
A
A
N
N
T
T
O
O
P
P
R
R
A
A
Z
Z
O
O
L
L
E
E
I
I
N
N
P
P
H
H
A
A
R
R
M
M
A
A
C
C
E
E
U
U
T
T
I
I
C
C
A
A
L
L
D
D
O
O
S
S
A
A
G
G
E
E
F
F
O
O
R
R
M
M
S
S
B
B
Y
Y
R
R
P
P
-
-
H
H
P
P
L
L
C”,
C
was
carried out by me, under the
direct supervision of
Mr. S. JAYASEELAN, M.Pharm, Ph.D,
Assistant Professer of Pharmaceutical Analysis, J.K.K.Nattaraja College
of Pharmacy, Komarapalayam.
I further declare that this work is original and this
dissertation has not been submitted previously for the award of any other
degree, diploma, associate ship and fellowship or any other similar title.
The information furnished in this dissertation is genuine to the best of my
knowledge.
D.RAMESH KANNAN
,
Reg.No:261430216,
.
PLACE: KUMARAPALAYAM
Firstly, I am many more thankful to the God for blessing me to have a
great strength and courage to complete my dissertation. Behind every
success there are lots of efforts, but efforts are fruitful due to hands
making the passage smoother. So, I am thankful to all those hands and
people who made my work grand success.
I am proud to dedicate my humblest regards and deep sense of
gratitude and heartfelt thanks to late
Thiru. J.K.K. NATARAJAH
CHETTIAR, founder
of our college. I wish to express my sincere
thanks to our most respectful correspondent
Tmt. N. SENDAMARAAI
and our beloved Managing Director
Mr. S. OMM SHARRAVANA,
for
enabling us to do the project work.
I take this opportunity with pride and immense pleasure expressing
my deep sense of gratitude to our respectable and beloved guide
Mr. S. JAYASEELAN, M.Pharm, Ph.D,
Assistant Professer,
Department of Pharmaceutical Analysis
J.K.K.Nattaraja College of
Pharmacy,
whose active guidance, innovative ideas, constant inspiration,
untiring efforts help encouragement and continuous supervision has made
the presentation of dissertation a grand and glaring success to complete
this research work successfully.
us to complete this task vast success.
My sincere thanks to
Dr. V. SEKAR,
M.Pharm.,Ph.D.,
HOD.Professor,
Dr. Carolin Nimila,
M.Pharm., Ph.D., Department of
Pharmaceutical Analysis and
Dr. K. K.Senthil Kumar,
M.Pharm
assistant professor, for their valuable suggestions.
My glorious acknowledgement to
Dr.K.SENGODAN, M.B.B.S.,
administrative officer for encouraging us in a kind and generous manner
to complete this work.
Mr. D.RAMESH KANNAN
Dedicated
to
Almighty
My Beloved Parents,
&
CHARPTER
NO
TITLE PAGE NO
1 INTRODUCTION 1
2 LITERATURE REVIEW 50
3 DRUG PROFILE 54
4 AIM AND PLAN OFWORK 58
5 MATERIALS AND METHODS 60
6 CHROMATOGRAMS 87
7 RESULT AND DISCUSSION 99
8 CONCLUSION 103
API Active pharmaceutical Ingredient
CGLP Current Good Laboratories Practices
CGMP Current Good Manufactures Practices
CV Co-efficient of Variation
°c Degree centigrade
FTIR Fourier Transmission Infra Red
ICH International Conference on Harmonization of
K Capacity factor
LOD Limit of detection
LOQ Limit of Quantitation
mg Milligram
mcg microgram
mL Milliliter
mg/mL Milligram per milliliter
N Plate number
NLT Not less than
NMT Not more than
nm Nanometer
PDA Photo Diode Array
RI Refractive Index
RP-HPLC Reverse phase High Performance Liquid Chromatography
RS Resolution
RSD Relative Standard Deviation
RT Retention time
USP United States Pharmacopoeia
UV Ultra violet
v/v Volume per volume
µg Micro gram
µg/mL Microgram per Milliliter
ppm Parts per million
Fig Figure
CIN Cinitapride
Dept. of Pharmaceutical Analysis 1 J.K.K. Nattraja College Of Pharmacy
INTRODUCTION
Pharmaceutical analysis deals not only with medicaments (drugs and
formulations), but also with their precursors i.e. with the raw material whose degree
of purity, which in turn decides the quality of medicaments. The quality of a drug is
determined, after establishing its authenticity, which is carried by testing its purity and
the quality of the pure substance in the drug and its formulations.
HIGH-PERFORMANCE LIQUID CHROMATOGRAPHY (HPLC):
High-performance liquid chromatography is a chromatographic technique
used to separate the components in a mixture, to identify each component, and to
quantify each component .The method involves a liquid sample being passed over a
solid adsorbent material packed into a column using a flow of liquid solvent. Each
analyte in the sample interacts slightly differently with the adsorbent material, thus
retarding the flow of the analytes. If the interaction is weak, and the analytes flow off
the column in a short amount of time, and if the interaction is strong, then the elution
time is long.
Chromatography may be defined as a method of separating a mixture of
components into individual components through equilibrium distribution between two
phases. (Sharma B.K.1994)
The HPLC method was considered the choice of estimation, since this method is
the most powerful of all chromatographic and other separative methods. The HPLC
method has enabled analytical chemist to attain great success in solving his analytical
problems. The HPLC is the method of choice in the field of analytical chemistry,
since this method is specific, robust, linear, precise, and accurate and the limit of
Dept. of Pharmaceutical Analysis 2 J.K.K. Nattraja College Of Pharmacy
The schematic representation of an HPLC instrument typically includes a
sampler, pumps, and a detector. The sampler brings the sample mixture into the
mobile phase stream which carries it into the column. The pumps deliver the desired
flow and composition of the mobile phase through the column. The detector generates
a signal proportional to the amount of sample component emerging from the column,
hence allowing for quantitative analysis of the sample components .A digital
microprocessor and user software control the HPLC instrument and provide data
analysis. Some models of mechanical pumps in a HPLC instrument can mix multiple
solvents together in ratios changing in time, generating a composition gradient in the
mobile phase. Various detectors are in common use, such as UV/Vis, photodiode
array (PDA) or Refractive index (RI).
Dept. of Pharmaceutical Analysis 3 J.K.K. Nattraja College Of Pharmacy CHROMATOGRAPHY AND ITS TYPES
Chromatography is a family of analytical chemistry techniques for the
separation of mixtures. It involves passing the sample, a mixture that contains the
analyte, in the "mobile phase", often in a stream of solvent, through the "stationary
phase." The stationary phase retards the passage of the components of the sample.
When components pass through the system at different rates they become separated in
time, like runners in a marathon. Ideally, each component has a characteristic time of
passage through the system. This is called its "retention time."
A physical separation method in which the components of a mixture are
separated by differences in their distribution between two phases, one of which is
stationary (stationary phase) while the other (mobile phase) moves through it in a
definite direction. The substances must interact with the stationary phase to be
retained and separated by it.
A chromatograph takes a chemical mixture carried by liquid or gas and
separates it into its component parts as a result of differential distributions of the
solutes as they flow around or over a stationary liquid or solid phase. Various
techniques for the separation of complex mixtures rely on the differential affinities of
substances for a gas or liquid mobile medium and for a stationary adsorbing medium
through which they pass; such as paper, gelatin, or magnesium silicate gel.
Analytical chromatography is used to determine the identity and concentration
of molecules in a mixture. Preparative chromatography is used to purify larger
quantities of a molecular species.
Dept. of Pharmaceutical Analysis 4 J.K.K. Nattraja College Of Pharmacy THE DIFFERENT TYPES OF CHROMATOGRAPHY
Adsorption Chromatography
Adsorption chromatography is probably one of the oldest types of
chromatography around. It utilizes a mobile liquid or gaseous phase that is adsorbed
onto the surface of a stationary solid phase. The equilibration between the mobile and
stationary phase accounts for the separation of different solutes.
Partition Chromatography
This form of chromatography is based on a thin film formed on the surface of
the solid support by a liquid stationary phase. Solute equilibrates between the mobile
phase and the stationary liquid.
Ion Exchange Chromatography
In this type of chromatography, the use of a resin (the stationary solid phase)
is used to covalently attach anions or cations on it. Solute ions of the opposite charge
in the mobile liquid phase are attracted to the resin by electrostatic forces.
Molecular Exclusion Chromatography
Also known as gel permeation or gel filtration, this type of chromatography
lacks an attractive interaction between the stationary phase and solute. The liquid or
gaseous phase passes through a porous gel, which separates the molecules according
to its size. The pores are normally small and exclude the larger solute molecules, but
allow smaller molecules to enter the gel, causing them to flow through a larger
volume. This causes the larger molecules to pass through the column at a faster rate
Dept. of Pharmaceutical Analysis 5 J.K.K. Nattraja College Of Pharmacy
Affinity Chromatography
This is the most selective type of chromatography employed. It utilizes the
specific interaction between one kind of solute molecule and a second molecule that is
immobilized on a stationary phase. For example, the immobilized molecule may be an
antibody to some specific protein. When this molecule passes solute containing a
mixture of proteins, only the specific protein is reacted to this antibody, binding it to
the stationary phase.
This protein is later extracted by changing the ionic strength or pH.
Fundamental attitude
In all chromatography there is a mobile phase and a stationary phase. The
stationary phase is the phase that doesn't move and the mobile phase is the phase that
does move. The mobile phase moves through the stationary phase picking up the
compounds to be tested. As the mobile phase continues to travel through the
stationary phase it takes the compounds with it. At different points in the stationary
phase the different components of the compound are going to be absorbed and are
going to stop moving with the mobile phase. This is how the results of any
chromatography are gotten, from the point at which the different components of the
compound stop moving and separate from the other components.
In paper and thin-layer chromatography the mobile phase is the solvent. The
stationary phase in paper chromatography is the strip or piece of paper that is placed
in the solvent. In thin-layer chromatography the stationary phase is the thin-layer cell.
Both these kinds of chromatography use capillary action to move the solvent through
Dept. of Pharmaceutical Analysis 6 J.K.K. Nattraja College Of Pharmacy TYPES OF HIGH PERFORMANCE LIQUID CHROMATOGRAPHY
Based on modes of chromatography
Normal phase chromatography
Reverse phase chromatography
Based on principles of separation
Adsorption chromatography
Ion exchange chromatography
Ion pair chromatography
Size exclusion chromatography
Affinity chromatography
Chiral phase chromatography
Based on elusion technique
Isocratic separation
Gradient separation
Based on the scale of operation
Analytical HPLC
Dept. of Pharmaceutical Analysis 7 J.K.K. Nattraja College Of Pharmacy COMPONENTS OF HPLC SYSTEM:
Pump
Pump generates a flow of elute from the solvent reservoir to the system. Most
pumps used in current LC system generate the flow by back-and forth motion of a
motor –driven piston. (Reciprocating pumps). Because of this piston motion, it
produces “pulses”. There have been large system improvements to reduce this
pulsation and the recent pumps create much less pulse compared to the older ones.
Recent analysis requires very high sensitivity to quantify a small amount of analytes,
and thus even a minor change in the flow rate can influence the analysis. Therefore,
the pumps required for the high sensitivity analysis needs to be highly precise.
Injector
An injector is placed next to the pump. The simplest method is to use a
syringe, and the sample is introduced to the flow of eluent. Since the precision of LC
measurement is largely affected by the reproducibility of sample injection, the design
of injector is an important factor. The most widely used injection method is based on
sampling loops. The use of auto sampler (auto-injector) system is also widely used
that allows repeated injections in a set scheduled-timing.
Column
The separation is performed inside the column; therefore, it can be said that the
column is the heart of an LC system. The packing material generally used is silica or
polymer gels. The eluent used for LC varies from acidic to basic solvents. Most
column housing is made of stainless steel, since stainless is tolerant towards a large
variety of solvents. However, for the analysis of some analytes such as biomolecules
and ionic compounds, contact with metals is not desired, thus polyether ether ketone
Dept. of Pharmaceutical Analysis 8 J.K.K. Nattraja College Of Pharmacy Detector
Separation of analytes is performed inside the column, Whereas a detector is used
to observe the obtained separation .The composition of the eluent is consistent when
no analyte is present .While the presence of analyte changes the composition of the
eluent. What detector does is to measure these differences. This difference is
monitored as a form of electronic signal.
On-line detectors
Refractive index
UV/Vis Fixed wave length
UV/Vis variable wave length
UV/Vis Diode array
Fluorescence
Conductivity
Mass –Spectrometric (LC/MS)
Evaporative light scattering
Off-line detector
FTIR spiral disk monitor requires sample transfer on the germanium disk and
following scanning in FTIR instrument.
Recorder
The change in eluent detected by a detector is in the form of electronic signal,
and thus it is still not visible to our eyes. Nowadays, computer based data processor
(integrator) is more common .There are software that are specifically designed for LC
system. It provides not only data acquisition, but features like peak-fitting, base line
Dept. of Pharmaceutical Analysis 9 J.K.K. Nattraja College Of Pharmacy Degasser
The eluent used for LC analysis may contain gases such as oxygen that are
non-visible to our eyes. When gas is present in the eluent, this is detected as a noise
and causes unstable baseline. Generally used method includes sparging (bubbling of
inert gas), use of aspirator, distillation system, and/or heating and stirring. However,
the method is not convenient and also when the solvent is left for a certain time period
(e.g., during the long analysis), gas will dissolve back gradually. Degasser uses
special polymers membrane tubing to remove gases. The numerous very small pores
on the surface of the polymer tube allow the air to go through while preventing any
liquid to go though the pore. By placing this tubing under low pressure container, it
created pressure differences inside and outside the tubing (higher inside the tubing).
This difference let the dissolved gas to move through the pores and remove the gas.
Compared to classical batch type degassing, the degasser can be used on-line; it is
more convenient and efficient.
Column heater
The LC separation is often largely influenced by the column temperature. Also
for some analysis, such as sugar and organic acid, better resolutions can be obtained at
elevated temperature (50~80oC). It is also important to keep stable temperature to
obtained repeatable results even it is analyzed at around room temperature. There are
possibilities that small different of temperature causes different separation results. The
columns are generally kept inside the column oven (column heater).
Dept. of Pharmaceutical Analysis 10 J.K.K. Nattraja College Of Pharmacy INTRODUCTION TO HPLC METHOD DEVELOPMENT
Method development has following steps:
Collect information on sample, define separation goals
Need for special HPLC procedure, sample pretreatment, etc.
Choose detector and detector settings
Choose LC method, preliminary run, select best separation conditions
Optimize separation conditions
Check for problems
Quantitative calibration
Recover purified material Qualitative method
Dept. of Pharmaceutical Analysis 11 J.K.K. Nattraja College Of Pharmacy
A good method development strategy should require only as many
experimental runs as are necessary to achieve the desired final result. Finally method
development should be as simple as possible, and it should allow the use of
sophisticated tools such as computer modeling.
The important factors, which are to be taken into account to obtain reliable
quantitative analysis, are:
1. Careful sampling and sample preparation.
2. Appropriate choice of the column.
3. Choice of the operating conditions to obtain the adequate resolution of the
mixture.
4. Reliable performance of the recording and data handling systems.
5. Suitable integration/peak height measurement technique.
6. The mode of calculation best suited for the purpose.
7. Validation of the development method.
(Synder et.al 1983).
Careful sampling and sample preparation
Before beginning method development, it is need to review what is known
about the sample in order to define the goals of separation. The sample related
information that is important is summarized in below.
Number of compounds present
Chemical structure
Molecular weight of compounds
pka Values of compounds
UV spectra of compounds
Concentration range of compounds in samples of interest
Dept. of Pharmaceutical Analysis 12 J.K.K. Nattraja College Of Pharmacy
The chemical composition of the sample can provide valuable clues for the
best choice of initial conditions for an HPLC separation.
Separation Goals
The goals of HPLC separation need to be specified clearly, which include:
The use of HPLC to isolate purified sample components for spectral
identification or quantitative analysis.
It may be necessary to separate all degradants or impurities from a product for
reliable content assay.
In quantitative analysis, the required levels of accuracy and precision should be
known (a precision of + 1 to 2% is usually achievable).
Whether a signal HPLC procedure is sufficient for a raw material or one or
more different procedure are desired for formulations.
When the number of samples for analysis at one time is greater than 10, a run
time less than 20 minutes often will be important.
Sample preparation
Sample come in various forms:
Solution ready for injection.
Solutions that require dilution, buffering, addition of and internal standard
or other volumetric manipulation.
Solids must be dissolved or extracted.
Dept. of Pharmaceutical Analysis 13 J.K.K. Nattraja College Of Pharmacy
Most samples for HPLC analysis require weighing and /or volumetric dilution
before injection. Best results are often obtained when the composition of the sample
solvents is close to that of the mobile phase since this minimizes baseline upset and
other problems. Some samples require a partial separation (pretreatment) prior to
HPLC, because of need to remove interference, concentrate sample analyte or
eliminate “column killers”.
The samples may be of two types, regular or special. The regular samples are
typical mixtures of small molecules (<2000Da) that can be separated by normal
starting conditions. Whereas special samples are better separated under customized
Dept. of Pharmaceutical Analysis 14 J.K.K. Nattraja College Of Pharmacy Choice of the column
The separation of the column in HPLC is somewhat similar to the selection of
columns in G.C, in the sense that, in the adsorption and partition modes, the
separation mechanism is based on inductive forces, dipole-dipole interactions and
hydrogen bond formation. In case of ion-exchange chromatography, the separation is
Sample Requirements
Inorganic ions
Isomers
Enantiomers
Biological
Macromolecules
Detection is primary problem; use ion
chromatography.
Some isomers can be separated by reserved-phase
HPLC and are then classified as regular samples;
better separations of isomers are obtained using either
( 1)normal – phase HPLC or(2) reversed –phase
separations with cyclodextrin-silica columns.
These compounds require “chiral” conditions for their
separation.
Several factors make samples of this kind “special”,
molecular conformation, polar functionality, and a
wide range of hydrophobicity.
“Big” molecules require column packing with large
pores (>>10-nm diameters); in addition, biological
Dept. of Pharmaceutical Analysis 15 J.K.K. Nattraja College Of Pharmacy
based on the differences in the charge, size of the ions generated by the sample
molecules and the nature of ionisable group on the stationary phase. In case of size –
exclusion chromatography the selection of the column is based on the molecular
weight and size of the sample components. Selection of columns based on the method
is briefly summarized in below.
Method /Description /Columns Preferred Method
Reversed – Phase HPLC
Uses water- organic mobile phase
Columns: C18 (ODS), C8, Phenyl,
trimethylsilyl (TMS), and cyano.
Iron –pair HPLC
Uses water – organic mobile phase, a
buffer to control pH, and an ion –pair
reagent
Columns: C18 , C8, Cyano
Normal-phase HPLC
Uses mixtures of organic solvents as
mobile phase. Columns: cyano, diol,
amino, silica
First choice for most samples, especially
neutral or non-ionized compounds that
dissolve in water-organic mixtures
Acceptable choice for ionic or ionisable
compounds, especially bases or cations.
Good second choice when reserved-phase
or ion-pair HPLC is ineffective; first
choice for lipophilic samples that do not
dissolve well in water-organic mixtures;
first choice for mixtures of isomers and
Dept. of Pharmaceutical Analysis 16 J.K.K. Nattraja College Of Pharmacy Operating conditions to obtain the adequate resolution of the mixture
Most of the drug come under the category of regular samples mean typical
mixtures of small molecules (<2000Da) that can be separated using more or less
standardized starting conditions. Regular samples can be further classified as neutral
or ionic. Samples classified as ionic include acids, bases, amphoteric compounds and
organic salts. If the sample is neutral, buffers or additives are generally not required in
the mobile phase.
Acids or bases usually require the addition of a buffer to the mobile phase. For
basic or cationic samples, less acidic reserve phase columns are recommended. Based
on recommendations of the conditions, the first exploratory run is carried and then
improved systematically. On the basis of the initial exploratory run isocratic or
gradient elution can be selected as most suitable. If typical reverse-phase conditions
provided inadequate sample retention, it suggests the use of either ion-pair or normal
Phase HPLC. Alternatively, the sample may be strongly retained with 100% ACN as
mobile phase suggesting the use of non-aqueous reverse phase chromatography or
normal phase HPLC.
Method Development
One approach is to use an isocratic mobile phase of some average organic
solvent strength (50%). A better alternative is to use a very strong mobile phase first
(80 -100%) then reduce % B as necessary. The initial separation with 100% B results
in rapid elution of the entire sample, but few groups will separate. Decreasing the
solvent strength shows the rapid separation of all components with a much longer run
time, with a broadening of latter bands and reduced retention sensitivity. Goals that
Dept. of Pharmaceutical Analysis 17 J.K.K. Nattraja College Of Pharmacy
Goal Comment
Resolution Separation time Quantization Pressure Peak height Solvent consumption
Precise and rugged quantitative analysis requires that Rs be
greater than 1.5.
< 5 – 10 min is desirable for routine procedures.
≤ 2% for assay;≤5% for less-demanding analyses.
≤15% for trace analyses.
<150 bar is desirable, <200 bar is usually essential (new
column assumed).
Narrow peaks are desirable for large signal/noise rations.
Minimum mobile – phase use per run is desirable.
Separation or resolution is a primary requirement in quantitative HPLC .The
resolution (Rs) value should be maximum (Rs > 1.5) favors maximum precision.
Resolution usually degrades during the life of the column and can vary from day to
day with minor fluctuations in separation conditions. Therefore, values of Rs =2 or
greater should be the goal during method development for sample mixtures. Such
resolution will favor both improved assay precision and grater method ruggedness.
Some HPLC assays do not require base line separation of the compounds of
interest (qualitative analysis).In such case only enough separation of individual
components is required to provide characteristic retention times for peak
identification.
The time required for a separation (runtime = retention time for base band)
should be as short as possible and the total time spent on method development is
Dept. of Pharmaceutical Analysis 18 J.K.K. Nattraja College Of Pharmacy
Condition for the final HPLC method should be selected so that the operating
pressure with a new column does not exceed 170 bar (2500psi) and upper pressure
limit below 2000 psi is desirable. There are two reasons for this pressure limit, despite
the fact that most HPLC equipment can be operated at much higher pressures. First,
during the life of a column, the backpressure may rise by a factor of as much as due to
the gradual plugging of the column by particulate matter. Second, at lower pressure
(<170 bars) pumps, sample valves and especially auto samplers operate much better,
seals last longer, columns tend to plug less and system reliability is significantly
improved. For these reasons, a target pressure of less than 50% of the maximum
capability of the pump is desirable, when dealing with more challenging samples or if
the goals of separation are particularly stringent, a large number of method
development runs may be required to achieve acceptable separation.
(Skoog et.al, 2009)
Repeatable separation
As the experimental runs described above are being carried out, it is important
to confirm that each chromatogram can be repeated. When we change conditions
(mobile phase, column, and temperature) between method development experiments,
enough time must elapse for the column to come into with the new mobile phase and
temperature. Usually column equilibration is achieved after passage of 10 to 20
volumes of the new mobile phase through the column. However; this should be
confirmed by repeating the experiment under the same conditions. When constant
retention times are observed in two such back – to- back repeat experiments (+ 0.5%
or better), it can be assumed that the column is equilibrated and the experiments are
Dept. of Pharmaceutical Analysis 19 J.K.K. Nattraja College Of Pharmacy Optimization of HPLC method
During the optimization stage, the initial sets of conditions that have evolved
from the first stages of development are improved or maximized in terms of
resolution and peak shape, plate counts asymmetry, capacity factor, elution time,
detection limits, limit of quantitation and overall ability to quantify the specific
analyte of interest. Optimization of a method can follow either of two general
approaches:
Manual
Computer driven
The manual approach involves varying one experimental variable at a time, while
holding all other constant and recording changes in response. The variables might
include flow rate, mobile or stationary phase composition, temperature, detection
wavelength and pH. This approach to system is slow, time consuming and potentially
expensive. However, it may provide a much better understanding of the principles and
theory involved and of interactions of the variables.
In the second approach, computer driven automated method development,
efficiency is optimized while experimental input is minimized. This approach reduce
the time, energy and cost of all instrumental method development.
The various parameters that include to be optimized during method development are
A. Selection of mode of separation.
B. Selection of stationary phase.
C. Selection of mobile phase.
Dept. of Pharmaceutical Analysis 20 J.K.K. Nattraja College Of Pharmacy Selection of mode of separation
In reverse phase mode, the mobile phase is comparatively more polar than the
stationary phase. For the separation of polar or moderately polar compounds, the most
preferred mode is reverse phase. The nature of the analyte is the primary factor in the
selection of the mode of separation. A second factor is the nature of the matrix.
Selection of stationary phase
Selection of the column is the first and the most important step in method
development. The appropriate choice of separation column indicates three different
approaches.
Selection of separation
The particle size and nature of the column packing
The physical parameters of the column i.e. the length and the diameter some
of the important parameters considered while selecting chromatographic
columns are
Length and diameter of the column
Packing material
Shape of the particles
Size of the particles
% of carbon loading
Pore volume
Surface area
Reproducibility and reliability
End capping
In this case, the column selected had a particle size of 5µm and an internal
Dept. of Pharmaceutical Analysis 21 J.K.K. Nattraja College Of Pharmacy
the information about the analyte. Reversed phase mode of chromatography facilities
a wide range of columns like dimethyl silane (C2), butysilane (C4), octylsilane (C8),
Octadecyslane (C18), base deactivated silane (C18), BDS phenyl, Cyanopropyl (CN),
nitro, amino etc. silica based columns with different cross linking’s in the increasing
order of polarity are as follows:
<………..Non-polar………….moderately polar…………..polar……..>
C18 < C8 < C6 < Phenyl < Amino < Cyano < Silica
C18 was chosen for this study since it is most retentive one. The sample
manipulation becomes easier with this type of column. Generally longer columns
provide better separation due to higher the theoretical plate numbers. Columns with
5µm particle size give the best compromise of efficiency.
Peak shape is equally important in method development. Columns that provide
symmetrical peaks are always preferred while peaks with poor asymmetry can result
in,
Inaccurate plate number and resolution measurement
Imprecise quantitation
Degraded and undetected minor bands in the peaks tail
Poor retention reproducibility
A useful and practical measurement of peak shape is peak asymmetry
factor and peak tailing factor. Peak asymmetry is measured at 10% of full peak height
and peak tailing factor at 5%. Reproducibility of retention times and capacity factor is
Dept. of Pharmaceutical Analysis 22 J.K.K. Nattraja College Of Pharmacy
A column which gives separation of all the impurities and degradants from
each other and from analyte peak and which is rugged for variation in mobile phase
shall be selected.
Selection of mobile phase
The primary objective in selection and optimization of mobile phase is to
achieve optimum separation of all the individual impurities and degradants from each
other and from analyte peak.
In liquid chromatography, the solute retention is governed by the solute
distribution factor, which reflects the different interactions of the solute – stationary
phase, solute-mobile phase, and mobile phase-stationary phase. For a given stationary
phase, the nature and the composition of which has to be judiciously selected in order
to get appropriate and required solute retention. The mobile phase has to be adapted in
terms of elution strength (solute retention) and solvent selectivity (solute
separation).Solvent polarity is the key word in the chromatographic separations since
a polar mobile phase will give rise to low solute retention in normal phase and high
solute retention in reverse phase LC. The selectivity will be particularly altered if the
buffer pH is close to the pKa of the analytes. The following are the parameters, which
shall be taken into consideration while selecting and optimizing the mobile phase.
Buffer
pH of the buffer
Mobile phase composition
Buffers if any and its strength
Buffer and its strength play an important role in deciding the peak symmetries
Dept. of Pharmaceutical Analysis 23 J.K.K. Nattraja College Of Pharmacy
Phosphate buffers prepared using salts like KH2PO4, K2HPO4, NaH2PO4, and
Na2HPO4.
Phosphoric acid buffers prepared using H3PO4.
Acetate buffers-ammonium acetate, sodium acetate etc.
Acetic acid buffers prepared using CH2COOH.
The retention also depends on the molar strengths of the buffer-molar strength
is increasingly proportional to retention times. The strength of the buffer can be
increasing, if necessary to achieve the required separations. The solvent strength is a
measure of its ability to pull analyte from the column. It is generally controlled by the
concentration of the solvent with the highest strength. The useful pH range for
columns is 2 to 8, since siloxane linkages are cleaved below pH-2 while at pH values
above eight, silica may dissolve.
Mobile phase composition
Most chromatographic separations can be achieved by choosing the optimum
mobile phase composition. This is due to the fact that fairly large amount of
selectively can be achieved by choosing the qualitative and quantitative composition
of aqueous and organic portions. Most widely used solvents in reverse phase
chromatography are methanol and Acetonitrile. Experiments should be conducted
with mobile phases having buffers with different pH and different organic phases to
check for the best separations of analyte peak. A mobile phase which gives separation
of analyte peak
and which is rugged for variation of both aqueous and organic phase by at least +
Dept. of Pharmaceutical Analysis 24 J.K.K. Nattraja College Of Pharmacy Selection of Detector
The detector was chosen depending upon some characteristic property of the
analyte like UV absorbance, florescence, conductance, oxidation, reduction etc. The
characteristics that are to be fulfilled by a detector to be used in HPLC determination
are,
High sensitivity facilitating trace analysis
Negligible baseline noise to facilitate lower detection.
Large linear dynamic range.
Low dead volume.
Inexpensive to purchase and operate.
Pharmaceutical ingredients do not absorb all UV light equally, so that
selection of detection wavelength is important. An understanding of the UV light
absorptive properties of the organic impurities and the active pharmaceutical
ingredient is very helpful. For the greatest sensitivity ƛmax should be used. Ultra
violet wavelengths below 200nm should be avoided because detector noise increases
in this region. Higher wave lengths give greater selectivity.
Performance calculations
Carrying out system suitability experiment does the performance calculations.
System suitability experiments can be defined as tests to ensure that the method can
generate results of acceptable accuracy and precision. The requirements for system
suitability are usually developed after method development and validations have been
completed. The criteria selected will be based on the actual performance of the
method as determined during its validation. For example, if sample retention times
form part of the system suitability criteria, their variation SD can be determined
Dept. of Pharmaceutical Analysis 25 J.K.K. Nattraja College Of Pharmacy
System suitability might then require that retention times fall within a + 3 SD
range during routine performance of the method.
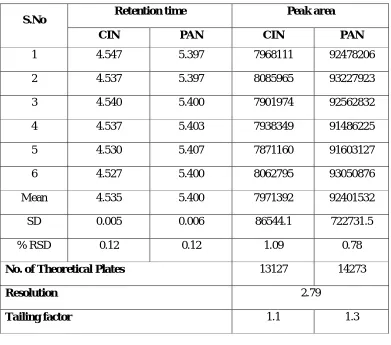
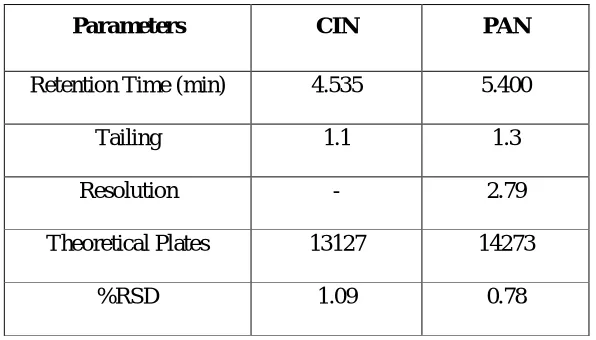
The USP (2000) defines parameters that can be used to determine system
suitability prior to analysis include plate number(n),tailing factor(T),resolution(Rs)
and relative standard deviation (RSD) of peak height or peak area for respective
injections.
The RSD of peak height or area of five injections of a standard solution is
normally accepted as one of the standard criteria .For assay method of a major
component, the RSD should typically be less than 1% for these five respective
injections.
The plate number and / or tailing factor are used if the run contains only one peak.
For chromatographic separations with more than one peak, such as an internal
standard assay or an impurity method expected to contain many peaks, some measure
of separations such as Rs is recommended. Reproducibility of tR or k value for a
specific compound also defines system performance.
The column performance can be defined in terms of column plate number. As
Dept. of Pharmaceutical Analysis 26 J.K.K. Nattraja College Of Pharmacy METHOD VALIDATION
The word “Validation’’ means “Assessment’’ of validity or action of proving
effectiveness.
Definition
ICH defines validation as “establish the documented evidence which provides a high
degree of assurance that a specific process will consistently produce a product of
predetermined specifications and quantity attributes.’’
Method validation is the process to confirm that the analytical procedure
employed for a specific test is suitable for its intended use. Method need to be
validated or revalidated.
Before their introduction into routine use
Whenever the conditions change for which the method has been validated,
e.g., instrument with different characteristics
Whenever the method is changed, and the change is outside the original scope
of the method.
Purpose of validation
Enable the scientists to communication scientifically and effectively on
technical matter.
Setting the standards of evaluation procedures for checking compliance and
taking remedial action.
Economic: Reduction in cost associated with process sampling and testing.
As quality of the product cannot always be assured by routine quality control
because of testing of statistically insignificant number of samples.
Retrospective validation is useful for trend comparison of results compliance
Dept. of Pharmaceutical Analysis 27 J.K.K. Nattraja College Of Pharmacy
Closure interaction with pharmacopoeial forum to address analytical
problems.
International pharmacopoeial harmonization particularly in respect of
impurities determination and their limits.
Method validation is completed to ensure that an analytical methodology is
accurate, specific, reproducible and rugged over the specified range that an analyte
will be analyzed. Method validation provides an assurance of reliability during normal
use, and is sometime referred to as “the process of providing documented evidence
that the method does what it is intended to do’’.
For method validation, these specifications are listed in USP chapter <1225>,and can
be referred to as the “eight steps of method validation”. as shown in figure below.
These terms are referred to as “analytical performance parameters’’. or sometimes as
“analytical figures of merit.’’
In response to this situation, one of the first harmonization projects taken up by the
ICH was the development of a guideline on the “Validation of Analytical Methods”
Definitions and Terminology. “ICH divided the “Validation characteristics”
somewhat differently, as outlined in Figure below
Dept. of Pharmaceutical Analysis 29 J.K.K. Nattraja College Of Pharmacy Method validation parameters
The developed methods were validated by following steps:
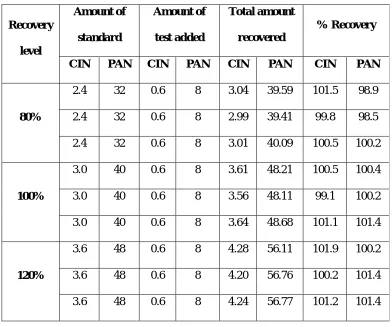
A. Accuracy
It is defined as closeness of agreement between the actual (true) value and mean
analytical value obtained by applying a test method number of times. Spike and
recovery studies are performed to measure accuracy; a known sample is added to the
excipients and the actual drug value is compared to the value found by the assay.
Accuracy is expressed as the bias or the % error between the observed value and the
true value (assay value/actual value x 100 %.)
The accuracy is acceptable if the difference between the true value and mean
measured value does not exceed the RSD values obtained for repeatability of the
method. The parameter provides information about the recovery of the drug from
sample and effect of matrix, as recoveries are likely to be excessive as well as
deficient.
Procedure:
Use a minimum of 3 spiking concentrations in the excipients solution. Prepare
two samples of each concentration. Test the 6 samples in triplicate on one run.
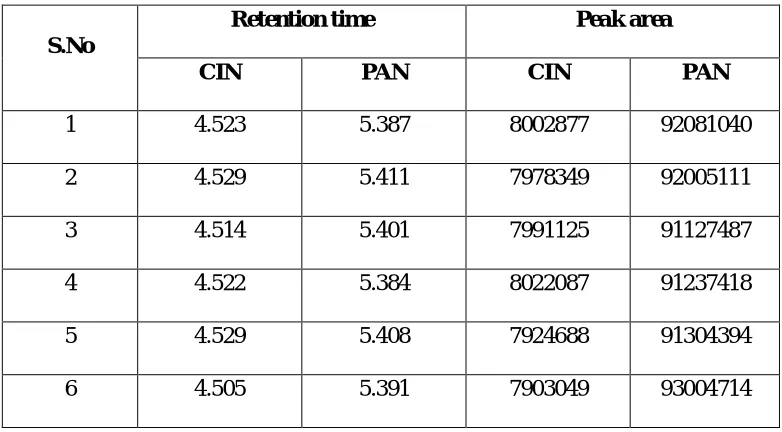
Dept. of Pharmaceutical Analysis 30 J.K.K. Nattraja College Of Pharmacy B. Precision
The precision of an analytical method is the degree of agreement among
individual test results when the method is applied repeatedly to multiple sampling of
homogenous sample.
Precision is the measure of the degree of repeatability of an analytical method
under normal operation and is normally expressed as the percent relative standard
deviation (%RSD) or coefficient of variation (% CV) for a statistically significant
number of samples. According to the ICH, precision should be performed at three
different levels: repeatability, intermediate precision, and reproducibility.
Repeatability is the result of the method operating over a short time interval under
the same conditions (or) is the % RSD of multiple determinations of a single sample
in a single test run (intra-assay precision). It should be determined from a minimum of
nine determinations covering the specified range of the procedure (for example, three
levels three repetitions each) or from a minimum of six determinations at 100% of the
test or target concentration.
Procedure:
Prepare three dilution of the sample (high/medium/low concentrations in the
range).
Test 10 replicates of each dilution of the sample.
Calculate the average and standard deviation for each point on the curve.
Calculate the RSD for each point on the curve.
Intermediate precision is the results from within lab variations due to random events
such as different days, analysts, equipment, etc. In determining intermediate
Dept. of Pharmaceutical Analysis 31 J.K.K. Nattraja College Of Pharmacy individual variables can be monitored (or) intermediate precision (also called
inter-assay precision) measure the % RSD for multiple determinations of a single sample,
controls and reagents analyzed in several assay runs in the same laboratory.
Procedure:
Prepare three dilutions of the sample (high/medium/low concentrations in the
range).
Test triplicates of each dilution of the sample inn three different assays.
Do for day- to –day variations
Do for lot-to- lot variations of assay materials
Do for technician – to – technician variation.
Calculate the average and standard deviation for each point on the curve for
each individual test.
Calculate the RSD for each point on the curve between the assay runs.
Reproducibility refers to the precision between laboratories usually in collaborative
studies and not directly relevant to assay validation in a manufacturing facility.
Documentation in support of precision studies should include the standard deviation,
Dept. of Pharmaceutical Analysis 32 J.K.K. Nattraja College Of Pharmacy
C. Specificity
It is the ability of an analytical method to assess unequivocally the analyte of
interest in the presence of components that may be expected to be present, such as
impurities, degradation products and matrix components. It is not possible to
demonstrate that an analytical procedure is specific for a particular analyte. In such
case a combination of two or more analytical procedure is recommended to achieve
the necessary level of discrimination. Lack of specificity of an individual analytical
procedure may be compensated by other supporting analytical procedures or tests.
In case of the assay, demonstration of specificity requires that the procedure
is unaffected by the presence of impurities or excipients. In practice, this can be done
by spiking the drug substances or product with appropriate levels of impurities or
excipients and demonstrating that the assay is unaffected by the presence of these
extraneous materials. If the degradation product impurity standards are unavailable,
specificity may be demonstrated by comparing the test results of samples containing
impurities or degradation products to a second well-characterized procedure e.g.,
pharmacopoeia method or other validated analytical procedure (independent
procedure). These comparisons should include samples stored under relevant stress
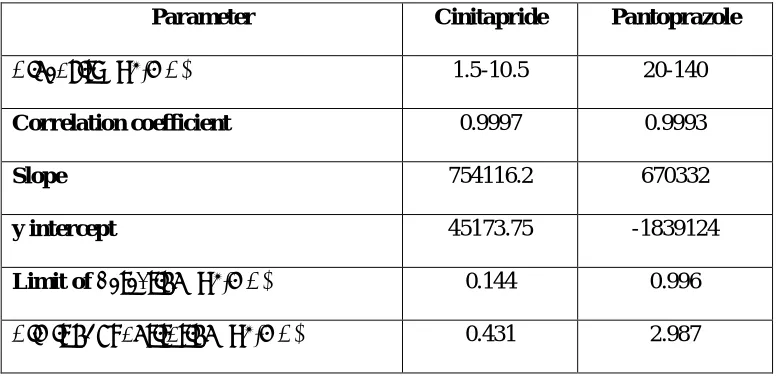
Dept. of Pharmaceutical Analysis 33 J.K.K. Nattraja College Of Pharmacy D. Limit of Detection
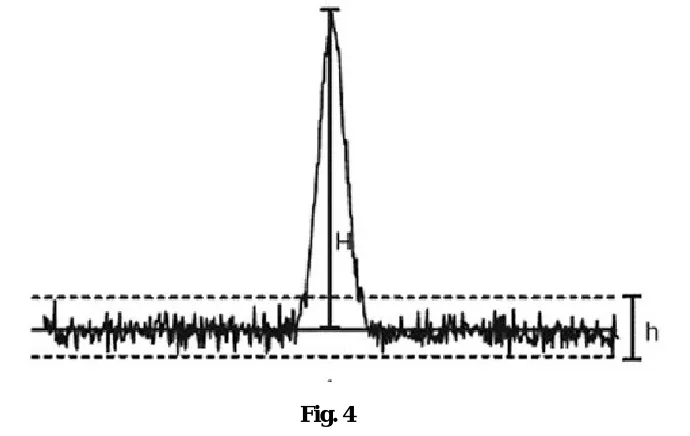
The limit of detection (LOD) is defined as the lowest concentration of an
analyte in a sample that can be detected, not quantitated. It is a limit test that specifies
whether or not an analyte is above or below a certain value. It is expressed as a
concentration at a specified signal-to- noise ratio, usually two –or three-to-one. The
ICH has recognized the signal-to-noise ratio convention, but also lists two other
options to determine LOD: visual non-instrumental methods and a means of
calculating the LOD. The method used to determine LOD should be documented and
supported, and an appropriate number of samples should be analyzed at the limit to
validate the level.
Procedure
Prepare a standard concentration of the product in the appropriate solution.
Prepare a blank solution without any sample (zero concentration).
Perform the assay at least 3 times in duplicate according to SOP.
Measure the amount present in the sample and blank.
Calculate the average for the sample and blank.
Calculate and standard deviation of the blank.
Dept. of Pharmaceutical Analysis 34 J.K.K. Nattraja College Of Pharmacy E. Limit of Quantitation
The limit of quantitation (LOQ) is defined as the lowest concentration of an
analyte in a sample that can be determined with acceptable precision and accuracy
under the stated operational conditions of the method. That is, as the LOQ
concentration level decreases, the precision increases. If better precision is required, a
higher concentration must be reported for LOQ.
Procedure:
The calculation method is again based on the standard deviation of the
response (SD) and the slope of the calibration curve (S) according t the formula:
LOQ = 10(SD/S). Again, the standard deviation of the response can be determined
based on the standard deviation of the blank, on the residual standard deviation of the
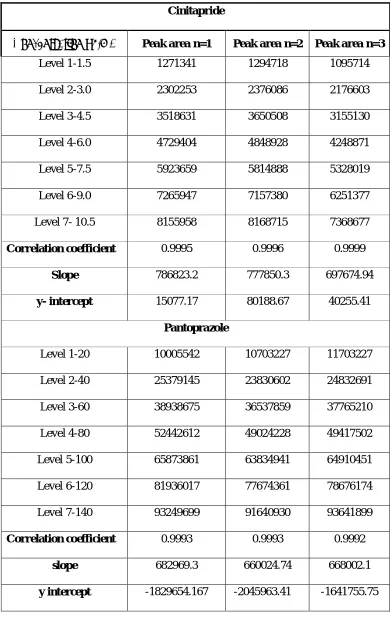
Dept. of Pharmaceutical Analysis 35 J.K.K. Nattraja College Of Pharmacy F. Linearity:
It is ability of an assay to obtain test results, which are directly proportional
to the concentration of an analyte in the sample. The determination of linearity will
Identify the range of the analytical assay. It can be measured as slope of the regression
line and its variance or as the coefficient of determination (R2) and correlation
coefficient(R).
Procedure:
Determining the coefficient of correlation R for dilutions of the sample over
the range claimed for assay.
1. Prepare 6 to 8 sample dilutions across the claimed range
2. Test each dilution in triplicate for 3 runs
3. Record expected values, actual values, and % recoveries for each run
4. Analyze each set of dilutions as a linear curve and calculate R for each assay.
Alternative:
Calculate the accuracy and precisions at each dilution. Range is the highest
and lowest concentration with satisfactory accuracy and precision. If the validation
study for an analytical test is well planed it should be possible to design the protocol
to consider many of the parameters in a single series of test, for instance selectivity
Dept. of Pharmaceutical Analysis 36 J.K.K. Nattraja College Of Pharmacy G. Range:
Range is the interval between the upper and the lower levels of analyte
(inclusive) that have been demonstrated to be determined with precision, accuracy and
linearity using the method as written. If the relationship between response and
concentration is the linear, the range may be estimated by means of a calibration
curve.
The range is normally expressed in the same units as the test results obtained
by the method. The ICH guidelines specify a minimum of five concentration levels,
along with certain minimum specified ranges. For assay the minimum specified range
is from 80-120% of the target concentration. For an impurity test, the minimum range
from the reporting level of each impurity, to 120% of the specification. (For toxic or
more potent impurities, the range should be commensurate with the controlled level).
H. Ruggedness:
Ruggedness, according to the USP, is the degree of reproducibility of the
results obtained under a variety of conditions, expressed as %RSD. The ruggedness of
an analytical method is the degree of reproducibility of test results obtained by the
analysis of the same samples under a variety of conditions such as different
laboratories, different analysts, different instruments, different lot of reagents,
Dept. of Pharmaceutical Analysis 37 J.K.K. Nattraja College Of Pharmacy I. Robustness:
ICH defines robustness as a measure of the method’s capability to remain
unaffected by small, but deliberate variations in method parameters. Robustness can
be partly assured by good system suitability specifications. The evaluation of
robustness should