promoting access to White Rose research papers
Universities of Leeds, Sheffield and York
http://eprints.whiterose.ac.uk/
This is an author produced version of a paper published in Journal of
Composites for Construction.
White Rose Research Online URL for this paper:
Published paper
El-Ghandour, A.W., Pilakoutas, K., Waldron, P. (2003) Punching shear behavior of fiber reinforced polymers reinforced concrete flat slabs: experimental study, Journal of Composites for Construction, 7 (3), pp. 258-265
Punching Shear Behavior of FRP RC Flat Slabs Part 1:
Experimental Study
Abdel Wahab El-Ghandour1, Kypros Pilakoutas2 and Peter Waldron3
Abstract: This paper presents the results of a two-phase experimental program investigating the
punching shear behavior of FRP RC flat slabs with and without CFRP shear reinforcement. In the
first phase, problems of bond slip and crack localization were identified. Decreasing the flexural
bar spacing in the second phase successfully eliminated those problems and resulted in punching
shear failure of the slabs. However, CFRP shear reinforcement was found to be inefficient in
enhancing significantly the slab capacity due to its brittleness. A model, which accurately predicts
the punching shear capacity of FRP RC slabs without shear reinforcement, is proposed and
verified. For slabs with FRP shear reinforcement, it is proposed that the concrete shear resistance
is reduced, but a strain limit of 0.0045 is recommended as maximum strain for the reinforcement.
Comparisons of the slab capacities with ACI 318-95, ACI 440-98 and BS 8110 punching shear
code equations, modified to incorporate FRP reinforcement, show either overestimated or
conservative results.
Keywords: Punching shear; Flat slabs, FRP reinforcement; GFRP, CFRP, Shear reinforcement;
Design equations
1
Researcher, The University of Sheffield (Currently Lecturer, Ain Shams University, Egypt) 2
Reader, The University of Sheffield, Department of Civil and Structural Engineering 3
INTRODUCTION
In many parts of the world, corrosion of steel reinforcement in concrete structures is a major
durability problem, leading to structural degradation and consequent costly repairs and loss of
use. In the past decade, the use of advanced composites, normally called fiber reinforced
polymers (FRP), as reinforcement for concrete structures has emerged as one of the most
promising new technologies in construction to overcome the problem of corrosion.
Some of the most important elements that suffer from corrosion in concrete structures are slabs,
as they represent the largest portion of any structure exposed to the environment. Furthermore,
using FRP reinforcement, instead of steel, may result in a reduction in the concrete cover, which,
in the case of slabs, represents a very substantial portion of the cross-section. Nevertheless, before
the introduction of FRP into the construction industry, research needs to be done for the
development of an understanding of the behavior of FRP RC flexural elements, including flat
slabs. In this respect, an extensive experimental and theoretical study was conducted at the Centre
for Cement and Concrete of the University of Sheffield to investigate the punching shear behavior
of FRP RC flat slabs [El-Ghandour (1999)]. This work was initiated during a Pan-European
project called Eurocrete (which developed the Eurocrete bar) and continues under the EU TMR
(Training and Mobility of Researchers) research network Confibrecrete. This paper presents the
experimental phase of the study including the experimental work, key experimental results and
the most important conclusions derived. Punching shear design guidelines for FRP RC flat slabs
EXPERIMENTAL PROGRAM
Testing arrangement and design of the slabs
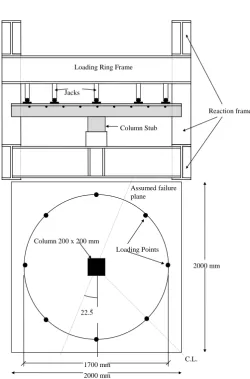
In this study, the testing arrangement adopted is similar to that used in tests undertaken previously
at Sheffield [Li (1997) and Pilakoutas et al (1999)], using an existing rig for loading flat slabs, as
shown in figure 1. The slab is supported through a column stub on a beam reacting against two
reaction ring frames. Equal point loads are applied downwards symmetrically at eight locations
on a circle of diameter 1.7 meters. The loading arrangement roughly corresponds to the circle of
contraflexure over a column in an equivalent 4 meter uniformly distributed continuous span, or a
6 meters prototype span. Eight hydraulic jacks of 100 kN capacity are used for this purpose. The
eight jacks are connected to the same pump, so that each jack applies the same load to the
specimen.
Due to the uncertainty of dealing with new materials, the flexural capacity of the slabs of the first
phase was designed not to exceed 50 % of the rig strength. For the slabs of the second phase, the
flexural and punching shear designs were carried out based on the experience gained from the
first phase of testing. The ultimate design moment of the slabs, Mdesign, was determined according
to the calculated least resistance plane of flexural failure as shown in figure 1, [El-Ghandour,
Pilakoutas and Waldron (1997, 1998 and 1999b)]. The yield line theory was not used in the
design due to the lack of potential ductility expected in the case of FRP reinforcement. All the
checks for punching shear, as well as the design of shear reinforcement were made according to
non-ferrous reinforcement proposed by the Institution of Structural Engineers in the UK (1999)
and Clarke (1996) for the Eurocrete project [Sheard et al (1997)]. These modifications are
discussed later.
Slab details
The slabs of the first phase were given codes SG1, SC1, SGS1 and SCS1, and of the second
phase SG2, SG3, SC2 and SGS2. Roughly equal areas of reinforcement were used during each
phase for Glass and Carbon FRP bars. The slab geometry and reinforcement is shown in figures 2
and 3. The slabs were reinforced with top flexural reinforcement mats of round and square
Eurocrete bars. These bars have a rough surface, which results in ‘good’ bond characteristics
[Achillides et al., (1997)], roughly equivalent to those of ribbed steel. Slabs coded SG and SC
were reinforced in flexure with glass (EFRP 45 GPa, fFRP 800 MPa) and carbon (EFRP 110 GPa,
fFRP 1400 MPa) FRP bars, respectively, but had no shear reinforcement. Slabs coded SGS and
SCS were similarly reinforced in flexure, but had carbon FRP shear reinforcement. The average
cube compressive strengths from control specimens cast along side each of the slabs are shown in
table 1.
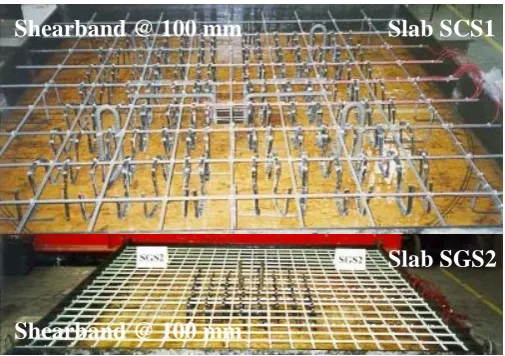
Shear reinforcement was provided by the “Shearband” system developed at Sheffield [Li and
Pilakoutas, (1995)], but using CFRP strip instead of steel. The dimensions and shape of the
“Shearband” are shown in figure 2. The distribution and positioning of the shear reinforcement
Loading and Instrumentation
One load cycle was applied at around 150 kN load, before loading to failure. This loading regime
enables the detection of any significant damage at the service load level. Extensive measurements
were made of strains on key locations on the flexural and shear reinforcements. Linear voltage
displacement (LVD) transducers were also used to measure the vertical and horizontal deflections
as well as concrete strains.
EXPERIMENTAL RESULTS
Bond slip and crack localization in slabs SG1 to SCS1
The first four slabs with low reinforcement ratio failed in a pseudo-flexural mode due to bond slip
of the flexural bars. For these slabs, it was observed that the main cracks developed directly
above the longitudinal reinforcement as shown in figure 4, partly because that is where a plane of
concrete weakness exists. These cracks were very wide due to the low modulus of elasticity of the
FRP reinforcement, as well as, the large spacing between the flexural bars. These triggered
concrete splitting at higher loads on the top of all slabs close to the column and lead to the bond
slip failure. This leads to the conclusion that one of the main advantages of using FRP
reinforcement in slabs, which is to reduce the concrete cover, can lead to splitting problems and
requires attention during design.
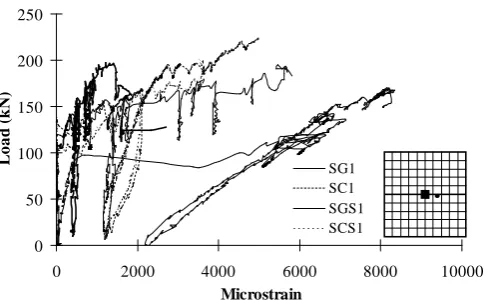
Instrumental evidence of bond slip failure was obtained from measurements which show that the
maximum strains in the flexural bars, shown in figure 5. Bond slip failure is also responsible for
the low flexural reinforcement strains in figure 5 (8300, 5000, 5800 and 3800 microstrains for
slabs SG1, SC1, SGS1 and SCS1, respectively), confirming that only relatively low stresses
compared to the strengths of the GFRP and CFRP materials were developed in the flexural
reinforcement at failure.
Considering the strains in the shear reinforcement, it was noted (El-Ghandour, 2000) that only
relatively low strains of 2600 and 4000 microstrains, corresponding to stresses of 286 and 440
MPa for slabs SGS1 and SCS1, respectively, were developed at failure. Again, this is attributed to
the bond slip failure of the slabs, which precipitated the pseudo-flexural failure and resulted in the
shear reinforcement not being fully activated. It should be noted that due to its shape, the shear
reinforcement did not contribute much in preventing bond slip. The horizontal parts of the
‘Shearband’ were too close to the flexural bars to stop the crack initiation and the vertical legs are
50 mm away and, hence, provide no vertical confinement to the bar or the splitting stresses.
Punching shear failure of slabs SG2 to SGS2
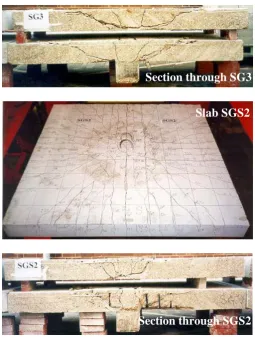
Slabs SG2 to SGS2 failed in punching shear as shown in figure 6. Although the main cracks in
these slabs developed directly above the longitudinal reinforcement, as in the first four slabs, the
smaller bar spacing resulted in a larger number of cracks with smaller widths, leading to a much
better crack distribution. This eliminated the problems of crack localization and concrete
confinement provided by the larger number of bars in slabs SG2 to SGS2 has also contributed to
this result.
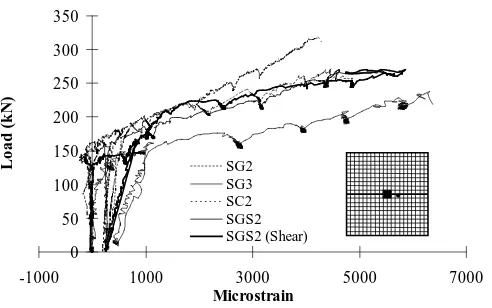
From figure 7, it can be noted again that, for all four slabs, only relatively low strains and hence
stresses, were developed in the flexural reinforcement at punching shear failure compared to the
strengths of both GFRP and CFRP materials, although bond slip was prevented. This is attributed
to the low stiffness FRP reinforcement which results in punching shear failure partly due to the
loss of aggregate interlock resistance caused by the high strains developed in the reinforcement at
low load levels. However, the strains developed in the flexural bars at punching shear failure are
far beyond the limit value of 0.0025 (yield strain for conventional steel), adopted implicitly by the
strain approach used in modified code equations.
Considering the strains in the shear reinforcement for slab SGS2 shown in figure 7 a maximum
strain of 5900 microstrains is noted in the CFRP shear reinforcement at failure, corresponding to
a stress of 649 MPa. Computing the average strain in the shear reinforcement at failure, a value of
4057 microstrains (average of strains in the punching perimeter), corresponding to an average
stress of 446 MPa, is obtained. Although bond slip of the flexural bars was successfully
prevented, it is obvious that lower stresses were developed in the shear reinforcement of this slab
at punching shear failure compared to the strength of the CFRP material. This can be attributed to
possible slippage of the shear reinforcement at failure, which can be detected by noting the strain
reduction at constant load shown in figure 7. However, it should be noted that the average strain
level of 0.0041 in the shear reinforcement is still far beyond the 0.0025 value of the yield strain of
shear reinforcement was fully activated, which means that adopting a maximum spacing of 0.75d,
as in BS 8110 (1985), is unconservative. A reduced maximum spacing of 0.5d is hence proposed
[El-Ghandour, Pilakoutas and Waldron (1999a)], in line with the ACI 318 (1995).
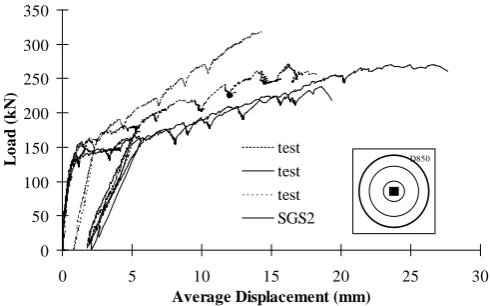
Displacement and ultimate capacity of the tested slabs
Considering figures 8 and 9 showing the load versus deflection curves at position D850 (average
displacement at a radius of 850 mm from the center), it is obvious that the post-cracking portions
of the load-deflection curves of slabs SG2 to SGS2 show a bigger increase in the load up to
failure when compared to slabs SG1 to SCS1. This can be attributed to the higher reinforcement
ratio of the former slabs. However, it should be noted that such stiffness is still much lower than
the one normally expected from conventionally RC slabs. Nevertheless, it is obvious that the
post-cracking behavior of the slabs with CFRP flexural reinforcement, is better than that of the
GFRP flexurally reinforced slabs, since carbon bars have a higher elastic modulus.
Figures 8 and 9 also show that the SG slabs demonstrate higher deflections at failure and, hence,
higher deformability than SC slabs. This is due to the lower modulus of elasticity of glass,
resulting in a reduced effective moment of inertia of the SG slabs. In addition, larger
deformability is also demonstrated in slabs with shear reinforcement compared to slabs without
shear reinforcement. In the slabs of the first phase, the slight increase in deformability is
attributed to the partial anchorage provided by the shear reinforcement to the flexural bars, which
causes bond slip failure to occur at higher loads and deflections. However, in slab SGS2, the
and SG3 without shear reinforcement, a more flexible punching shear mechanism took place, due
to the mobilization of its shear reinforcement before punching shear failure. This justifies the
lower deformability of slab SG2 with higher concrete grade when compared to slab SGS2,
although equal capacities are achieved. Finally, it should be noted that the slabs of the second
phase demonstrate lower deformability when compared to the corresponding slabs of the first
phase, as shown in figures 8 and 9. This can be attributed to the higher reinforcement ratio of the
former slabs as well as the successful prevention of bond slip failure.
In terms of capacity, figures 8 and 9 show a significant load capacity increase for slabs reinforced
with CFRP flexural bars (34.7 % load enhancement in slab SC1 over SG1 and 16.97 % and 33.76
% in slab SC2 over SG2 and SG3, respectively). This is due to the higher modulus of elasticity of
the CFRP material, which leads to a larger area of concrete in compression. A slight increase in
the capacity of the slabs reinforced with shear reinforcement is also seen. In fact, a 16.5 % and
13.92 % load enhancements are achieved in slabs SGS1 and SGS2 over SG1 and SG3,
respectively. The higher capacity of slab SGS1 over slab SG1 can be attributed to the role of the
shear reinforcement in delaying bond slip. However, in case of slab SGS2, the capacity
enhancement is due to the role of the shear reinforcement in preventing punching shear failure at
lower load levels.
The ineffectiveness of the shear reinforcement to prevent totally the punching shear failure of slab
SGS2 may be attributed to the brittleness of the CFRP material of the “Shearband”. This
brittleness is believed to result in problems not expected with a ductile material like steel. This is
stress and load can occur and all the other vertical legs can fail successively. This implies that a
higher partial safety factor or reduced material strength should be used when designing with
brittle shear reinforcement.
PREDICTIVE APPROACHES FOR CONCRETE SHEAR RESISTANCE
For determining the concrete shear resistance of FRP RC flat slabs, the strain, stress and modified
approaches are investigated. These three approaches mainly modify the actual area of the flexural
tension FRP reinforcement ‘AFRP’ into an equivalent steel area ‘As’, for use in code equations, in
order to take into account the different material properties of FRP when compared to
conventional steel. The differences between the three approaches lie in the method of calculation
of As.
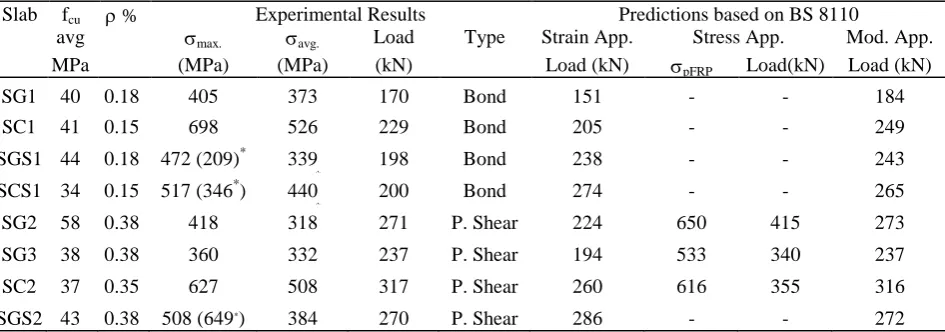
Table 1 shows the experimental, as well as, the predicted capacities of the tested slabs according
to the three approaches investigated, based on BS 8110 code equations (1985). In this table, both
maximum and average experimental stress values (σmax. and σavg.) in the flexural reinforcement at
failure are shown together with the experimental failure loads. In addition, σpFRP in the stress
approach, represents the predicted stress in the flexural reinforcement at which punching shear
failure is predicted. This represents the point of intersection of the punching shear capacity curve,
according to the stress approach, with the flexural capacity curve obtained from a simple section
Strain approach
This approach represents the basis upon which most equations calculating the concrete shear
resistance are currently modified to incorporate FRP reinforcement. The premise in this approach
is that the concrete section does not actually recognize what it is reinforced with, but only
experiences forces and strains. Hence, if the design using FRP reinforcement maintains the same
strain when the design forces are developed, then that design will by definition lead to the same
result, i.e. a safe design. For this reason, Clarke (1996) and the Institution of Structural Engineers
in the UK (1999) recommended the use of an equivalent area of steel ‘As’ in table 3.9 of BS 8110
(1985), for determining the concrete shear resistance, by multiplying the actual area of FRP
reinforcement ‘AFRP’ by the modular ratio of FRP ‘EFRP’ to that of steel ‘Es’.
The above implies that punching shear failure will occur when both the force and strain in the
flexural FRP reinforcement are roughly the same as at yield for conventional reinforcement. The
yield strain assumed for steel is 0.0025. The test results shown in table 1, for slabs SG2, SG3 and
SC2, prove that this approach is conservative and hence, leads in a lower bound solution.
Stress approach
The equal stress approach assumes that the strain in the longitudinal reinforcement does not have
an effect on the concrete shear resistance and, hence, considers just the design force (or stress) in
the FRP reinforcement to be equivalent to that of steel reinforcement. This stress-based approach
is proposed by the authors as an upper bound solution, since, when the same force is developed,
strain in steel. The modified value for the equivalent area of steel can only be obtained by finding
the stress ‘σpFRP’ at the load where the punching shear capacity curve intersects the flexural
capacity curve. Hence, the area of steel is modified by multiplying the actual area of FRP
reinforcement ‘AFRP’ by the stress ratio ‘σpFRP’ to that of steel yield stress ‘σy’ (taken as 460 MPa
for BS 8110).
Results using the stress approach are shown in table 1 for the tested FRP RC flat slabs and
confirm that this approach provides an upper limit of the punching shear capacity.
Modified approach
Having established upper and lower limits, the authors [El-Ghandour, Pilakoutas and Waldron
(1999a, b and c)] have developed a new proposal based on the experimental work of flat slab
testing carried out in this study. This approach takes partial advantage of the force that can be
developed by FRP reinforcement beyond the lower bound strain limit to a new value of 0.0045.
According to this approach, the equivalent area of steel is obtained as in the case of the strain
approach, multiplied by a correction factor φε = 1.8. Hence, the area of steel is modified by:
As = AFRP (EFRP / Es) (φε) (1)
where,
φε is a correction factor equal to εFRP / εy
εy is the yield strain of steel (taken as 0.0025 for BS 8110).
Results shown in table 1 prove that this modified approach gives accurate punching shear
capacity predictions for both GFRP and CFRP RC flat slabs which failed in punching shear.
Figures 10 and 11 show the experimental punching shear capacities of slabs SG3 and SC2,
respectively, when plotted against the experimental maximum and average stresses in the flexural
bars in the critical region, as well as the stress in the critical section predicted by section analysis.
The critical region of the tested slabs is defined as the central region around the column in which
punching shear failure occurs. The figures also show the punching shear capacity predictions
according to the three approaches, when applied to the BS 8110 code equation (1985). The strain
and modified approaches are represented by horizontal lines, since they only predict the ultimate
load. The value of stress, σpFRP, required by the stress approach is obtained by finding the point at
which the punching shear capacity curve intersects the expected flexural capacity curve. From
those figures, it is obvious that the modified approach is the most accurate one for punching shear
capacity predictions.
Verification of the modified approach
The validity of the modified approach was checked by comparisons with test results of another
study by Matthys and Taerwe (1997). Figure 12 shows comparisons of the test results with both
the strain and modified approach predictions. The results were modified to account for the higher
reinforced with CFRP NEFMAC grids, CFRP mesh with sanded surface bars and hybrid type of
FRP NEFMAC grids comprising both glass and carbon fibres. From this figure, it can be seen
that the strain approach is again conservative, while the modified approach is more accurate in
punching shear capacity predictions.
DESIGN APPROACH FOR FRP SHEAR REINFORCEMENT
The provision of shear reinforcement in RC flat slabs is also subject to strain restrictions when
using FRP reinforcement. The strain approach imposes the limit of 0.0025, which corresponds to
the strain at which steel bars normally yield.
However, by studying slab SGS2 with CFRP shear reinforcement (table 1), it is seen that
punching shear failure occurred at an average stress level of 446 MPa in the CFRP shear
reinforcement. Hence, it is proposed that the strain limit is relaxed by using a multiplication
factor of 1.8 [El-Ghandour, Pilakoutas and Waldron (1999a)]. It should be noted that the
experimental strain levels obtained from the other two slabs with shear reinforcement (SGS1 and
SCS1) cannot be used directly due to premature bond slip failure.
For slab SGS2 which failed in punching shear, table 1 shows that the strain approach capacity
prediction is only slightly above the experimental one, despite the fact that both major
assumptions of the strain approach were violated. Firstly, the experimental value of strain in the
shear reinforcement of 0.0041 exceeded the design value of 0.0025, and secondly, the strain in the
two conservative estimations for the concrete shear resistance and shear reinforcement
contribution the result still overestimates the slab capacity, this implies that the assumption that
concrete contributes fully to the punching shear resistance once a punching shear crack is formed
(i.e. adding the full concrete shear resistance to the reinforcement contribution), is not valid.
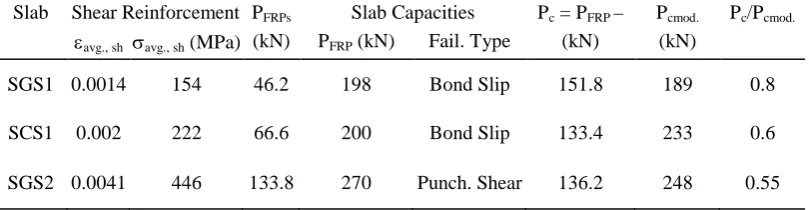
In order to determine the actual amount of concrete contribution to the punching shear resistance,
the experimental failure loads and average strains in the shear reinforcement for slabs SGS1,
SCS1 and SGS2 are used, as shown in table 2. In this table, εavg, sh and σavg, sh represent the
average experimental strains and stresses in the shear reinforcement at failure, respectively. PFRPs
represents the actual shear reinforcement contribution to the overall capacity of the slabs
according to the average experimental stresses (σavg, sh). PFRP represents the experimental failure
loads of the slabs. Pc represents the actual concrete contribution to the overall capacity of the
slabs and is calculated as the difference between PFRP and PFRPs. Pcmod represents the predicted
concrete contribution to the overall capacity of the slabs according to the modified approach,
which is capable of accurately predicting the concrete shear resistance as shown earlier.
Consequently, the ratio Pc/Pcmod represents the actual fraction of the full concrete shear resistance
that contributes to the overall slab capacity at failure.
From table 2, it can be seen that the actual fractions of the full concrete shear resistances that
contributed to the overall capacities of the tested slabs were 0.8, 0.6 and 0.55 for slabs SGS1,
SCS1 and SGS2, respectively. Hence, it is obvious that, even in slabs SGS1 and SCS1 which
failed in bond slip at loads lower than their punching shear capacities, the full concrete
lowest concrete contribution is experienced in slab SGS2, which failed in punching shear. This
seems reasonable since, in SGS2, the initiation of the punching shear cracks reduces dramatically
the concrete shear resistance. Accordingly, it is accepted that the concrete contribution to the
punching shear resistance is substantially reduced after the initiation of the major shear crack and
it is proposed that only 50 % of the concrete shear resistance can be relied upon at this stage
[El-Ghandour, Pilakoutas and Waldron (1999a)]. This is in line with the ideas of the ACI 318 (1995)
code.
By using all the above proposals, the predicted capacities of the slabs are found to be 243, 265
and 272 kN for slabs SGS1, SCS1 and SGS2, respectively, as shown in table 1. Although the first
two values are still overestimating the capacities of slabs SGS1 and SCS1, due to their bond slip
failure, the third prediction for slab SGS2, which failed in punching shear, is in perfect agreement
with the experimental value. However, further research is recommended in this area.
COMPARISON BETWEEN MODIFIED APPROACH, ACI 318-95, ACI 440-98 AND
MODIFIED ACI PREDICTIONS
According to the ACI 318-95 code (1995), the punching shear capacity of RC flat slabs without
shear reinforcement in case of a square internal column is calculated by the following equation
(minimum of ACI 318-95 code equations 11-35, 11-36 and 11-37):
fc’ is the concrete cylinder strength in MPa
c is the side length of the column in mm
d is the effective depth in mm
From equation 2, it is obvious that the above ACI 318-95 code equation totally ignores the
influence of tension flexural reinforcement when calculating the concrete shear resistance and
depends heavily on concrete strength. This is not too unreasonable in the case of steel
reinforcement, since with its high modulus of elasticity, the dominant factor determining concrete
shear resistance will be the area of concrete in compression, which remains constant as the neutral
axis depth does not vary much with normal steel reinforcement ratios. Hence, in case of steel, the
ACI 318-95 equation gives good predictions though conservative at low levels of reinforcement.
However, when using FRP reinforcement with low modulus of elasticity, the concrete shear
resistance becomes more sensitive to the reinforcement stiffness, as the neutral axis depth reduces
significantly with low reinforcement ratios. In such cases, the ACI 318-95 prediction becomes too
unconservative.
The ACI Committee 440 (1998) proposed a modification based on the strain approach to account
for the axial rigidity of FRP flexural reinforcement, as shown in equation 3:
PACI = [1.33 (fc’)0.5 (c + d) d] (EFRP / Es) (3)
where,
EFRP is the modulus of elasticity of FRP reinforcement in MPa
Figure 13 shows comparisons between the experimental capacities of the slabs which failed in
punching shear in this study and the predictions of the modified approach, the ACI 318-95 and
the ACI 440-98. This figure confirms that the ACI 318-95 code overestimates the slab capacities,
since it totally ignores the effect of the low stiffness FRP reinforcement. The figure also shows
the very conservative predictions of the ACI 440-98 equation.
It is therefore proposed to modify the ACI 440-98 equation (3) by raising the term refferring to
the reinforcement stiffness to the power of 0.33, as in the case of the BS 8110 code. Hence, the
proposed equation for use with FRP reinforcement (in case of a square internal column) is:
PACI = [1.33 (fc’)0.5 (c + d) d] (EFRP / Es)0.33 (4)
The modified ACI equation (4) predictions are checked against the results from this study and are
found to be in good agreement, as shown in Figure 13.
CONCLUSIONS
The main flexural cracks developed directly above the longitudinal reinforcement of all slabs and
led to bond splitting in the slabs with low reinforcement ratios.
The smaller flexural bar spacing in the second phase of slabs (SG2 to SGS2) eliminated the
problems of concrete splitting and prevented the bond slip failure in these slabs, which failed in
Much higher average strains are developed in the flexural reinforcement of slabs SG2 to SGS2, as
well as, in the shear reinforcement of slab SGS2, at punching shear failure, when compared to the
yield strain of conventional steel (0.0025). Hence, the strain limitations currently adopted appear
to be very conservative.
A modified strain approach for calculating the concrete shear resistance is proposed and was
demonstrated to accurately predict the punching shear capacities of FRP RC flat slabs.
The punching shear capacity of FRP RC slabs with FRP shear reinforcement is most accurately
predicted by halving the calculated concrete contribution of the modified approach. For the shear
reinforcement, the strain limit of 0.0045 is proposed. The maximum spacing for shear
reinforcement is also proposed to be 0.5d.
The ACI 318-95 code overestimates the concrete shear resistance of FRP RC flat slabs with low
reinforcement ratios. On the other hand, the ACI 440-98 equation highly underestimates the
concrete shear resistance of FRP RC flat slabs.
A modified ACI equation for calculating the concrete shear resistance is proposed based on a
stiffness correction factor (EFRP / Es)0.33 and is found to accurately predict the punching shear
AKNOWLEDGEMENT
The authors wish to acknowledge the support of the Eurocrete project for technical and material
support and the European Commission for funding the TMR Network ‘Confibrecrete’.
REFERENCES
Achillides, Z., Pilakoutas, K. and Waldron, P., ‘Bond Behaviour of FRP Bars to Concrete’
Proceedings of the Third International Symposium on Non-Metallic (FRP) Reinforcement for
Concrete Structures FRPRCS-3, Published by Japan Concrete Institute, Sapporo, October 1997,
Volume 2, pp.341-348.
ACI, ‘Building Code Requirements for Reinforced Concrete and Commentary (ACI 318-95/ACI
318R-95)’ American Concrete Institute Committee 318, Detroit, 1995, 353 pp.
ACI, ‘Provisional Design Recommendations for Concrete Reinforced with FRP Bars (ACI
440R-98)’ American Concrete Institute Committee 440, Farmington Hills, Michigan, Draft 2,
September, 1998, section 6.5.
BS 8110, ‘Code of Practice for Design and Construction’ British Standards Institution, Part 1,
British Standards Institution, London, 1985, 124pp.
Clarke, J. L., ‘Modification of Design Rules to Incorporate Non-ferrous Reinforcement’ Report
El-Ghandour, A. W., ‘Behaviour and Design of FRP RC Slabs’ PhD Thesis, Department of Civil
and Structural Engineering, University of Sheffield, UK, October 1999, 285 pp.
El-Ghandour, A. W., Pilakoutas, K. and Waldron, P., ‘Behaviour of FRP Reinforced Concrete
Flat Slabs’ Proceedings of the Third International Symposium on Non-Metallic (FRP)
Reinforcement for Concrete Structures FRPRCS-3, Published by Japan Concrete Institute,
Sapporo, October 1997, Volume 2, pp.567-574.
El-Ghandour, A. W., Pilakoutas, K. and Waldron, P., ‘Behaviour of FRP Flat Slabs with CFRP
Shear Reinforcement’ Proceedings of the 8th European Conference on Composite Materials
ECCM-8, Edited by Crivelli Visconti, I., Naples, Italy, June 1998, Volume 2, pp.399-406.
El-Ghandour, A. W., Pilakoutas, K. and Waldron, P., ‘Punching Shear Design of FRP Reinforced
Concrete Flat Slabs’ TMR European Research Network ‘ConFibreCrete’ Seminar on Design
Guidelines for FRP Reinforced Concrete Structures, Sintra, Portugal, January 18, 1999a.
El-Ghandour, A. W., Pilakoutas, K. and Waldron, P., ‘Development of Design Guidelines for
FRP Reinforced Concrete’ Proceedings of the Second Middle East Symposium on Structural
Composites for Infrastructure Applications, Edited by Hosny, A., Mahfouz, I. and Sarkani, S.,
Hurghada, Egypt, April 1999b, pp. 200 - 213.
El-Ghandour, A. W., Pilakoutas, K. and Waldron, P., ‘New Approach for the Punching Shear
on Fibre Reinforced Polymer Reinforcement for Reinforced Concrete Structures, FRPRCS-4,
Baltimore, Maryland, USA, 31 October to 5 November, 1999c, pp. 135 - 144.
Institution of Structural Engineers, ‘Interim Guidance on the Design of Reinforced Concrete
Structures Using Fibre Composite Reinforcement’ The Institution of Structural Engineers,
London, UK, August 1999.
Li, X., ‘Punching Shear Resistance of RC Flat Slabs’ PhD Thesis, Department of Civil and
Structural Engineering, the University of Sheffield, UK, June 1997, 279 pp.
Li, X. and Pilakoutas, K., ‘Alternative Shear Reinforcement in Flat Slabs’ Report No.
CCC/94/0030A, Centre for Cement and Concrete, Department of Civil and Structural
Engineering, the University of Sheffield, March, 1995, 42 pp.
Matthys, S. and Taerwe, L., ‘Punching Tests on Concrete Slabs Reinforced with FRP Grids’
Proceedings of the 3rd International Symposium on Non-Metallic (FRP) Reinforcement for
Concrete Structures (FRPRCS - 3), Published by Japan Concrete Institute, Sapporo, Japan,
October 14 - 16, 1997, Volume 2, pp. 559 - 566.
Pilakoutas, K. and Li, X., ‘Alternative Shear Reinforcement for Reinforced Concrete Flat Slabs’
Journal of Structural Engineering, American Society of Civil Engineers, ASCE, December, 1999.
Sheard, P. A., Clarke, J. L., Dill, M. J., Hammersley, G. P. and Richardson, D. M., ‘Eurocrete -
the Third International Symposium on Non-Metallic (FRP) Reinforcement for Concrete
LIST OF TABLES
Table 1 Experimental and predicted punching shear capacities
Table 1 Experimental and predicted punching shear capacities
Slab fcu ρ % Experimental Results Predictions based on BS 8110
avg σmax. σavg. Load Type Strain App. Stress App. Mod. App.
MPa (MPa) (MPa) (kN) Load (kN) σpFRP Load(kN) Load (kN)
SG1 40 0.18 405 373 170 Bond 151 - - 184
SC1 41 0.15 698 526 229 Bond 205 - - 249
SGS1 44 0.18 472 (209)* 339
*
198 Bond 238 - - 243
SCS1 34 0.15 517 (346*) 440
*
200 Bond 274 - - 265
SG2 58 0.38 418 318 271 P. Shear 224 650 415 273
SG3 38 0.38 360 332 237 P. Shear 194 533 340 237
SC2 37 0.35 627 508 317 P. Shear 260 616 355 316
SGS2 43 0.38 508 (649*) 384 270 P. Shear 286 - - 272
Table 2 Concrete contribution to the slab capacity
Slab Shear Reinforcement PFRPs Slab Capacities Pc = PFRP – Pcmod. Pc/Pcmod. εavg., sh σavg., sh (MPa) (kN) PFRP (kN) Fail. Type (kN) (kN)
SGS1 0.0014 154 46.2 198 Bond Slip 151.8 189 0.8
SCS1 0.002 222 66.6 200 Bond Slip 133.4 233 0.6
LIST OF FIGURES
Reaction frame Loading Ring Frame
Jacks
Column Stub
22.5 o
Loading Points
1700 mm 2000 mm
2000 mm Column 200 x 200 mm
[image:28.612.219.470.103.483.2]C.L. Assumed failure plane
2000 mm
200 mm
200 mm
9 CFRP bars 8.5 @ 200 mm
175 mm 11 GFRP bars 8.5 @ 200 mm
or
Phase one slabs SG1 to SCS1
2000 mm
200 mm
200 mm
21 GFRP bars 8 x 8 mm @ 100 mm
or
19 CFRP bars 8 x 8 mm @ 100 mm
175 mm
Phase two slabs SG2 to SGS2
Concrete cover 25 mm
135 mm
50 mm
R = 25 mm
1 mm Width = 10 mm
CFRP ‘Shearband’
Figure 3 Distribution of shear reinforcement in SGS and SCS slabs Slab SGS2
Shearband @ 100 mm
0 50 100 150 200 250
0 2000 4000 6000 8000 10000
Microstrain
Lo
a
d
(k
N
)
[image:32.612.187.431.73.227.2]SG1 SC1 SGS1 SCS1
Figure 6 Punching shear failure of the slabs of the second phase Section through SG3
Slab SGS2
0 50 100 150 200 250 300 350
-1000 1000 3000 5000 7000
Microstrain
Lo
a
d
(k
N
)
[image:34.612.186.432.72.226.2]SG2 SG3 SC2 SGS2 SGS2 (Shear)
0 50 100 150 200 250
0 10 20 30 40 50 60
Average Displacement (mm)
Lo
a
d
(k
N
)
SG1 test SGS1 SCS1
[image:35.612.187.429.74.228.2]D850
0 50 100 150 200 250 300 350
0 5 10 15 20 25 30
Average Displacement (mm)
Lo
a
d
(k
N
)
test test test SGS2
[image:36.612.184.430.75.228.2]D850
0 50 100 150 200 250 300 350 400
0 100 200 300 400 500 600 700 800 900
Maximum Normal Stress in Flexural Bars (MPa)
L
oa
d (
kN
)
FRP Re-bar Stress in Critical Region: Maximum (Experimental)
Average (Experimental) Predicted (Analysis)
Strain Approach Capacity Modified Approach Capacity Punching Shear Capacity Envelope
(Stress Approach) Stress Approach Capacity
0 50 100 150 200 250 300 350 400
0 100 200 300 400 500 600 700 800
Maximum Normal Stress in Flexural Bars (MPa)
L
oa
d (
kN
)
FRP Re-bar Stress in Critical Region: Maximum (Experimental)
Average (Experimental) Predicted (Analysis) Stress Approach Capacity
Modified Approach Capacity
Strain Approach Capacity Punching Shear
Capacity Envelope (Stress Approach)
0 50 100 150 200 250 300 350
0 50 100 150 200 250 300 350
Pult. Experimental (kN)
[image:39.612.189.417.75.209.2]P ul t. pr edi ct ed ( kN ) Series C Series CS Series H Series C Series CS Series H Strain Approach Modified Approach
0 50 100 150 200 250 300 350 400 450 500
10 20 30 40 50
Concrete Cylinder Strength (MPa)
P u lt. (k N ) Mod. Glass Mod. Carbon ACI 318-95
ACI 440-98 Glass
ACI 440-98 Carbon
Mod. ACI Glass Mod. ACI Carbon
SG2 Exp. SG3 Exp.
SC2 Exp.
LIST OF FIGURE LEGENDS
Figure 1 Slab geometry and schematic representation of test set-up
Figure 2 Slab layout and reinforcement details in the tested slabs
Figure 3 Distribution of shear reinforcement in SGS and SCS slabs
Figure 4 Crack localisation in the slabs of the first phase
Figure 5 Load-reinforcement strain curves for phase one slabs
Figure 6 Punching shear failure of the slabs of the second phase
Figure 7 Load-reinforcement strain curves for phase two slabs
Figure 8 Average load-deflection curves at location D850 for phase one slabs
Figure 9 Average load-deflection curves at location D850 for phase two slabs
Figure 10 Experimental and predicted capacities of slab SG3
Figure 11 Experimental and predicted capacities of slab SC2
Figure 12 Strain and modified approaches predictions for slabs tested by Matthys et al. (1997)