* * *
• • • •
L
eurostat
LABOUR FORCE SURVEY
eurostat
STATISTISCHES AMT DER EUROPÄISCHEN GEMEINSCHAFTEN STATISTICAL OFFICE OF THE EUROPEAN COMMUNITIES OFFICE STATISTIQUE DES COMMUNAUTÉS EUROPÉENNES L2920 Luxembourg — Tél. (352) 43 011
-Rue de la Loi 200, B-1049 Bruxelles — Tél.
- Télex COMEUR LU 3423 (32-2) 299 11 11
Eurostat hat die Aufgabe, den Informa-tionsbedarf der Kommission und aller am Aufbau des Binnenmarktes Beteiligten mit Hilfe des europäischen statistischen Systems zu decken.
Um der Öffentlichkeit die große Menge an verfügbaren Daten zugänglich zu machen und Benutzern die Orientierung zu
erleichtern, werden zwei Arten von Publi-kationen angeboten: Statistische Doku-mente und Veröflentlichungen.
Statistische Dokumente sind für den Fachmann konzipiert und enthalten das ausführliche Datenmaterial: Bezugs-daten, bei denen die Konzepte allgemein bekannt, standardisiert und wissenschaft-lich fundiert sind. Diese Daten werden in einer sehr tiefen Gliederung dargeboten. Die Statistischen Dokumente wenden sich an Fachleute, die in der.Lage sind, selbständig die benötigten Daten aus der Fülle des dargebotenen Materials auszu-wählen. Diese Daten sind in gedruckter Form und/oder auf Diskette, Magnet-band, CD-ROM verfügbar. Statistische Dokumente unterscheiden sich auch optisch von anderen Veröffentlichungen durch den mit einer stilisierten Graphik versehenen weißen Einband.
Veröffentlichungen wenden sich an eine ganz bestimmte Zielgruppe, wie zum Beispiel an den Bildungsbereich oder an Entscheidungsträger in Politik und Ver-waltung. Sie enthalten ausgewählte und auf die Bedürfnisse einer Zielgruppe abgestellte und kommentierte Informa-tionen. Eurostat übernimmt hier also eine Art Beraterrolle.
Für einen breiteren Benutzerkreis gibt Eurostat Jahrbücher und periodische Veröffentlichungen heraus. Diese enthal-ten statistische Ergebnisse für eine erste Analyse sowie Hinweise auf weiteres Datenmaterial für vertiefende Unter-suchungen. Diese Veröffentlichungen werden in gedruckter Form und in Daten-banken angeboten, die in Menütechnik zugänglich sind.
Um Benutzern die Datensuche zu erleich-tern, hat Eurostat Themenkreise, d. h.
It is Eurostats responsibility to use the European statistical system to meet the requirements of the Commission and all parties involved in the development of the single market.
To ensure that the vast quantity of ac-cessible data is made widely available, and to help each user make proper use of this information, Eurostat has set up two main categories of document: statistical documents and publications.
The statistical document is aimed at spe-cialists and provides the most complete sets of data: reference data where the methodology is well-established, stand-ardised, uniform and scientific. These data are presented in great detail. The statistical document is intended for ex-perts who are capable of using their own means to seek out what they require. The information is provided on paper and/or on diskette, magnetic tape, CD-ROM. The white cover sheet bears a stylised motif which distinguishes the statistical docu-ment from other publications.
The publications proper tend to be com-piled for a well-defined and targeted public, such as educational circles or political and administrative decision-makers. The information in these docu-ments is selected, sorted and annotated to suit the target public. In this instance, therefore, Eurostat works in an advisory capacity.
Where the readership is wider and less well-defined, Eurostat provides the infor-mation required for an initial analysis, such as yearbooks and periodicals which contain data permitting more in-depth studies. These publications are available on paper or in videotext databases. To help the user focus his research, Eurostat has created 'themes', i.e. subject classifications. The statistical documents and publications are listed by series: for example, yearbooks, short-term trends or methodology in order to facilitate access to the statistical data.
Y. Franchet Director-General
Pour établir, évaluer ou apprécier les dif-férentes politiques communautaires, la Commission européenne a besoin d'infor-mations.
Eurostat a pour mission, à travers le sys-tème statistique européen, de répondre aux besoins de la Commission et de l'en-semble des personnes impliquées dans le développement du marché unique. Pour mettre à la disposition de tous l'im-portante quantité de données accessibles et faire en sorte que chacun puisse s'orienter correctement dans cet ensem-ble, deux grandes catégories de docu-ments ont été créées: les docudocu-ments statistiques et les publications.
Le document statistique s'adresse aux spécialistes. Il fournit les données les plus complètes: données de référence où la méthodologie est bien connue, standar-disée, normalisée et scientifique. Ces données sont présentées à un niveau très détaillé. Le document statistique est des-tiné aux experts capables de rechercher, par leurs propres moyens, les données requises. Les informations sont alors disponibles sur papier et/ou sur disquette, bande magnétique, CD-ROM. La couver-ture blanche ornée d'un graphisme stylisé démarque le document statistique des autres publications.
Les publications proprement dites peu-vent, elles, être réalisées pour un public bien déterminé, ciblé, par exemple l'enseignement ou les décideurs politi-ques ou administratifs. Des informations sélectionnées, triées et commentées en fonction de ce public lui sont apportées. Eurostat joue, dès lors, le rôle de conseil-ler.
LABOUR FORCE SURVEY
A great deal of additional information on the European Union is available on the Internet. It can be accessed through the Europa server (http://europa.eu.int).
Preface
This publication presents the detailed results of the 1997 European Labour Force Survey conducted in the Member
States of the European Union in accordance with Council Regulation (EEC) No. 3711/91 of 16 December 1991.
This survey was based upon the International Labour Office guidelines on labour force statistics as adopted by the
13th International Conference of Labour Statisticians in 1982 and subsequently confirmed at the 14th and 15th
conferences in 1987 and 1993.
Information about the content and methodology of the survey as implemented from 1992 onwards may be found in
the Eurostat publication The European Union Labour Force Survey : Methods and Definitions - 1996. Some
clarification and updates to the definitions as given there are provided below in the explanatory notes to this
publication.
Eurostat wishes to thank all those involved at the national statistical offices for their contribution to the success of
the survey in preparing the questionnaires, selecting the samples, conducting the interviews and transmitting the
data to Eurostat. The preparation of this publication was the responsibility of the unit Labour Market at Eurostat.
Signs and abbreviations
Zero or not available
Not zero but extremely unreliable
() Unreliable data due to small size of the sample
EU-15 All 15 member States of the European Union
Bibliographical note
Main publications of 1997 national survey results
Belgique/België
Enquête par sondage sur les forces de travail, INS 1997
Steekproefenquête naarde beroepsbevolking, NIS 1997
Danmark
Arbejdsstyrkeundersøgelsen, Statistiske efterretninger, Danmarks Statistik
B.R. Deutschland
Bevölkerung und Erwerbstätigkeit, Fachserie 1, Reihe 4.1,Statistisches Bundesamt
Greece
Labour force survey, National Statistical Service of Greece
España
Encuesta de población activa Principales resultados y resultados detallados (trimestral),
Tablas anuales, INE
France
Enquête sur l'emploi 1997, les collections de l'Insee
Ireland
Labour force survey 1997, Central Statistics Office
Italia
Rilevazione trimestrale sulle forze di lavoro, Istat
Annuario statistico italiano, Istat
Luxembourg
Bulletin du Statec
Nederland
Enquête beroepsbevolking 1997, CBS
Austria
Mikrozensus Jahresergebnisse 1997, Stat
Portugal
Inquérito ao emprego 1997, INE
Finlande
Table of contents
Page
Explanatory notes 9
Population and activity
Graphs
1 Activity by sex and age-groups, 1997 16
2 Employment by nationality -1997 19
3 Employment rate by nationality EU-15 -1997 19
Tables
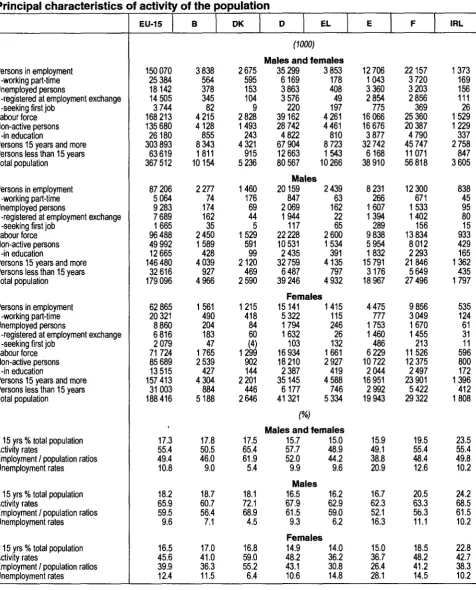
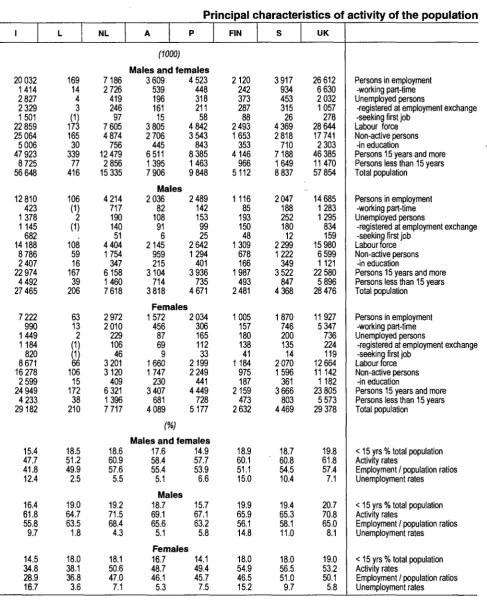
001 Principal characteristics of activity of the population (1,000/%) 20
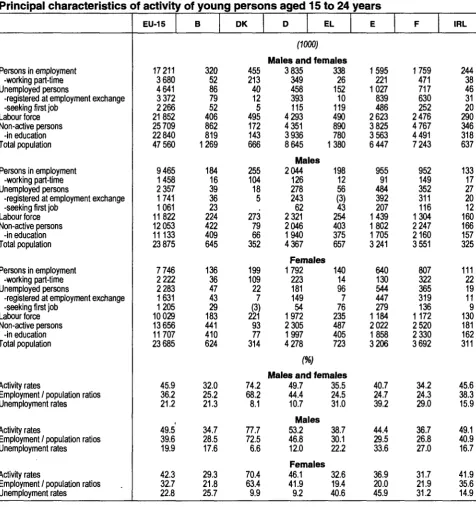
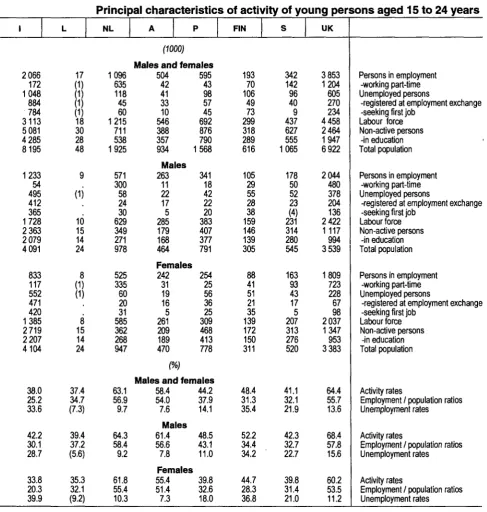
002 Principal characteristics of activity of young persons aged 15 to 24 years (1,000/%) 22
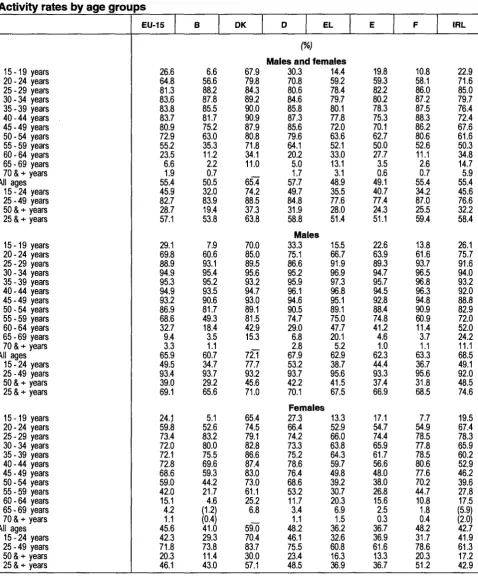
003 Activity rates by age groups (%) 24
004 Activity rates by marital status and broad age groups (%) 26
005 Activity rates by nationality and broad age groups (%) 28
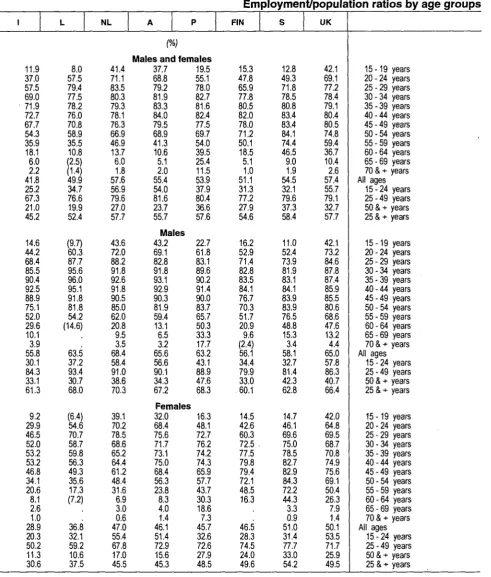
006 Employment/population ratios by age groups (%) 30
007 Employment/population ratios by marital status and broad age groups (%) 32
008 Unemployment rates by age groups (%) 34
009 Unemployment rates by marital status and broad age groups (%) 36
010 Total population by age groups (1,000) 38
011 Total population by age groups (%) 40
012 Non-national population by broad age groups (1,000) 42
013 Non-national population by broad age groups (%) 44
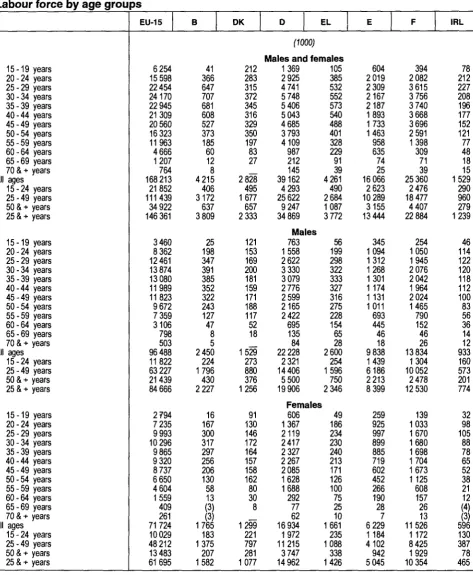
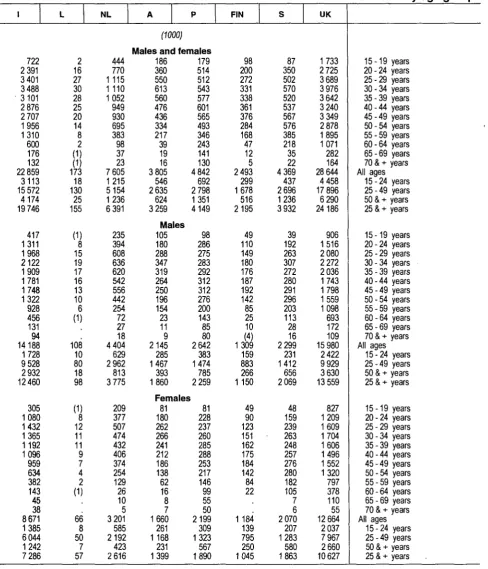
014 Labourforce by age groups (1,000) 46
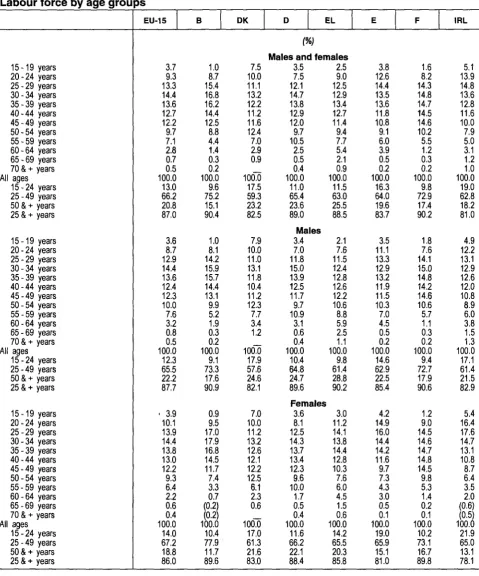
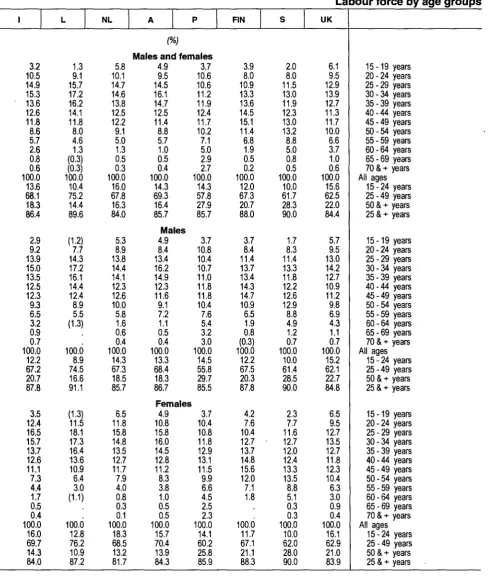
015 Labour force by age groups (%) 48
016 Labourforce by nationality and broad age groups (1,000) 50
017 Labour force by nationality and broad age groups (%) 52
018 Persons in employment by age groups (1,000) 54
019 Persons in employment by age groups (%) 56
020 Unemployed persons by age groups (1,000) 58
021 Unemployed persons by age groups (%) 60
022 Inactive persons by age groups (1,000) 62
023 Inactive persons by age groups (%) 64
024 Young persons aged 15 to 24 years in education - rate of participation in education (1,000) 66
025 Unemployment rates of persons aged 25 to 59 years by educational attainment level (%) 68
026 Population aged 15 and over by degree of urbanisation (1,000) 70
027 Population aged 15 and over by degree of urbanisation (%) 72
028 Unemployment rates, employment/population ratios, and activity rates by degree of
urbanisation (%) 74
029 Employment status by educational attainment level of persons aged 25 to 59 years (1,000) 76
030 Employment status by educational attainment level of persons aged 25 to 59 years (%) 78
031 Educational attainment level by employment status of persons aged 25 to 59 years (%) 80
Employment
13 Females employees by type of employment -1997 87
Tables
032 Persons in employment by professional status (1,000) 88
033 Persons in employment by sector of activity (1,000) 88
034 Persons in employment by professional status (%) 90
035 Persons in employment by sector of activity (%) 90
036 Persons in employment by professional status and sector of activity (1,000) 92
037 Persons in employment by professional status and sector of activity (%) 94
038 Persons in employment by sector of activity and professional status (1,000) 96
039 Persons in employment by sector of activity and professional status (%) 98
040 Persons in employment by economic activity (NACE Rev.1) (1,000) 100
041 Persons in employment by economic activity (NACE Rev.1) (%) 102
042 Employees by economic activity (NACE Rev.1) (1,000) 104
043 Employees by economic activity (NACE Rev.1) (%) 106
044 Persons in employment by occupation (ISCO-88(COM)) (1,000) 108
045 Persons in employment by occupation (ISCO-88(COM)) (%) 110
046 Employees by occupation (ISCO-88(COM)) (1,000)
112
047 Employees by occupation (ISCO-88(COM)) (%) 114
048 Persons working full-time/part-time by broad age groups (1,000) 116
049 Persons working full-time/part-time by broad age groups (%) 118
050 Persons in employment by professional status and full-time/part-time breakdown (1,000) 120
051 Persons in employment by professional status and full-time/part-time breakdown (%) 122
052 Persons in employment by sector of activity and full-time/part-time breakdown (1,000)
124
053 Persons in employment by sector of activity and full-time/part-time breakdown (%) 126
054 Employees by sector of activity and full-time/part-time breakdown (1,000)
128
055 Employees by sector of activity and full-time/part-time breakdown (%) 130
056 Non-employees by sector of activity and full-time/part-time breakdown (1,000) 132
057 Non-employees by sector of activity and full-time/part-time breakdown (%) 134
058 Married women - sector of activity by full-time/part/time breakdown (1,000 / %) 136
059 Persons working part-time by reason (1,000/%) 138
060 Persons working shift work, in the evening or at night (1,000) 140
061 Persons working shift work, in the evening or at night (%) 142
062 Persons working on Saturday, Sunday or from home (1,000) 144
063 Persons working on Saturday, Sunday or from home(%) 146
064 Employees with a temporary job by reason (1,000 / %) 148
065 Reasons for total absence from work during the reference week (1,000/ %) 150
066 Percentage of employees aged 25 to 59 receiving training during the
previous four weeks by sector of activity (NACE Rev.1) (1,000/%) 152
067 Persons in employment with more than one job by professional status of the second job (1,000) . 154
068 Persons in employment with more than one job by sector of activity of the second job (1,000)
154
069 Persons in employment with more than one job by professional status of the second job (%) 156
070 Persons in employment with more than one job by sector of activity of the second job (%) 156
Working time
Graphs
12 Average hours usually worked per week - Males -1997 160
13 Average hours usually worked per week - Females -1997 160
21 Average number of hours usually worked per week by occupation
(employees working full-time) - EU-15 -1997 163
Tables
071 Persons in employment - comparison of average usual and average
actual number of hours worked by sector of activity (hrs) 164
072 Employees - average hours usually worked per week by economic
activity (NACE Rev.1) (hrs) 166
073 Employees working full-time - average hours usually worked per week by
economic activity (NACE Rev.1) (hrs) 168
074 Employees working part-time - average hours usually worked per week by
economic activity (hrs) 170
075 Employees - average hours usually worked per week by occupation (ISCO-88(COM)) (hrs) 172
076 Persons in full-time employment - groups of hours usually worked per week (%) 174
077 Persons in full-time employment - groups of hours actually worked during
the reference week (%) 176
078 Persons in part-time employment - groups of hours usually worked per week (%) 178
079 Persons in part-time employment - groups of hours actually worked during
the reference week (%) 180
080 Employees in industry working full-time - groups of hours usually worked per week
by economic activity (NACE Rev.1) (%) 182
081 Employees in services working full-time - groups of hours usually worked per week
by economic activity (NACE Rev.1) (%) 186
082 Employees in industry and services working part-time - groups of hours usually
worked per week (%) 190
083 Persons in full-time employment - detailed groups of hours actually worked during the
reference week (%) 192
084 Persons in full-time employment - detailed groups of hours usually worked per week
(%) 194
085 Persons in full/part-time employment - differences between usual and actual hours
(1,000) 196
086 Persons in full/part-time employment - differences between usual and actual hours (%) 198
087 Persons in employment having worked during the reference week - reasons for
differences between usual and actual hours (1,000) 200
088 Persons in employment having worked during the reference week reasons for
differences between usual and actual hours (%) 202
089 Persons in employment having worked during the reference week - average difference
in hours between usual and actual hours (hrs) 204
090 Persons in employment with a second job - number of persons and average hours
actually worked in second job during the reference week (1,000/ hours) 206
091 Persons in employment with a second job - type of second job by hours
actually worked during the reference week (%) 208
Unemployment and search for work
Graphs
22 Inactive persons by reasons of not seeking employment, EU-15, 1997 212
23 Unemployed for less than one year by previous economic activity, EU-15, 1997 212
097 Detailed duration of unemployment (%) 226
098 Duration of unemployment for the main groups of unemployed (1,000) 228
099 Duration of unemployment for the main groups of unemployed (%) 230
100 Duration of unemployment by broad age groups (1,000) 234
101 Duration of unemployment by broad age groups (%) 234
102 Unemployed having lost/left job as employee due to economic reasons by
previous economic activity (NACE Rev.1) (1,000) 236
103 Unemployed having lost/left job as employee due to economic reasons by
previous economic activity (NACE Rev.1) (%) 238
104 Unemployed having lost/left job as employee due to economic reasons by
occupation of last job (ISCO-88(COM)) (1,000) 240
105 Unemployed having lost/left job as employee due to economic reasons by
occupation of last job (ISCO-88(COM)) (%) 242
106 Unemployed seeking employment by broad age group and type of
employment sought (1,000) 244
107 Unemployed seeking employment by broad age group and type of
employment sought (%) 246
108 Unemployed seeking employment by method of job search (1,000) 248
109 Unemployed seeking employment by method of job search (%) 250
110 Inactive persons - reasons for not seeking employment (1,000) 252
111 Inactive persons - reasons for not seeking employment (%) 254
112 Persons having a job and seeking another by broad age groups and reasons (1,000) 256
113 Persons having a job and seeking another by broad age groups and reasons (%) 258
Households
Graphs
25 Composition of private households - EU-15 -1997 262
26 Households of one person by sex and age-EU-15-1997 262
27 Activity rates for women between 20 and 45 years by the number of children -1997 263
Tables
114 Number of private households by household type (children under 15) (1,000/%) 264
115 Activity rates and unemployment rates by household type (children under 15) (%) 266
116 Number of private households by age of youngest person in the household (1,000) 268
117 Number of private households by age of youngest person in the household (%) 268
118 Unemployed by relationship to head of household (1,000) 270
119 Unemployed by relationship to head of household (%) 270
120 Duration of unemployment by relationship to head of household (1,000) 274
Explanatory notes
Organization
of
the survey
The content of the European Labour Force Survey is
determined by the Statistical Office of the European
Union (Eurostat), together with the national experts of
the Member States. An agreed coding scheme is
then used by the Member States in transmitting the
data.
A summary presentation of the type of information
covered by the survey was included in Article 4 of
Council Regulation (EEC) N° 3711/91 which formed
the legal basis for surveys from 1992 onwards.
The national statistical institutes are responsible for
selecting the sample, preparing the questionnaires,
conducting the direct interviews among households,
and forwarding the results to Eurostat in accordance
with the standard coding scheme.
Eurostat devises the programme for analysing the
results and is responsible for processing and
disseminating the information forwarded by the
national institutes.
A detailed description of the sampling methods, the
adjustment procedures, the definitions and the
common Community coding currently used in the
labour force survey is presented in the publication
The European Union Labour Force Survey - Methods
and definitions, 1996.
Reference period
The labour force characteristics of each person
interviewed refer to his situation in a particular
reference week.
As a general rule the reference week should be a
normal week in spring excluding bank holidays. For
countries using a fixed week such as Italy, this
requirement is easy to fulfil. In some countries,
however, the reference week is the one preceding the
week of the interview and, as the survey extends
over a period of time, the mobile reference week
method is used. In this case it cannot be guaranteed
that the reference week represents a normal week.
For the 1997 survey, the distribution of the reference
weeks is presented in table 1.
Field
of
survey
The survey is intended to cover the whole of the
resident population, i.e. all persons whose usual
place of residence is in the territory of the 15 Member
States of the EU.
For technical and methodological reasons, however,
it is not possible in all the countries to include the
field of survey, the Community results are compiled
on the basis of the population of private households
only. This comprises all persons living in the
households surveyed during the reference week. This
definition also includes persons absent from the
household for short periods due to studies, holidays,
illness, business trips, etc.
The sampling method was designed separately by
each national statistical office in the light of the
experience and practices of the individual Member
States. The design adopted in each case was
required by the Regulation to ensure a certain
minimum reliability at regional level, expressed as
follows :
The sampling plan shall guarantee that for
characteristics relating to 5% of the population of
working age the relative standard error at NUTS II
level (or equivalent) does not exceed 8%, assuming
the design effect for the variable 'unemployment.'
(Council Regulation (EEC) No. 3711/91, Article 3.2)
The number of private households for which data was
finally available from each Member State is
presented in table 1.
Reliability of the results
Sampling error
As with any sample survey, the results of the labour
force survey are subject to sampling error. It is almost
certain that somewhat different figures would have
been obtained if a complete census had been carried
out using the same questionnaires, interviewers,
supervisors, data-processing techniques, etc. as
those used in the labour force survey. This difference
is known as the sampling error of the estimate.
In a given sample, there are basically two factors
which account for the relative magnitude of the
sampling error of a characteristic: the frequency with
which it occurs, and the evenness with which it is
distributed among the population. Of two estimates,
the larger is likely to have a smaller per cent
sampling error, while of two estimates of comparable
size the one which refers to a characteristic more
evenly spread throughout the population would, in
general, be subject to smaller relative sampling
variability.
In this publication results likely to have very wide
margins of relative sampling variability have been
replaced by a dot, while other relatively imprecise
estimates are shown within brackets.
Survey response
A significant source of non-sampling error in the
labour force survey is the effect of non-response on
the results. Non-response rate is normally less than
10% in the countries where the survey is compulsory,
but can reach 40% in countries where the survey is
voluntary. Adjustment for non-response in the
majority of countries was made by re- weighting the
results while in some cases the method used was
'duplication' or 'substitution' of units. Quality checks
carried out in various countries suggest that
one-person households may be under-represented in the
sample as they tend to be more difficult to contact
than households containing several persons.
Weighting
The 1997 survey results were weighted up to
independently derived population estimates for
various categories of age, sex, region, nationality,
etc. categories. More information about weighting and
adjustment procedures can be found in The
European Union Labour Force Survey - Methods and
definitions, 1996.
Basic concepts and definitions
The concepts and definitions used in the survey are
those contained in the Recommendation of the 13th
International Conference of Labour Statisticians,
convened in 1982 by the International Labour
Organisation (and therefore referred to throughout
these notes as the 'ILO guidelines'). In accordance
with the ILO guidelines, the definitions given below
are applied. All these definitions apply to persons
aged 15 years and over, living in private households.
Persons in employment are those who during the
reference week did any work for pay or profit, or were
not working but had jobs from which they were
temporarily absent. Family workers are also included.
Unemployed persons are those who, during the
reference week :
(a) had no employment, and
(b) were available to start work within the next two
weeks, and
(c) had actively sought employment at some time
during the previous four weeks.
In addition, unemployed persons include those who
had no employment and had already found a job to
start later.
(b) the length of the period since the last job was held
(if this period is shorter than the duration of search for
a job).
The labour force Is defined as the sum of persons in
employment and unemployed persons.
Inactive persons are those who are not classified as
persons in employment nor as unemployed persons.
Activity rates represent the labour force as a
percentage of the population of working age.
Employment/population ratios represent persons in
employment as a percentage of the population of
working age.
Unemployment rates represent unemployed persons
as a percentage of the labour force.
The above rates are usually calculated for sex/age
groups and sometimes further cross-classified by
other demographic variables. A flowchart with the
labour force classification in the European Labour
Force Survey is provided on page 13.
Comparability with previous surveys
The concepts and definitions used in the European
Labour Force Survey have been derived from the ILO
guidelines since 1983. This has guaranteed the
comparability of the results between all the surveys
held since that year. The results of surveys held
before 1983 are not comparable since they were not
based upon these guidelines.
The integration into the 1992 series of a more exact
implementation of the guidelines implies that the
degree of comparability between the 1983-91 series
and the new series from 1992 is slightly less than the
comparability within each series. However, the fact
that both sets of definitions continue to rest upon the
ILO guidelines ensures that the differences are
minimal. These differences are explained in detail in
the publication The European Union Labour Force
Survey - Methods and definitions, 1996.
Implementation of the survey at national level
Sweden and Finland provided for the first time data
on occupations according to ISCO-88 (COM)
classification.
In the Danish survey, only persons aged between 15
and 66 are interviewed. A number of persons aged
less than 15 years or more than 66 years is added to
this main sample, but for these individuals the only
information available is demographic data; people
aged over 66 are automatically coded as being
retired.
In Sweden, the main survey covers persons aged
between 15 and 74 years; a sample of other persons
is added using the same method as in Denmark.
In the United Kingdom persons shown as 'registered
unemployed' are, in fact, claimants to unemployment
benefit. Data on recipients of unemployment benefit
are not available.
Contents of this publication
Certain tables showing absolute figures do not show
the category 'not stated' in the breakdown, thus it is
possible that the aggregate of the breakdown does
not correspond to the total.
Definition of inactives on education has slightly
changed in this publication. New definition includes:
- all persons declaring being inactive
because they are in education
or
training (col.80=1)
or
Table 1 : Distribution of the interviews by reference week (in % of the total of the interviews done in each country in
1997)
Reference week
1 2 3 4 5 6 7 8 9 10 11 12 13 14 15 16 17 18 19 20 21 22 23 24 25 26 27 28 Number of house holds (1)
Β DK D EL
100.C 8,6 7,8 8,1
7,4 100.C 8,1
7,6 8,7 7,3 7,7 7,3 7,5 6,8 7,0
0,2 7,2 6,9 7,C 6,7 7,1 8,1 7,£ 7,7 7,7 6,£ 6,£ 6,7 6,6 6,7 0,2
3 2 5 7 6 . 146767 61679 E
8,4 8,4 8,2 8,£ 8,2 8,2 8,2 8,2 8,4 8,4 8,2 8,2
• I 6018¿
F
0,S 31,6 28,2 23.9 13,2 2,1
\
I
\ 74742
IRL I L NL .
42,7 33,7 100.C 17,3
5,7 0,5 0,6 0,4 0,1
100.C 7,0 5,3 4,7 3,9 6,8 5,0 4,5 3,4 6,9 6,0 3,8 1,8 6,8 7,1 3,3 4,8 2,9 4,3 3,9 4,0 1,1
l 47665 75259 6155 35153 A
25,2 36,9 28,9 8,7 0,3
23012 Ρ
0,2
5,e
11,£ 19.É 22,e 17,9 12,2 8,C 1,{ 0,1
1 14876 FIN
26,2 25,2 24,E 23,7
Ι I
Ì 15356
S UK
32,2
34,9
32,9 7,5 7,7 7,6 7,7 7,7 7,7 7,6 7,8 8,0 7,8 7,8 7,6 7,6
ι . 61926
Labour force classification in the European Union Labour Force Survey
Person of 15 years or
more living in a
private household
Person did any work
for pay or profit
during the reference
week
Person was not
working but had a job
or business from
which absent in the
reference week
Unpaid family worker
Person was not
seeking employment
because a job which
would start later had
already been found
Person was seeking
employment
Yes
Yes
*
^L
No
Employed
person
— 7 r > —
No
Labour
Ak:
force
7 \
No
Person had during
last 4 weeks taken
active steps to
find a jflb
.Yes
Person could have
started to work immediate '
(within 2 weeks)
m
eurostat
Graph 1 : Activity by sex and age-groups -1997
95-99 90-94 85-89 80-84 75-79 70-74 65-69 6044 55-59 50-54 45-49 40-44 35-39 30-34 25-29 20-24 15-19
\
I
. . . I : I
I
I I
Ι , Ί
Fem£
■
1
1
1
1
J
.
I
¥
4.5 3 ¡η % of totat population
age o
in % of total population in % of total population 4.5 3 age 1.5 in % of total population 3 4.5
4.5 3 in % of total population
o age 1.5 3 4.5
in % of total population
5 3 1.5
in % of total population
o age o 1.5 3 4.5
in % of total population
95-99 90-94 85-69 6044 75-79 70-74 65-69 60-64 55-59 50-54 45-49 40-44 35-39 30-34 25-29
L
;.
I
ι
I
. I
_rz
...
Females
■ ■ u\
Ί I
I !
I_.:v1
Y 1
m
eurostat
Graph 1 : Activity by sex and age-group -1997
4.5 3 1.5 in % of total population
o age 0 3 4.5
in % of total population
5 3 1.5
in % of total population in % of total population
4.5 3 in % of total population
age 0 3 4.5
in % of total population
4.5 3 in % of total population
95-99 90-94 85-89 60-84 75-79 70-74 65-69 60-64 55-59 50-54 45-49 40-44 35-39 30-34 25-29 20-24 15-19 10-14 5-9 0-4
Li
. I:I
I
I : I I S S MI
1
1
Females
1
1 1
1 1
β 1Ι ι
Ι ι
1
age 3 4.5
in % of total population
3
MalesM
: .
1
I I
ι ι
ι I
II
II
II
Γ
1 1
J S
eurostat
Graph 1 : Activity by sex and age-group -1997
4.5 3 1.5
in % of total population age
1.5 3 4.5
in % of total population in % of total population 4.5 3 1.5
95-99 90-94 85-89 60-64 75-79 70-74 65-69 60-84 55-59 50-54 45-49 40-44 35-39 30-34 25-29 20-24 15-19
|:
1
I I
I I
I I
ILS Females
■1
r ι
V ι
V ι
i
I
o age 1.5 3 4.5
in % of total population
95-99 90-94 8 5 4 9 8 0 4 4 75-79 70-74 6 5 4 9 6 0 4 4 55-59 50-54 45-49 4 0 4 4 35-39 30-34 25-29 20-24 15-19 10-14 5-9
M
■'
L
ι
Ι...Ί
Females
m
ß
{
Ρ
mi
i
■
■
ι I4.5 3 1.5 in % of total population
o age o 1.5 3 4.5 in % of total population
95-99 90-94 8 5 4 9 8 0 4 4 75-79 70-74 6 5 4 9 60-64 55-59 50-54 45-49 40-44 35-39 30-34 25-29 20-24 15-19
V
I
I
I
I I I , I
I
Fern
1
4.5 3 1.5
in % of total population age
1.5 3 4.5
in % of total population
323
eurostatGraph 2: Employment by nationality -1997
in % of total population aged 15 and over
2 0
-B DK D EL E F IRL I L NL A Ρ FIN S UK
Other EU countries ■ ■ Non- EU countries [ ^ | Nationals
32a
eurostat
Graph 3: Employment rate by nationality
EU-15,1997
Labour Force Survey 1997 eurostat
33
Table 001
Principal characteristics of activity of the population
Persons in employment -working part-time Unemployed persons
-registered at employment exchange -seeking first job
Labour force Non-active persons
-in education
Persons 15 years and more Persons less than 15 years Total population
Persons in employment -working part-time Unemployed persons
-registered at employment exchange -seeking first job
Labour force Non-active persons
-in education
Persons 15 years and more Persons less than 15 years Total population
Persons in employment -working part-time Unemployed persons
-registered at employment exchange -seeking first job
Labour force Non-active persons
-in education
Persons 15 years and more Persons less than 15 years Total population
< 15 yrs % total population Activity rates
Employment / population ratios Unemployment rates
< 15 yrs % total population Activity rates
Employment / population ratios Unemployment rates
< 15 yrs % total population Activity rates
Employment / population ratios Unemployment rates
EU-15
150 070 25 384 18142 14505 3 744 168 213 135 680 26180 303 893
63619 367512
87 206 5 064 9 283 7689 1665 96488 49 992 12 665 146 480 32 616 179 096
62 865 20321 8 860 6 816 2 079 71724 85 689 13515 157 413
31003 188416
<
17.3 55.4 49.4 10.8
18.2 65.9 59.5
9.6
16.5 45.6 39.9 12.4
o
3838
564 378 345 82
4 215 4128
855
8343 1811 10154
2 277
74 174 162 35
2450 1589
428
4 039
927
4 966
1561
490 204 183 47
1765 2 539
427
4 304
884
5188
17.8 50.5 46.0
9.0
18.7 60.7 56.4
7.1
17.0 41.0 36.3 11.5
DK
2675
595 153 104 9
2828 1493
243
4 321
915
5 236
1460
176 69 44 5
1529
591 99
2120
469
2 590
1215
418 84 60 (4)
1299
902 144
2201
446
2 646
17.5 65.4 61.9
5.4
18.1 72.1 68.9
4.5
16.8 59.0 55.2
6.4
D EL
(1000)
Males and females 35 299
6169 3863 3576
220
39162 28742 4822 67 904 12663 80 567
3853
178 408 49 197
4 261 4461
810
8 723 1543 10266 Males 20159
847
2 069 1944
117
22 228 10 531 2435 32759 6487 39 246
2439
63 162 22 65
2 600 1534
391
4135
797
4 932
Females
15141 5 322 1794 1632
103
16 934 18 210 2387 35145 6177 41321
t&
1415
115 246 26 132
1661 2 927
419
4 588
746
5 334
(n)
Males and females
15.7 57.7 52.0
9.9
15.0 48.9 44.2
9.6
Males
16.5 67.9 61.5
9.3
16.2 62.9 59.0
6.2
Females
14.9 48.2 43.1 10.6
14.0 36.2 30.8 14.8
E
12 706 1043 3 360 2854
775
16 066 16 676 3 877 32 742 6168 38 910
8 231
266
1607 1394
289
9 838 5 954 1832 15791 3176 18 967
4475
777
1753 1460
486
6 229 10 722 2 044 16 951 2 992 19 943
15.9 49.1 38.8 20.9
16.7 62.3 52.1 16.3
15.0 36.7 26.4 28.1
F
22157 3 720 3 203 2856
369
25 360 20 387 4790 45747 11071 56 818
12 300
671
1533 1402
156
13 834 8012 2 293 21846 5 649 27 496
9 856 3049 1670 1455
213
11526 12 375
2 497 23 901 5422 29 322
19.5 55.4 48.4 12.6
20.5 63.3 56.3 11.1
18.5 48.2 41.2 14.5
IRL
1373
169 156 111 26
1529 1229
337
2 758
847
3 605
838 45 95 80 15 933 429 165
1362
435
1797
535 124 61 31 11 596 800 172
1396
412
1808
23.5 55.4 49.8 10.2
24.2 68.5 61.5 10.2
Lia
[image:23.595.57.545.89.691.2]eurostat Labour Force Survey 1997
Table 001
Principal characteristics of activity of the population
I
20 032 1414 2 827 2 329 1501 22859 25 064 5 006 47 923 8 725 56 648
12 810
423
1378 1145
682
14188 8 786 2 407 22974 4 492 27 465
7 222
990
1449 1184
820
8 671 16 278 2 599 24 949 4 233 29182
15.4 47.7 41.8 12.4
16.4 61.8 55.8
9.7
14.5 34.8 28.9 16.7
L
169 14 4 3
(D
173 165 30 339 77 416 106 (1) 2 (1) 108 59 16 167 39 206 63 13 2 (1)
(D
66 106 15 172 38 210
18.5 51.2 49.9
2.5
19.0 64.7 63.5
1.8
18.0 38.1 36.8
3.6 NL
7186 2 726
419 246 97
7 605 4 874
756
12479 2 856 15 335
4 214
717 190 140 51
4 404 1754
347
6158 1460 7 618
2 972 2 010
229 106 46
3 201 3120
409
6 321 1396 7 717
18.6 60.9 57.6
5.5
19.2 71.5 68.4
4.3
18.1 50.6 47.0
7.1
A Ρ
(1000)
Males and females
3 609
539 196 161 15
3 805 2 706
445
6511 1395 7 906
4 523
448 318 211 58
4 842 3 543
843
8 385 1463 9 848
Males
2 036
82 108 91 6
2145
959 215
3104
714
3 818
2 489
142 153 99 25
2 642 1294
401
3 936
735
4 671
Females
1572
456 87 69 9
1660 1747
230
3 407
681
4 089
2 034
306 165 112 33
2199 2 249
441
4 449
728
5177
/ l
(/0)
Males and females
17.6 58.4 55.4
5.1
14.9 57.7 53.9
6.6
Males
18.7 69.1 65.6
5.1
15.7 67.1 63.2
5.8
Females
16.7 48.7 46.1
5.3
14.1 49.4 45.7
7.5
FIN
2120
242 373 287 88
2493 1653
353
4146
966
5112
1 116
85 193 150 48
1309
678 166
1987
493
2481
1005
157 180 138 41
1184
975 187
2159
473
2 632
18.9 60.1 51.1 15.0
19.9 65.9 56.1 14.8
18.0 54.9 46.5 15.2
S
3 917
934 453 315 26
4 369 2818
710
7188 1649 8 837
2047
188 252 180 12
2299 1222
349
3 522
847
4 368
1870
746 200 135 14
2070 1596
361
3 666
803
4469
18.7 60.8 54.5 10.4
19.4 65.3 58.1 11.0
18.0 56.5 51.0
9.7
UK
26 612 6 630 2 032 1057
278
28 644 17 741 2 303 46 385 11470 57 854
14 685 1283 1295
834 159
15 980 6599 1121 22 580 5 896 28 476
11927 5347
736 224 119
12 664 11 142
1182 23 805
5 573 29 378
19.8 61.8 57.4
7.1
20.7 70.8 65.0
8.1
19.0 53.2 50.1
5.8
Persons in employment -working part-time Unemployed persons
-registered at employment exchange -seeking first job
Labour force Non-active persons
-in education
Persons 15 years and more Persons less than 15 years Total population
Persons in employment -working part-time Unemployed persons
-registered at employment exchange -seeking first job
Labourforce Non-active persons
-in education
Persons 15 years and more Persons less than 15 years Total population
Persons in employment -working part-time Unemployed persons
-registered at employment exchange -seeking first job
Labour force Non-active persons
-in education
Persons 15 years and more Persons less than 15 years Total population
< 15 yrs % total population Activity rates
Employment / population ratios Unemployment rates
< 15 yrs % total population Activity rates
Employment / population ratios Unemployment rates
< 15 yrs % total population Activity rates
Labour Force Survey 1997
L33
[image:24.595.64.541.102.610.2]eurostat
Table 002
Principal characteristics of activity
Persons in employment -working part-time Unemployed persons
-registered at employment exchange -seeking first job
Labourforce Non-active persons
-in education Total population
Persons in employment -working part-time Unemployed persons
-registered at employment exchange -seeking first job
Labourforce Non-active persons
-in education Total population
Persons in employment -working part-time Unemployed persons
-registered at employment exchange -seeking first job
Labourforce Non-active persons
-in education Total population
Activity rates
Employment / population ratios Unemployment rates
Activity rates
Employment / population ratios Unemployment rates
Activity rates
Employment / population ratios Unemployment rates
EU-15
17211 3 680 4641 3 372 2266 21852 25 709 22840 47 560
9465 1458 2 357 1741 1061 11822 12 053 11133 23 875
7 746 2 222 2 283 1631 1205 10029 13 656 11707 23 685
45.9 36.2 21.2
49.5 39.6 19.9
42.3 32.7 22.8
of young persons aged
Β
320 52 86 79 52 406 862 819
1269
184 16 39 36 23 224 422 409 645 136 36 47 43 29 183 441 410 624
32.0 25.2 21.3
34.7 28.5 17.6
29.3 21.8 25.7
DK
455 213 40 12 5 495 172 143 666 255 104 18 5 273 79 66 352 199 109 22 7 (3) 221 93 77 314
74.2 68.2
8.1
77.7 72.5
6.6
70.4 63.4
9.9
D
15 to 24
EL
(1000)
Males and females
3 835
349 458 393 115
4293 4351 3936 8 645
338 26 152 10 119 490 890 780
1380
Males 2044
126 278 243 62
2 321 2046 1940 4 367
198 12 56 (3) 43 254 403 375 657
Females
1792
223 181 149 54
1972 2 305 1997 4 278 ίο
140 14 96 7 76 235 487 405 723
(/0¡
Males and females 49.7
44.4 10.7
35.5 24.5 31.0 Males 53.2 46.8 12.0
38.7 30.1 22.2
Females
46.1 41.9
9.2
32.6 19.4 40.6
years
E
1595
221
1027
839 486
2 623 3 825 3563 6 447
955 91 484 392 207
1439 1802 1705 3 241
640 130 544 447 279
1184 2022 1858 3 206
40.7 24.7 39.2
44.4 29.5 33.6
36.9 20.0 45.9
F
1759
471 717 630 252
2476 4 767 4491 7243
952 149 352 311 116
1304 2247 2160 3 551
807 322 365 319 136
1172 2 520 2 330 3 692
34.2 24.3 29.0
36.7 26.8 27.0
31.7 21.9 31.2
IRL
244 38 46 31 20 290 346 318 637 133 17 27 20 12 160 166 157 325 111 22 19 11 9 130 181 162 311
45.6 38.3 15.9
49.1 40.9 16.7
Lia
[image:25.595.57.545.96.609.2]eurostat Labour Force Survey 1997
Table 002
Principal characteristics of activity of young persons aged 15 to 24 years
I2066
172
1048
884 784
3113 5 081 4285 8195
1233
54 495 412 365
1728 2 363 2079 4 091
833 117 552 471 420
1385 2719 2207 4104
38.0 25.2 33.6
42.2 30.1 28.7
33.8 20.3 39.9
L
17
(D
(1) (1) (1) 18 30 28 48 9 (1) 10 15 14 24 8 (1)
0)
8 15 14 24
37.4 34.7 (7.3)
39.4 37.2 (5.6)
35.3 32.1 (9.2)
NL
1096
635 118 45 60
1215
711 538
1925
571 300 58 24 30 629 349 271 978 525 335 60 20 31 585 362 268 947
63.1 56.9
9.7
64.3 58.4
9.2
61.8 55.4 10.3
A Ρ
(1000)
Males and females
504 42 41 33 10 546 388 357 934
595 43 98 57 45 692 876 790
1568
Males
263 11 22 17
5
285 179 168 464
341 18 42 22 20 383 407 377 791
Females
242 31 19 16 5 261 209 189 470
254 25 56 36 25 309 468 413 778
(%) Males and females
58.4 54.0
7.6
44.2 37.9 14.1
Males
61.4 56.6
7.8
48.5 43.1 11.0
Females
55.4 51.4
7.3
39.8 32.6 18.0
FIN
193 70 106 49 73 299 318 289 616 105 29 55 28 38 159 146 139 305 88 41 51 21 35 139 172 150 311
48.4 31.3 35.4
52.2 34.4 34.2
44.7 28.3 36.8
S 342 142 96 40 9 437 627 555
1065
178 50 52 23 (4) 231 314 280 545 163 93 43 17 5 207 313 276 520
41.1 32.1 21.9
42.3 32.7 22.7
39.8 31.4 21.0
UK
3 853 1204
605 270 234
4458 2464 1947 6 922
2 044
480 378 204 136
2 422 1117
994
3 539
1809
723 228 67 98
2037 1347
953
3 383
64.4 55.7 13.6
68.4 57.8 15.6
60.2 53.5 11.2
Persons in employment -working part-time Unemployed persons
-registered at employment exchange -seeking first job
Labour force Non-active persons
-in education Total population
Persons in employment -working part-time Unemployed persons
-registered at employment exchange -seeking first job
Labourforce Non-active persons
-in education Total population
Persons in employment -working part-time Unemployed persons
-registered at employment exchange -seeking first job
Labourforce Non-active persons
-in education Total population
Activity rates
Employment / population ratios Unemployment rates
Activity rates
Employment / population ratios Unemployment rates
Activity rates
Labour Force Survey 1997
tia
eurostatTable 003
Activity rates by age groups
EU-15 DK EL IRL
15-19 years 20-24 years 25-29 years 30-34 years 35-39 years 40-44 years 45-49 years 50-54 years 55-59 years 60-64 years 65 - 69 years 70 & + years All ages
15-24 years 25-49 years 50 & + years 25 & + years 15-19 years 20-24 years 25-29 years 30-34 years 35 - 39 years 40-44 years 45-49 years 50-54 years 55-59 years 60-64 years 65-69 years 70 & + years All ages
15-24 years 25-49 years 50 & + years 25 & + years 15-19 years 20-24 years 25-29 years 30-34 years 35-39 years 40-44 years 45-49 years 50-54 years 55-59 years 60-64 years 65-69 years 70 & + years All ages
15-24 years 25-49 years 50 & + years 25 & + years
26.6 64.8 81.3 83.6 83.8 83.7 80.9 72.9 55.2 23.5
6.6
1.9
55.4 45.9 82.7 28.7 57.129.1 69.8 88.9 94.9 95.3 94.9 93.2 86.9 68.6 32.7
9.4
3.3
65.9 49.5 93.4 39.0 69.124.1 59.8 73.4 72.0 72.1 72.8 68.6 59.0 42.0 15.1
4.2
1.1
45.6 42.3 71.8 20.3 46.16.6
56.6 88.2 87.8 85.5 81.7 75.2 63.0 35.3 11.22.2
0.7
50.5 32.0 83.9 19.4 53.87.9
60.6 93.1 95.4 95.2 93.5 90.6 81.7 49.3 18.43.5
1.1
60.7 34.7 93.7 29.2 65.65.1
52.6 83.2 80.0 75.5 69.6 59.3 44.2 21.74.6
(1.2) (0.4) 41.0 29.3 73.8 11.4 43.067.9 79.8 84.3 89.2 90.0 90.9 87.9 80.8 71.8 34.1 11.0
657
74.2 88.5 37.3 63.870.0 85.0 89.5 95.6 93.2 94.7 93.0 89.1 81.5 42.9 15.3
72"! 77.7 93.2 45.6 71.0
65.4 74.5 79.1 82.8 86.6 87.4 83.0 73.0 61.1 25.2
6.8
59~Ό 70.4 83.7 30.0 57.1Males and females
30.3 70.8 80.6 84.6 85.8 87.3 85.6 79.6 64.1 20.2
5.0
1.7
57.7 49.7 84.8 31.9 58.8Males 33.3 75.1 86.6 95.2 95.9 96.1 94.6 90.5 74.7 29.0
6.8
2.8
67.9 53.2 93.7 42.2 70.1Females
27.3 66.4 74.2 73.3 75.2 78.6 76.4 68.6 53.2 11.7
3.4
1.1
48.2 46.1 75.5 23.4 48.514.4 59.2 78.4 79.7 80.1 77.8 72.0 63.6 52.1 33.0 13.1
3.1
48.9 35.5 77.6 28.0 51.415.5 66.7 91.9 96.9 97.3 96.8 95.1 89.1 75.0 47.7 20.1
5.2
62.9 38.7 95.6 41.5 67.513.3 52.9 66.0 63.8 64.3 59.7 49.8 39.2 30.7 20.3
6.9
1.5
36.2 32.6 60.8 16.3 36.919.8 59.3 82.2 80.2 78.3 75.3 70.1 62.7 50.0 27.7
3.5
0.6
49.1 40.7 77.4 24.3 51.122.6 63.9 89.3 94.7 95.7 94.5 92.8 88.4 74.8 41.2
4.6
1.0
62.3 44.4 93.3 37.4 66.917.1 54.7 74.4 65.9 61.7 56.6 48.0 38.0 26.8 15.6
2.5
0.3
36.7 36.9 61.6 13.3 36.710.8 58.1 86.0 87.2 87.5 88.3 86.2 80.6 52.6 11.1
2.6
0.7
55.4 34.2 87.0 25.5 59.413.8 61.6 93.7 96.5 96.8 96.3 94.8 90.9 60.9 11.4
3.7
1.1
63.3 36.7 95.6 31.8 68.57.7
54.9 78.5 77.8 78.5 80.6 77.6 70.2 44.7 10.81.8
0.4
48.2 31.7 78.6 20.3 51.222.9 71.6 85.0 79.7 76.4 72.4 67.6 61.6 50.3 34.8 14.7
5.9
55.4 45.6 76.6 32.2 58.426.1 75.7 91.6 94.0 93.2 92.0 88.8 82.9 72.0 52.0 24.2 11.1 68.5 49.1 92.0 48.5 74.6
Liza
eurostat Labour Force Survey 1997
Table 003
Activity rates by age groups
I
18.8 55.0 71.2 78.1 78.1 76.7 71.2 56.9 37.8 18.7
6.1 2.2
47.7 38.0 75.0 22.0 49.7
21.4 61.1 82.1 94.1 95.6 95.9 92.7 78.2 54.9 30.6 10.2
4.0
61.8 42.2 91.7 34.5 66.0
16.0 49.1 60.2 61.8 60.4 58.0 50.0 36.3 21.5
8.3 2.8 1.1
34.8 33.8 58.3 11.9 35.0
L
9.9
61.0 82.2 79.4 79.5 77.1 72.0 59.8 35.9 10.8 (2.5) (1.4) 51.2 37.4 78.2 20.2 53.5
(11.9) 62.5 91.3 96.8 96.8 96.0 92.9 82.8 54.7 (14.6)
64.7 39.4 94.9 31.0 69.0
(7.8) 59.4 72.7 61.4 61.6 57.4 50.6 36.5 17.6 (7.2)
38.1 35.3 61.1 10.8 38.6
NL
48.4 76.4 87.5 84.3 83.2 82.6 80.3 69.9 48.9 14.2
6.0 1.8
60.9 63.1 83.7 28.1 60.6
50.3 77.2 92.7 95.6 95.4 94.6 93.8 87.8 64.3 21.2
9.5 3.5
71.5 64.3 94.4 39.8 72.9
46.5 75.6 82.0 72.8 70.2 70.7 66.2 51.6 33.2
7.5 3.0 0.6
50.6 61.8 72.5 18.0 48.7
A Ρ
(%)
Males and females
41.8 73.4 84.0 86.0 87.1 87.6 83.1 72.8 43.7 10.9
5.2
2.0
58.4 58.4 85.6 25.0 58.4
23.6 63.3 84.5 88.3 86.9 86.3 81.8 73.0 57.6 41.1 25.6 11.5 57.7 44.2 85.5 38.1 60.9
Males
46.9 75.0 87.9 95.5 97.4 96.6 94.4 86.5 63.4 13.5
6.5 3.2
69.1 61.4 94.3 36.2 70.5
25.8 69.2 89.3 94.8 95.1 95.1 93.7 88.2 71.3 52.8 33.5 17.8 67.1 48.5 93.6 50.0 71.8
Females
36.7 72.0 80.0 76.1 76.5 78.5 71.6 59.5 24.7
8.6 4.1 1.4
48.7 55.4 76.7 16.4 47.6
21.4 57.2 79.6 82.3 79.8 78.5 70.7 59.9 45.6 31.1 18.7
7.3
49.4 39.8 78.0 28.7 51.5
FIN
31.4 66.0 82.4 88.2 89.2 90.1 88.3 81.9 58.9 19.5
5.1 1.0
60.1 48.4 87.8 31.9 62.2
31.8 73.0 88.8 93.8 91.4 91.6 88.5 81.3 60.4 21.9
9.6
(2.4) 65.9 52.2 90.8 37.5 68.4
31.0 59.1 75.8 82.2 86.9 88.6 88.1 82.6 57.5 17.3
54.9 44.7 84.7 27.5 56.6
S
17.4 62.2 83.2 87.3 89.0 91.2 90.4 89.4 80.4 54.0
9.0 1.9
60.8 41.1 88.2 40.3 64.2
15.1 67.0 85.5 91.5 91.0 93.4 91.3 90.6 84.4 57.1 15.3
3.4
65.3 42.3 90.6 46.3 69.5
19.8 57.3 80.9 83.0 86.9 89.0 89.5 88.1 76.4 51.0
3.3 0.9
56.5 39.8 85.8 35.1 59.2
UK
50.3 78.4 83.9 83.4 84.0 84.9 84.8 78.7 63.7 38.9 10.8
2.6
61.8 64.4 84.1 34.6 61.3
51.5 85.2 92.9 93.9 93.1 91.3 91.2 85.6 74.6 51.5 14.0
4.4
70.8 68.4 92.6 43.6 71.2
49.1 71.3 74.5 72.6 74.7 78.4 78.3 71.9 53.0 26.9
8.0 1.5
53.2 60.2 75.6 26.9 52.0
15-19 years 20-24 years 25-29 years 30-34 years 35-39 years 40-44 years 45-49 years 50-54 years 55-59 years 60-64 years 65-69 years 70 & + years All ages
15-24 years 25-49 years 50 & + years 25 & + years
15-19 years 20-24 years 25-29 years 30-34 years 35-39 years 40-44 years 45-49 years 50-54 years 55-59 years 60-64 years 65-69 years 70 & + years All ages
15-24 years 25-49 years 50 & + years 25 & + years
15-19 years 20-24 years 25-29 years 30-34 years 35-39 years 40-44 years 45-49 years 50-54 years 55-59 years 60-64 years 65-69 years 70 & + years All ages
Labour Force Survey 1997
[123
eurostat
Table 004
Activity rates by marital status and broad age groups
EU-15 DK EL IRL
Single persons 15-24 years 25-49 years 50-64 years 65 & + years Married
15-24 years 25-49 years 50-64 years 65 & + years Widowed or divorced
15-24 years 25-49 years 50-64 years 65 & + years Total
15-24 years 25-49 years 50-64 years 65 & + years
Single persons 15-24 years 25-49 years 50-64 years 65 & + years Married
15-24 years 25-49 years 50-64 years 65 & + years Widowed or divorced
15-24 years 25-49 years 50-64 years 65 & + years Total
15-24 years 25-49 years 50-64 years 65 & + years
Single persons 15-24 years 25-49 years 50-64 years 65 & + years Married
15-24 years 25-49 years 50-64 years 65 & + years Widowed or divorced
15-24 years 25-49 years
(%)
60.5 44.9 85.6 54.6
4.2
58.1 64.1 81.3 52.0
4.4
32.0 54.8 83.1 47.5
1.8
55.4 45.9 82.7 51.6
3.4
65.8 48.4 88.3 57.9
7.6
67.9 86.1 96.5 65.3
5.7
49.4 76.7 90.6 59.8
3.8
65.9 49.5 93.4 64.2
5.5
54.2 41.2 81.7 50.2
2.5
48.3 55.7 67.6 37.9
2.6
25.7 48.0 78.6
50.6 29.0 87.1 45.0 (4.1) 55.8 73.8 83.4 37.7
1.3
27.0 79.1 33.2 (0.6) 50.5 32.0 83.9 37.4
1.2
55.9 32.7 89.1 49.0 (8.3) 64.9 92.7 95.8 52.3
1.7
45.0 86\9 45.2 60.7 34.7 93.7 51.4
2.0
43.8 24.8 83.9 38.3 46.8 67.4 71.6 22.3 (0.9) 20.2 72.2
77.2 74.4 86.4 65.8 67.0 68.7 90.8 67.9
4.8
35.2 82~2 59.3
1.8
65.4 74.2 88.5 66.3
3.3
80.9 77.3 90.3 70.1 70.4 100.0 96.2 77.6
6.6
48.9 89T5 63.2 72.1 77.7 93.2 75.0
5.3
72.5 71.1 81.2 57.8 63.7 56.2 86.2 57.9 (2.4) 28.5
76Ü
Males and females
65.2 48.6 87.7 62.0
3.3
60.3 63.1 83.2 55.4
3.6
33.4 64.8 88.0 52.1
1.6
57.7 49.7 84.8 55.3 2.8
Males
70.3 51.5 88.4 65.6
7.8
68.6 89.5 96.7 66.1
4.6
52.4 (86.6) 92.7 62.5
2.9
67.9 53.2 93.7 65.8 4.4
Females
58.9 45.4 86.5 56.7
2.1
51.9 52.2 71.1 43.6
2.3
26.7 55.6 84.8
52.9 34.4 87.7 45.2
(6.5)
52.6 51.3 74.3 51.2
9.3
18.8 81.4 32.6
2.0
48.9 35.5 77.6 49.0
6.7
60.0 37.6 90.6 61.5 66.3 88.8 97.9 70.9 11.7 30.2 92.3 63.3
4.7
62.9 38.7 95.6 70.2 10.7
44.4 31.2 82.5 32.6 39.0 44.3 55.2 30.1
5.5
16.3 78.2
54.0 39.8 85.0 55.0
2.8
51.0 64.2 74.2 46.9
1.9
20.7 69.2 81.3 38.1
0.5
49.1 40.7 77.4 46.7
1.5
59.1 43.6 86.5 55.6
5.4
66.3 81.9 96.8 69.8
2.3
31.9 90. i
59.2
(0.8)
62.3 44.4 93.3 68.2
2.3
48.0 35.9 82.7 54.3
(1.5)
35.8 56.1 54.1 23.7
1.3
17.9 69.5 78.0
57.7 32.8 89.5 54.3
2.9
59.0 64.2 85.5 49.5
1.4
35.9 (65.3) 89.6 48.5
0.8
55.4 34.2 87.0 49.7
1.3
62.4 35.8 92.5 51.7
5.1
65.5 74.6 97.6 57.9
1.8
51.7 94.1 52.8
1.7
63.3 36.7 95.6 56.8
2.0
52.4 29.7 85.5 57.9 52.6 60.4 74.5 40.6
1.0
30.1 (55.7) 86.7
57.4 45.2 85.9 56.9 15.2 59.0 63.0 72.9 51.1 10.2 22.7 71.4 37.3
3.7
55.4 45.6 76.6 50.5
8.7
61.5 48.7 87.9 60.4 24.5 76.9 (84.4) 94.2 73.8 15.2 39.0 87.1 58.4 68.5 49.1 92.0 70.8 15.7
52.6 41.5 83.3 50.4 41.5 55.2 53.6 27.3
(3.4)
Lig
e u r o s t a t Labour Force Survey 1997
Table 004
Activity rates by marital status and broad age groups
I
51.8 37.3 78.0 41.2 4.5 50.4 51.8 73.4 39.2 4.4 19.7 41.0 80.8 28.3 1.7 47.7 38.0 75.0 38.2 3.5
58.8 41.4 83.0 48.9 8.0 65.3 78.5 96.4 56.6 6.3 38.2 (59.4) 93.5 49.8 5.0 61.8 42.2 91.7 55.6 6.2
43.6 33.1 70.5 32.5 2.7 35.8 43.5 53.2 21.2 2.0 14.9 32.5 74.3
L
57.8 33.3 89.0 53.2
52.7 74.2 74.4 35.4 (2.0) 30.1
79.1 36.7
51.2 37.4 78.2 36.6 (1.9)
62.1 36.2 89.8 60.6
67.6 (95.6) 97.1 51.8 (2.7) 50.1
95.9 54.4
64.7 39.4 94.9 52.7 (3.2)
52.1 30.0 87.7 (38.9)
37lî 65.6 53.1 17.9
22.8
69.5
NL
74.3 63.0 91.1 54.4
59.5 65.7 80.8 48.4 3.9 33.4
77.8 41.3 2.2 60.9 63.1 83.7 47.7 3.1
77.2 63.9 92.2 56.2
70.7 80.9 96.3 63.5 6.1 51.2
88.6 55.0 4.2 71.5 64.3 94.4 62.1 5.6
70.7 62.0 89.6 52.0
48"2 60.0 66.6 31.9 1.1 25.5
70.3
A Ρ
(%)
Males and females 68.1
57.0 87.5 51.1 6.5 60.1 79.0 84.2 45.8 3.7 32.4
90.6 38.9 1.5 58.4 58.4 85.6 45.0 3.0
52.5 41.5 81.8 57.6 16.6 64.7 78.6 86.4 58.9 20.2 31.6 88.5 88.4 50.0 8.5 57.7 44.2 85.5 57.9 16.1 Males 73.1 60.2 88.1 59.8 (17.1) 68.8 94.7 97.6 58.9 4.3 53.8
94.4 54.4
69.1 61.4 94.3 58.5 4.4
58.1 46.4 83.4 54.8 27.2 73.2 96.1 97.0 72.4 25.0 41.4
91.6 66.1 14.8 67.1 48.5 93.6 71.6 23.5
Females
62.2 53.6 86.6 42.0
51.4 73.1 72.0 31.4 3.0 25.4
88.2
46.7 36.1 79.6 58.9 13.7 56.4 71.2 76.9 44.9 14.1 29.1 (93.1) 87.2
FIN
61.1 46.6 84.6 56.7 (4.1) 65.5 55.3 89.6 59.8 2.7 38.9
87l) 49.0 (1.3) 60.1 48.4 87.8 57.2 2.3
65.5 49.9 85.4 49.6 (11.2) 67.5 90.2 95.3 61.5 4.3 54.4
86"2 54.0 (5.4) 65.9 52.2 90.8 58.6 5.1 .
56.2 43.1 83.5 65.0
63.4 40.9 84.4 58.0
31.7
87T
S
63.6 40.8 86.1 74.3
65.8 53.6 90.6 78.9 5.1 41.3
86~2 73.6 2.5 60.8 41.1 88.2 77.2 3.7
66.1 42.1 87.0 73.0
67.1 (67.0) 94.7 82.1 7.6 55.0
893
77.2 6.4 65.3 42.3 90.6 80.0 6.8
60.5 39.3 84.7 76.2
64Ü 50.5 87.0 75.6 2.0 34.5
84~Ό
UK
69.6 64.1 84.5 56.6
5.0
64.7 71.5 85.7 64.3
6.6
39.3 50.6 75.9 55.4
3.0
61.8 64.4 84.1 62.3
5.1
75.0 67.6 89.5 61.7
7.7
71.5 92.4 95.0 74.3
8.3
54.5 90.6 86.5 65.2
5.4
70.8 68.4 92.6 72.2
7.6
63.2 60.2 77.6 49.1
3.1
57.5 62.3 76.4 53.5
4.5
32.4 42.1 69.2
Single persons 1 5 - 2 4 years 2 5 - 4 9 years 5 0 - 6 4 years 65 & + years Married
1 5 - 2 4 years 2 5 - 4 9 years 5 0 - 6 4 years 65 & + years Widowed or divorced
1 5 - 2 4 years 2 5 - 4 9 years 5 0 - 6 4 years 65 & + years Total
1 5 - 2 4 years 2 5 - 4 9 years 5 0 - 6 4 years 65 & + years
Single persons 1 5 - 2 4 years 2 5 - 4 9 years 5 0 - 6 4 years 65 & + years Married
1 5 - 2 4 years 2 5 - 4 9 years 5 0 - 6 4 years 65 & + years Widowed or divorced
1 5 - 2 4 years 2 5 - 4 9 years 5 0 - 6 4 years 65 & + years Total
1 5 - 2 4 years 2 5 - 4 9 years 5 0 - 6 4 years 65 & + years
Single persons 1 5 - 2 4 years 2 5 - 4 9 years 5 0 - 6 4 years 65 & + years Married
1 5 - 2 4 years 2 5 - 4 9 years 5 0 - 6 4 years 65 & + years Widowed or divorced