TECHNICAL NOTE
Validation of an automated colony
counting system for group A Streptococcus
H. R. Frost
1,2, S. K. Tsoi
1, C. A. Baker
1, D. Laho
1, M. L. Sanderson‑Smith
3, A. C. Steer
1,4,5and P. R. Smeesters
1,3,5*Abstract
Background: The practice of counting bacterial colony forming units on agar plates has long been used as a method to estimate the concentration of live bacteria in culture. However, due to the laborious and potentially error prone nature of this measurement technique, an alternative method is desirable. Recent technologic advancements have facilitated the development of automated colony counting systems, which reduce errors introduced during the manual counting process and recording of information. An additional benefit is the significant reduction in time taken to analyse colony counting data. Whilst automated counting procedures have been validated for a number of micro‑ organisms, the process has not been successful for all bacteria due to the requirement for a relatively high contrast between bacterial colonies and growth medium. The purpose of this study was to validate an automated counting system for use with group A Streptococcus (GAS).
Results: Methods: Twenty‑one different GAS strains, representative of major emm‑types, were selected for assess‑ ment. In order to introduce the required contrast for automated counting, 2,3,5‑triphenyl‑2H‑tetrazolium chloride (TTC) dye was added to Todd–Hewitt broth with yeast extract (THY) agar. Growth on THY agar with TTC was com‑ pared with growth on blood agar and THY agar to ensure the dye was not detrimental to bacterial growth. Auto‑ mated colony counts using a ProtoCOL 3 instrument were compared with manual counting to confirm accuracy over the stages of the growth cycle (latent, mid‑log and stationary phases) and in a number of different assays. The average percentage differences between plating and counting methods were analysed using the Bland–Altman method. Conclusions: Results: A percentage difference of ±10 % was determined as the cut‑off for a critical difference between plating and counting methods. All strains measured had an average difference of less than 10 % when plated on THY agar with TTC. This consistency was also observed over all phases of the growth cycle and when plated in blood following bactericidal assays. Agreement between these methods suggest the use of an automated colony counting technique for GAS will significantly reduce time spent counting bacteria to enable a more efficient and accurate measurement of bacteria concentration in culture.
Keywords: Automated, Colony counting, Group A Streptococcus, TTC
© 2016 Frost et al. This article is distributed under the terms of the Creative Commons Attribution 4.0 International License (http://creativecommons.org/licenses/by/4.0/), which permits unrestricted use, distribution, and reproduction in any medium, provided you give appropriate credit to the original author(s) and the source, provide a link to the Creative Commons license, and indicate if changes were made. The Creative Commons Public Domain Dedication waiver (http://creativecommons.org/ publicdomain/zero/1.0/) applies to the data made available in this article, unless otherwise stated.
Findings Background
The practice of counting bacterial colony forming units (CFU) on agar plates has long been used as a method to estimate the concentration of live bacteria in a culture. However, due to the laborious and potentially error prone nature of this measurement technique, an alternative
method is desirable. Recent technologic advancements have facilitated the development of automated colony counting systems, which remove the potential for error introduced both during the manual counting process and in the recording of this information [1]. Automated counting procedures have been validated for a number of microorganisms, including Pseudomonas aeruginosa and Streptococcus pneumoniae, grown on various agar media [1, 2]. However automated counting has not been successful for all bacteria due to the requirement for a relatively high contrast between the bacteria colonies
Open Access
*Correspondence: [email protected]
1 Group A Streptococcus Research Group, Murdoch Childrens Research
and growth medium. Group A Streptococcus (GAS) is a Gram-positive, beta-haemolytic bacterium that is an important cause of infectious disease morbidity and mor-tality worldwide [3]. The characteristic beta-hemolysis of GAS on blood agar plate makes automatic colony count-ing more challengcount-ing because of the resultcount-ing poor con-trast between the colony and the growth medium.
2,3,5-Triphenyltetrazolium chloride (TTC) is a redox indicator that produces water insoluble red formazan crystals when reduced [4]. It has been used extensively for several decades as an indicator of tissue ischaemia [5, 6], and more recently to detect the presence of live micro-organisms based on metabolic activity of intracel-lular enzymes [4]. Accumulation of TTC within live bac-teria provides high contrast between bacbac-terial colonies and several solid agar media. TTC has been successfully used for colony staining for automated colony counting in gram positive organisms including S. pneumoniae and group B Streptococcus [2, 7]. One study reported toxicity of TTC to Listeria monocytogenes but whether this phe-nomenon occurs in GAS is unknown [8].
A number of vaccine candidates against GAS are cur-rently under investigation in clinical trials and in pre-clinical studies [9]. Bactericidal assays are essential for the evaluation of efficacy in these trials, which require the enumeration of many bacterial cultures and as such are very time consuming. In order to increase the through-put and reproducibility of immunoassays involved in GAS research, we developed a method for automated counting of GAS CFU on Todd Hewitt broth agar plates with TTC dye. Our study aimed to validate this method using a collection of representative GAS isolates in differ-ent experimdiffer-ental procedures and conditions.
Methods
Bacteria strains and culture
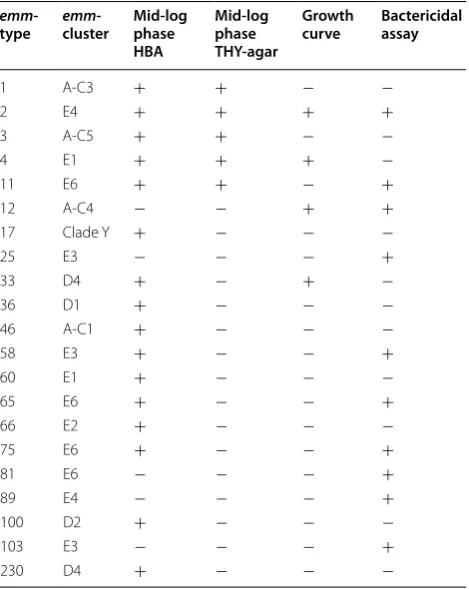
Twenty-one GAS strains belonging to 21 different emm -types were selected representing the 13 most frequent emm-clusters globally ([10]; Smeesters Personal Commu-nication; Table 1). Glycerol stocks of GAS were streaked on Colombia Horse Blood Agar (HBA; Thermo-Fisher Scientific, Scoresby) plates and incubated overnight at 37 °C with 5 % CO2 to obtain single colonies [11].
Indi-vidual colonies were used to inoculate Todd Hewitt broth with 1 % yeast extract (THY). Liquid cultures for all strains were incubated at 37 °C with agitation at 100 rpm. A tenfold serial dilution of each culture was made after incubation to mid-log phase and dilutions of 1:100 to 1:106 were plated in triplicate. Using a multichannel
pipette, 5 µL of dilutions were dripped onto the plates and allowed to spread vertically (Fig. 3). Plates were dried for 10 min and incubated overnight at 37 °C with 5 % CO2.
Plating bacterial cultures
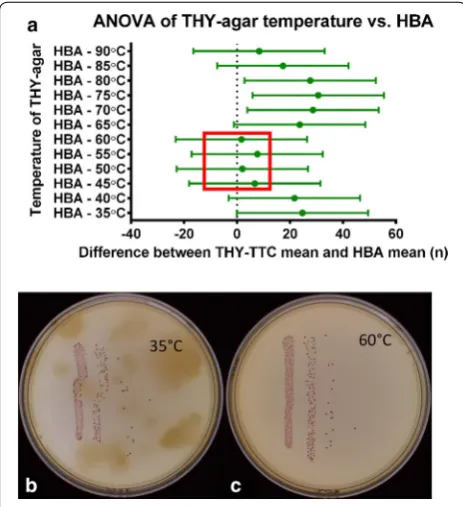
[image:2.595.305.540.114.409.2]HBA plates were sourced commercially and THY-agar plates were made by addition of 1 % agar to THY prior to autoclaving. TTC (Sigma Aldrich, Sydney) was diluted in PBS and filter sterilised through a 0.22 µm syringe-driven filter before being added at a final concentration of 0.04 mg/mL to autoclaved agar to make THY-TTC plates. As THY-TTC is heat-sensitive, addition of THY-TTC to agar prior to adequate cooling results in the reduc-tion of dye to the coloured form 1,3,5-triphenylformazan (TPF) which in turns lead to insufficient coloration of live bacteria and lower contrast between colonies and agar. However with excessive cooling the agar solidifies and the media is unable to be poured into plates (Fig. 1). The optimum range of agar temperatures for the addition of TTC and pouring plates was examined by cooling the agar to between 35 and 90 °C prior to addition of TTC. A GAS culture was diluted and plated on plates prepared from all temperatures measured and HBA. The time for which the THY-TTC plates remain usable was examined over 4 weeks. The older plates had been stored at 4 °C and were incubated at room temperature for 3 h before use and the fresh plates were left at room temperature following pouring.
Table 1 GAS Strains analysed on different media in vari-ous assays
emm
-type emmcluster- Mid-log phase HBA
Mid-log phase THY-agar
Growth
curve Bactericidal assay
1 A‑C3 + + − −
2 E4 + + + +
3 A‑C5 + + − −
4 E1 + + + −
11 E6 + + − +
12 A‑C4 − − + +
17 Clade Y + − − −
25 E3 − − − +
33 D4 + − + −
36 D1 + − − −
46 A‑C1 + − − −
58 E3 + − − +
60 E1 + − − −
65 E6 + − − +
66 E2 + − − −
75 E6 + − − +
81 E6 − − − +
89 E4 − − − +
100 D2 + − − −
103 E3 − − − +
Counting colonies
Bacterial colonies plated on THY-agar and HBA were counted manually by one person, by photographing the plates and counting with ImageJ software (http://imagej. nih.gov/ij/) which marks each colony and counts the total. Where visible, touching colonies were split and counted as multiple colonies. Bacterial colonies plated on THY-TTC were counted using the Protocol 3 instru-ment with the automatic colony counting functional-ity according to manufacturer’s recommendations [12]. Briefly, batches were configured to the plate diameter and for a 5 µL sample and exposure was set at 12 ms. Col-our configuration was repeated for each batch based on an exemplar plate, small particles were included and the colonies that appeared to be touching were split where applicable. Frames and zones were modified as necessary to fit all colonies from each drip and were carefully exam-ined to ensure all colonies and no debris or artefacts were included in the count. For a full protocol on plate prepa-ration and using the automated colony counting system please refer to Additional file 1. Time needed to perform manual and automatic counting was recorded.
Experiments tested
Growth curve All stages of the bacterial growth cycle were tested by automatic counting to ensure reliability of the methodology at the different phases. GAS grown over-night on HBA plates were used to inoculate THY media and incubated for 2 h at 37 °C with agitation at 100 rpm. After 2 h, samples of the cultures were diluted tenfold serially and plated on HBA and THY-TTC agar, and fur-ther samples were used to measure the optical density at 600 nm (OD600). The cultures were returned to the
incu-bator and the above repeated every hour until a plateau was reached according to the OD600 of the cultures. Plates
were incubated overnight at 37 °C with 5 % CO2.
Mid‑log phase Previous studies had identified a poten-tial toxic effect of TTC on gram-positive bacteria during mid-log phase [8]. Therefore toxicity of TTC was investi-gated by comparison of bacterial growth on the different agar media. Sixteen strains of GAS were grown to mid-log phase, cultures were diluted in PBS and plated in triplicate on HBA, THY-TTC or THY agar plates.
Bactericidal assay In order to determine whether the presence of TTC has any detrimental effect on the estima-tion of bactericidal activity in immunoassays, a number of direct bactericidal assays (DBA) were undertaken on a range of strains and donors. The protocol was approved by the Ethics Committees of Erasme Hospital in Brussels, Belgium (Reference: P2015/398/B406201525683), and
written informed consent was obtained from each par-ticipant. Mid-log phase GAS cultures were diluted in PBS to 1 × 10⁻³, 4 × 10⁻³ and 1.6 × 10⁻⁴ and used to
inocu-late fresh whole blood at a ratio of 1:4. Bacteria and blood cultures were incubated for 3 h at 37 °C with rotation [11]. Following incubation, cultures were diluted tenfold in PBS and plated on THY-TTC and HBA plates as above. The original diluted inoculum was also plated prior to the 3 h incubation (T0) and the fold-increase between the two
was calculated to estimate survival of bacteria in blood.
Statistical analysis
Growth of bacteria on different agar media was com-pared using a mean-difference test and Bland–Altman plot of the percentage difference against the average [13], using GraphPad Prism (http://www.graphpad.com/). A percentage difference analysis was employed by which the difference between colony counts on THY-TTC and THY or HBA were divided by the mean of the two counts. This percentage difference was plotted on the Y axis and the mean of the two counts was plotted on the x axis. The bias is the mean of the percentage difference values and if the value is positive it reflects higher counts from the THY-TTC plates than the other method measured. The cut-off for significant percentage difference was 10 % and dilutions resulting in colony counts of under ten and over 200 were not included in analyses since plates with these extreme number of colonies do not provide accurate counting material [14, 15]. All cultures used were diluted tenfold serially in PBS and dilutions of 10−2–10−6 were
plated in triplicate. Comparisons between manual and automatic counting were made between each colony count from each technical replicate plated on both agar-media.
Results and discussion THY‑TTC plate preparation
We sought to determine the optimum temperature range for the preparation of THY-TTC agar plates. Analysis of the variance of the different temperatures compared with plating on HBA as a control (Fig. 1) indicates cooling and maintaining autoclaved agar between 45 and 60 °C prior to addition of TTC and pouring.
THY‑TTC plate expiration
Growth of mid‑log phase GAS on different plating media
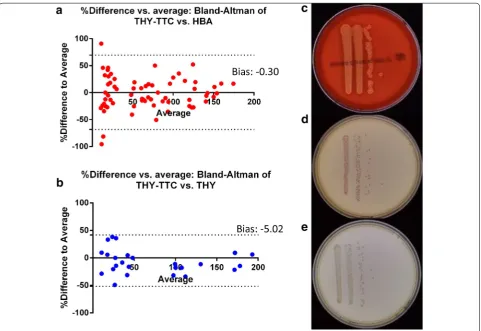
Strains representing the major emm-clusters were grown for 3–4 h to be at the mid-log phase of their respective growth cycles. Figure 3 shows the comparison between plating on THY-TTC and counting with automated col-ony counting and plating on HBA and manually counting colonies from 16 different strains (Table 1). GAS strains were selected to be representative of the major emm -clus-ters to ensure the broad range of M-protein variants were represented, as this protein probably plays an important role in the specific virulence of the strains [11, 16, 17]. All strains tested grew on THY-agar with TTC and were countable with the automated counting system, despite
occasional morphological colony variance. Figure 3 also shows the comparison between THY-TTC and THY-agar with no dye added to examine any detrimental effect of TTC on the growth of bacteria for strains emm1, emm2, emm3, emm4 and emm11. As the cut-off for agreement between the methods was ±10 % these analyses support the use of THY-TTC agar plates and automated colony counting. Importantly, the automatic colony counting allows for significant reduction in the time needed to count bacteria. The automatic counting protocol requires 30–40 s per plate while the manual counting takes and average of 4 min per plate.
Effect on plating bacteria in blood
Bactericidal assays were performed to determine if there was a difference between the plating methods in the presence of blood. Figure 4 is a compilation of numer-ous DBAs, performed on ten different GAS strains (Table 1) with blood from three different donors, plated on THY-TTC and HBA. These analyses were performed to confirm the contrast remains sufficient in the pres-ence of blood and also that there was no effect on the dye by components of blood. The observed bias of −4.65
(See figure on next page.)
Fig. 3 Growth of mid‑log phase GAS on different plating media. Bland–Altman percentage difference of THY‑agar, HBA and THY‑TTC. The plots compare each replicate of each dilution with the sample from the same culture plated on THY‑TTC agar and either HBA (a) or THY‑agar (b). The Y axis
is based on the formula [100 × (THY‑TTC agar–HBA or THY agar)/average of the two points] and the X axis is the average of the two points. The biases of −0.30 and −5.02 are less than the cut‑off of ±10 % which show plating on THY‑TTC is sufficiently analogous to plating on either of the currently accepted methods. The dotted-lines represent the 95 % limits of agreement and range from −69.09 to 68.48 with HBA and −51.83 to 41.80 with THY agar. c–e show representative images of cultures grown on HBA, THY‑TTC and THY‑agar respectively. For the comparison with HBA, a series of five dilutions was plated for 16 strains in triplicate, of which 70 counts fell between 10 and 200 colonies. For the comparison with THY‑agar, a series of five dilutions was plated for five strains in triplicate, of which 26 counts fell between 10 and 200 colonies
Fig. 2 Comparison between freshly prepared THY‑TTC plates and plates stored at 4 °C for 4 weeks. The analysis compares each replicate of each dilution with the sample from the same culture plated on the 4 week old plates and the fresh plates. The Y axis is based on the formula [100 × (4 week old plates–fresh plates)/average of the two points] and the X axis is the average of the two points. The bias of 5.01 indicates that plates maintain their utility for this period. The dotted-lines represent the 95 % limits of agreement and range from −51.79 to 61.80. For the comparison between the plates, a series of three dilutions were plated for four strains in duplicate, of which 17 counts fell between 10 and 200 colonies. Each point represents one dilution point of each replicate
Fig. 1 Analysis of the effect of different temperature media when TTC is added. a Analysis of variance of colony counts of an M25 culture serially diluted and plated in triplicate on agar prepared with addition of TTC at a range of temperatures. The average colony count from the 10−3 dilution on plates prepared at each temperature were
[image:4.595.57.289.89.343.2] [image:4.595.302.537.90.192.2]indicates this plating and counting method is suitable for use in the bactericidal assays.
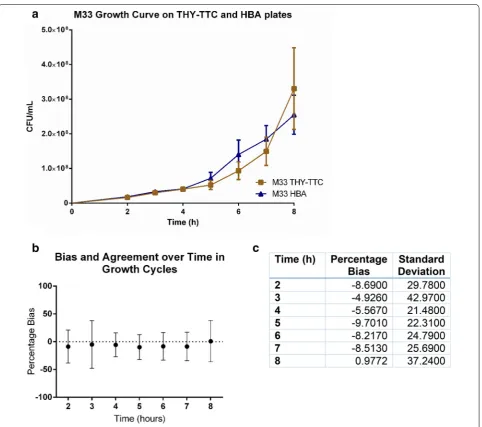
Efficacy in phases of growth cycle
As bacteria are known to express different genes over the various stages of the growth cycle, growth curves were performed on a number of strains to determine whether the presence of TTC caused inhibition to bacterial growth
[image:6.595.59.542.86.513.2]observed with TTC concentration of 0.5 mg/mL and was reversed when the concentration was lowered to 0.01 mg/ mL, the concentration utilised in our study of 0.04 mg/mL seems to be non-toxic to the bacteria.
Conclusion
In conclusion, we have shown that the use of TTC and an automated counting system for GAS is a viable alternative for the process of counting bacterial CFU, in a number of common assays and with a broad range of emm-types and emm-clusters. A detailed protocol of our final method is provided in Additional file 1. This method will aid to avoid the introduction of errors by manually counting, in addition to being far less time consuming. The automated counting system described herein will therefore be a use-ful addition to GAS research protocols, and further study may allow it be used for other beta-haemolytic strepto-cocci such as the group B Streptococcus.
Availability and requirements
The protocol for preparing the necessary agar plates and using the automated counting system has been provided in Additional file 1. Further information can be found on the Manufacturer’s website:
Project name: Automatic colony counting and zone measuring.
Project home page: http://www.synbiosis.com/protocol-3/. Operating system(s): Win7 compatible.
Programming language: NA.
Other requirements: Requires connection to a stand-alone desktop or laptop computer.
License: MS Excel licence required for some functions. Any restrictions to use by non-academics: NA.
Availability of supporting data
The data set supporting the results of this article is included within the article and its Additional file 1.
Abbreviations
CFU: colony forming unit; DBA: direct bactericidal assay; GAS: group A Strepto‑ coccus; HBA: horse blood agar; THY: Todd–Hewitt broth with yeast extract; TPF: triphenylformazan; TTC: triphenyl tetrazolium chloride.
Authors’ contributions
HF and PS were responsible for conception and study design. ST, CB and DL contributed to data collection and analysis. HF was responsible for data inter‑ pretation and drafting the manuscript. MSS participated in the design of the study and provided materials for use in assays. AS and PS contributed to data
Additional file
Additional file 1. Protocol GAS Automated Colony Counting on THY‑TTC Agar. A working protocol for the preparation of THY‑TTC agar plates, plating bacterial cultures and enumerating the resulting colonies with a Protocol‑3 automated colony counting system.
interpretation and writing of the manuscript. All authors read and approved the final manuscript.
Author details
1 Group A Streptococcus Research Group, Murdoch Childrens Research Insti‑
tute, Flemington Road, Parkville, Melbourne, VIC 3052, Australia. 2 Laboratoire
de Bactériologie Moléculaire, Université Libre de Bruxelles, Brussels, Belgium.
3 Illawarra Health and Medical Research Institute and School of Biological Sci‑
ences, University of Wollongong, Wollongong, Australia. 4 Centre for Interna‑
tional Child Health, University of Melbourne, Melbourne, Australia. 5 Depart‑
ment of General Medicine, Royal Children’s Hospital Melbourne, Melbourne, Australia.
Acknowledgements
The authors are supported by a National Health and Medical Research Council Grant (Project grant 1064408).
Competing interests
The authors declare that they have no competing interests.
Received: 26 May 2015 Accepted: 19 January 2016
References
1. Brugger SD, Baumberger C, Jost M, Jenni W, Brugger U, Mühlemann K. Automated counting of bacterial colony forming units on agar plates. PLoS One. 2012;7:e33695.
2. Kim KH, Yu J, Nahm MH. Efficiency of a pneumococcal opsonophagocytic killing assay improved by multiplexing and by coloring colonies. Clin Diagn Lab Immunol. 2003;10:616–21.
3. Ralph AP, Carapetis JR. Group a streptococcal diseases and their global burden. Curr Top Microbiol Immunol. 2013;368:1–27.
4. Junillon T, Vimont A, Mosticone D, Mallen B, Baril F, Rozand C, Flandrois J‑P. Simplified detection of food‑borne pathogens: an in situ high affinity capture and staining concept. J Microbiol Methods. 2012;91:501–5. 5. Kakimoto Y, Tsuruyama T, Miyao M, Abiru H, Sumiyoshi S, Kotani H, Haga
H, Tamaki K. The effectiveness and limitations of triphenyltetrazolium chloride to detect acute myocardial infarction at forensic autopsy. Am J Forensic Med Pathol. 2013;34:242–7.
6. Sun Y‑Y, Yang D, Kuan C‑Y. Mannitol‑facilitated perfusion staining with 2,3,5‑triphenyltetrazolium chloride (TTC) for detection of experimen‑ tal cerebral infarction and biochemical analysis. J Neurosci Methods. 2012;203:122–9.
7. Protocol for opsonophagocytic killing assay for antibodies against group B Streptococcus (vaccine.uab.edu).
8. Junillon T, Flandrois J‑P. Diminution of 2,3,5‑triphenyltetrazolium chloride toxicity on Listeria monocytogenes growth by iron source addition to the culture medium. Food Microbiol. 2014;38:1–5.
9. Moreland NJ, Waddington CS, Williamson DA, Sriskandan S, Smeesters PR, Proft T, Steer AC, Walker MJ, Baker EN, Baker MG, Lennon D, Dunbar R, Carapetis J, Fraser JD. Working towards a group A streptococcal vaccine: report of a collaborative Trans‑Tasman workshop. Vaccine. 2014;32:3713–20.
10. Sanderson‑Smith M, DeOliveira DMP, Guglielmini J, McMillan DJ, Vu T, Holien JK, Henningham A, Steer AC, Bessen DE, Dale JB, Curtis N, Beall BW, Walker MJ, Parker MW, Carapetis JR, Van Melderen L, Sriprakash KS, Smeesters PR. A systematic and functional classification of Streptococ-cus pyogenes that serves as a new tool for molecular typing and vaccine development. J Infect Dis. 2014;210(8):1325–38.
11. Johnson DR, Kaplan EL, Sramek J, Bicova R, Havlicek J, Havlickova H, Mot‑ lova J, Kriz P. Laboratory diagnosis of group A Streptococcal infections. Geneva: 1996.
12. Pridmore A. Evaluation of the ProtoCOL 3 instrument for enumeration of bacterial and fungal colonies on agar plates. West Yorkshire: 2012. p. 1–9. 13. Bland JM, Altman DG. Statistical methods for assessing agree‑
• We accept pre-submission inquiries
• Our selector tool helps you to find the most relevant journal
• We provide round the clock customer support
• Convenient online submission
• Thorough peer review
• Inclusion in PubMed and all major indexing services
• Maximum visibility for your research
Submit your manuscript at www.biomedcentral.com/submit
Submit your next manuscript to BioMed Central
and we will help you at every step:
14. Blodgett RJ. Mathematical treatment of plates with colony counts out‑ side the acceptable range. Food Microbiol. 2008;25:92–8.
15. Breed RS, Dotterrer WD. The number of colonies allowable on satisfactory agar plates. J Bacteriol. 1916;1:321–31.
16. Baroux N, D’Ortenzio E, Amedeo N, Baker C, Ali Alsuwayyid B, Dupont‑ Rouzeyrol M, O’Connor O, Steer A, Smeesters PR. The emm‑cluster typing
system for group A Streptococcus Identifies epidemiologic similarities across the Pacific region. Clin Infect Dis. 2014;59:e84–92.