Effect of the number of blades and solidity on the
performance of a vertical axis wind turbine
PL Delafin, T Nishino, L Wang, A Kolios
Centre for Offshore Renewable Energy Engineering, Cranfield University, Cranfield, MK43 0AL, UK
E-mail: [email protected]
Abstract. Two, three and four bladed Φ-shape Vertical Axis Wind Turbines are simulated
using a free-wake vortex model. Two versions of the three and four bladed turbines are considered, one having the same chord length as the two-bladed turbine and the other having the same solidity as the two-bladed turbine. Results of the two-bladed turbine are validated against published experimental data of power coefficient and instantaneous torque. The effect of solidity on the power coefficient is presented and the instantaneous torque, thrust and lateral force of the two-, three- and four-bladed turbines are compared for the same solidity. It is found that increasing the number of blades from two to three significantly reduces the torque, thrust and lateral force ripples. Adding a fourth blade further reduces the ripples except for the torque at low tip speed ratio. This work aims to help choosing the number of blades during the design phase of a vertical axis wind turbine.
1. Introduction
Recently, Vertical Axis Wind Turbines (VAWT’s) have been receiving increasing interest. They are seen as a good candidate for installation in highly turbulent flows (urban areas) [1] and also as a potential candidate for the future of large scale offshore wind turbines [2, 3, 4]. Their low centre of gravity, the accessibility of the drive train that can be installed just above sea level and the absence of cyclic gravitational loads on the blades give VAWT’s substantial advantages over conventional horizontal axis turbines, especially when large scale offshore turbines are considered. However, VAWT’s are known to generate highly fluctuating torque and thrust, which tends to make the design of turbine components more expensive to withstand fatigue loads.
VAWT’s generally use two or three blades but no specific rule exists regarding this choice, and earlier studies on this topic are limited. Marsh et al. [5] have studied both torque ripple and mounting forces (thrust and lateral forces) of a three-bladed VAWT. Their CFD study showed the effects of both location of the struts and shape of the arm/blade junction on the turbine efficiency. However, the effect of the number of blades on the torque ripple was not studied. Li et al. [6] have shown experimentally the effect of the number of blades on the averaged power, torque and thrust coefficients of a VAWT. The comparison was done with a constant chord length and therefore a different solidity for each configuration. Fluctuations of the turbine torque and forces were not directly assessed. Bedon et al. [7] have shown the effect of the number of blades on the torque ripple, thrust and lateral forces at a given solidity and for a single tip speed ratio (TSR), using a Double Muliple Streamtube (DMST) model. This type
of model, however, has recently been called into question regarding its accuracy in some cases [8].
The present study uses a free-wake vortex code to predict the aerodynamic performance of a full scale 3D-VAWT. The aim is to evaluate the effects of the number of blades and solidity on the aerodynamic performance of the turbine and on its thrust and lateral force ripples. Three tip speed ratios are studied in order to cover the operating range of VAWT’s.
2. Methods
2.1. Wind turbines and test conditions
The baseline wind turbine used in this study is the second version of the 17m-diameter (D) VAWT tested by Sandia National Laboratories in the 1980’s (Fig. 1(a), [9]). It is a two-bladed Φ-shape VAWT with a 0.51m diameter central tower and no strut. The aerodynamic cross section is a NACA 0015 with a 0.61m chord length (c). The turbine swept area is A= 187m2, the rotor height is 17m and the ground clearance is 4.88m.
Based on this design, four other turbines with three and four blades are considered (Fig. 1(b) and 1(c), respectively). For a given number of blades, two versions of turbine are studied: one with the same chord length and the other with the same solidity (σ =N cL/A, withN the number of blades and L the blade length) as the two-bladed turbine, as presented in Tab. 1. This study focuses on the rotational speed 38.7rpm at which torque measurements are available from TSR = 2 to TSR = 8 for the two-bladed turbine [10].
[image:2.595.106.488.389.497.2](a) (b) (c)
Figure 1. 2-bladed (a), 3-bladed (b) and 4-bladed (c) turbine shapes used in this study. The 2-bladed turbine is the same as the one used by Akins et al. [10] for field testing.
Table 1. Number of blades, chord length and solidity of the turbines studied.
Turbine Number of blades,N Chord length, c(m) Solidity,σ
A 2 0.610 0.16
B 3 0.610 0.24
C 4 0.610 0.32
D 3 0.406 0.16
E 4 0.305 0.16
Wind speeds are given at the turbine mid-height (13.5m from the ground) and a sheared wind profile is assumed based on the power law (Ux(z) =U∞×(z/Zref)a). zis the height above
ground,Zref is the turbine mid-height,U∞is the upstream wind speed atZref used to calculate
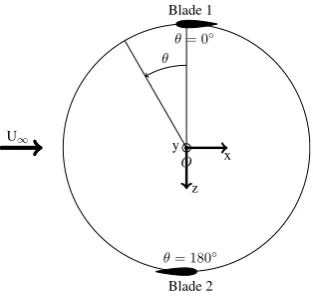
[image:2.595.131.465.599.688.2]1 kg/m3, corresponding to a normal air density at the test facility (located at a high altitude). The coordinate frame used in this study is presented in Fig. 2.
O θ
U∞
x
z y θ= 0◦
θ= 180◦
[image:3.595.220.377.151.303.2]Blade 2 Blade 1
Figure 2. Coordinate frame used in this study (shown for turbine A).
2.2. Numerical method
CACTUS is a three-dimensional free-vortex code using a lifting line approximation to model the blades [12]. Each blade is discretized into a number of blade elements containing a bound vortex line. The wake is represented by a time-dependent vortex lattice. At each time step, each blade element produces a new shed vortex line segment connected to the bound vortex by two trailing vortex line segments. The velocity field induced by the entire vortex system is calculated using the Biot-Savart law.
The calculations performed in this study take into account the wind shear and use the Leishman-Beddoes dynamic stall model. Following the results of a convergence study, each blade is represented by 27 elements and 40 time steps are used per rotor revolution. Calculations are run for a number of revolutions which leads to a difference of power coefficient less than 0.7% between the last two revolutions. The number of revolutions required varies from 4 (low TSR) to 20 (high TSR).
3. Results and discussion
3.1. Power coefficient
The averaged power coefficient (CP) curve depends on the solidity of the turbine. Figure 3 shows that the calculations of the two-bladed turbine (A) agree fairly well with the corresponding experiments [10]. If we increase the solidity by increasing the number of blades, power curves are shifted toward lower tip speed ratios (TSR). This behavior is in agreement with earlier numerical [13, 14] and experimental [6, 15] results. However, numerical results (including the current results) show that CPmax increases with the solidity, unlike with the experiments where
CPmax remains the same. This difference can be explained by the presence of struts in the
experiments [6, 15] whereas the numerical studies either do not take them into account [13, 14] or are based on a turbine configuration that does not employ struts (the present case, Fig. 1). When increasing the number of blades, the overall drag generated by the struts increases while the torque produced by each blade decreases [6]. The performance improvement expected with the higher number of blades is thus balanced by the increased drag of the struts.
0 2 4 6 8 0
0.1 0.2 0.3 0.4
Tip Speed Ratio
Po
wer
Coef
ficient
(CP)
[image:4.595.172.427.110.273.2]Akins et al. A B C D E
Figure 3. Power curves for five different turbine models.
3.2. Torque coefficient
Figure 4 shows the torque coefficient (CQ = Q/(0.5ρU∞2 AR), with Q the turbine torque and
R its radius) of turbines A, D and E. These three turbines have the same solidity and thus, torque fluctuations are compared for similar power outputs. Experimental data corresponding to turbine A have also been plotted for comparison.
For turbine A, the calculation overestimates the peak torque at TSR = 2.02 but, away from the azimuth corresponding to the peak torque, agreement is good. At TSR = 4.6, the agreement between the calculation and the experiments is very good except that there is a small offset in azimuth between the two curves. However, it should be mentioned that experimental torque data are given with a ±6◦ accuracy ’at best’ for the azimuthal angle [10]. At TSR = 7.98,
the calculation overestimates torque values (also seen in Fig. 3) but gives a good estimation of the amplitude of its fluctuations. Overall, the comparison shows that the torque predicted by the calculations agrees well with the experiments at TSR = 4.6 while at TSR = 2.02 and TSR = 7.98, agreement is not so good but the trends of the experimental curves are well predicted. This gives confidence in the applicability of the free vortex code to the present study.
0 40 80 120 160 200 240 280 320 360
−0.05 0 0.05 0.1 0.15 0.2
Azimuth (◦)
Torque coef ficient ( CQ )
Akins et al. A D E
(a)
0 40 80 120 160 200 240 280 320 360
−0.05 0 0.05 0.1 0.15 0.2
Azimuth (◦)
Torque coef ficient ( CQ )
Akins et al. A D E
(b)
0 40 80 120 160 200 240 280 320 360
−0.05 0 0.05 0.1 0.15 0.2
Azimuth (◦)
Torque coef ficient ( CQ )
Akins et al. A D E
[image:4.595.83.522.530.676.2](c)
Figure 4. Instantaneous torque coefficient at TSR = 2.02 (a), TSR = 4.6 (b) and TSR = 7.98 (c). Comparison of CACTUS calculations and experimental data from Akins et al. [10].
al. [5]. The torque ripple factor is decreased by a factor of 2 at TSR = 2.02 and TSR = 7.98 and by 73% at TSR = 4.6 (Tab. 2). Adding a fourth blade further reduces the torque ripple at TSR = 4.6 and 7.98 but does not reduce it further at TSR = 2.02 (Tab. 2). Although the actual torque ripple will be partly smoothed by the inertia of the rotor, the reduction of the peak aerodynamic torque obtained by increasing the number of blades is of particular interest for the drive train design.
Table 2. Variations of torque ripple factor (CQ max−CQ min).
TSR 2.02 4.6 7.98
2-bladed (A) 0.121 (ref) 0.184 (ref) 0.130 (ref) 3-bladed (D) 0.062 (-48.7%) 0.051 (-72.5%) 0.063 (-51.7%) 4-bladed (E) 0.065 (-46.2%) 0.015 (-92.0%) 0.006 (-95.7%)
3.3. Thrust and lateral force coefficients
Lateral force and thrust are important for the structural design of the foundations, tower and bearings of a turbine [16]. Fluctuations of these forces generate fatigue loads and may therefore increase the capital cost. This section presents the thrust and lateral force coefficients (CT = (T hrust)/(0.5ρU∞2A) andCLat = (Lateralf orce)/(0.5ρU∞2A), respectively) of turbines
A, D and E, as well as the thrust and lateral force ripple coefficients, similar to the torque ripple coefficient (CT max−CT min and CLat max−CLat min, respectively).
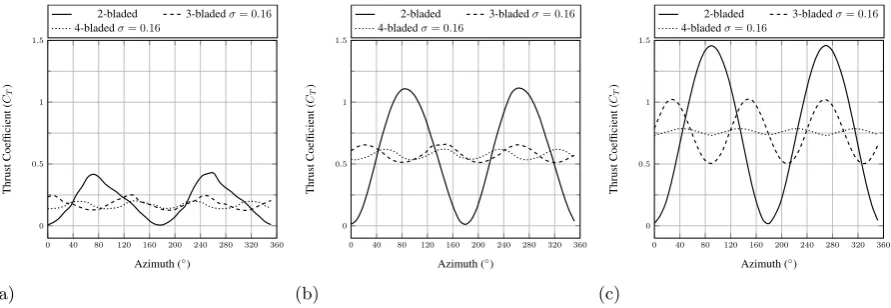
Figure 5 shows that, similarly to the torque, increasing the number of blades from two to three significantly smooths the thrust ripple, in agreement with results from Bedon et al. [7]. The thrust ripple factor is reduced by 71% at TSR = 2.02, by 64% at TSR = 7.98 and up to 87% at TSR = 4.6 (Tab. 3). The four-bladed turbine leads to further reduced thrust ripples for every TSR, especially at TSR = 7.98 (Tab. 3). With the average thrust remaining more or less the same for turbines A, D and E, it is interesting to note that adding a third or a fourth blade not only decreases the ripple but also reduces the maximum thrust generated by the turbine, which is interesting from a structural point of view.
0 40 80 120 160 200 240 280 320 360 0
0.5 1 1.5
Azimuth (◦)
Thrust
Coef
ficient
(
CT
)
2-bladed 3-bladedσ= 0.16
4-bladedσ= 0.16
(a)
0 40 80 120 160 200 240 280 320 360 0
0.5 1 1.5
Azimuth (◦)
Thrust
Coef
ficient
(
CT
)
2-bladed 3-bladedσ= 0.16
4-bladedσ= 0.16
(b)
0 40 80 120 160 200 240 280 320 360 0
0.5 1 1.5
Azimuth (◦)
Thrust
Coef
ficient
(
CT
)
2-bladed 3-bladedσ= 0.16
4-bladedσ= 0.16
[image:5.595.76.522.586.740.2](c)
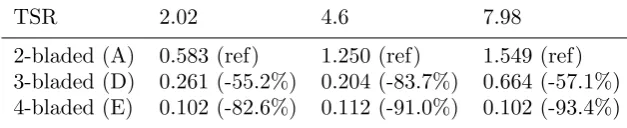
Table 3. Thrust ripple factor (CT max−CT min) of turbines A, D and E.
TSR 2.02 4.6 7.98
2-bladed (A) 0.419 (ref) 1.101 (ref) 1.441 (ref) 3-bladed (D) 0.123 (-70.7%) 0.148 (-86.6%) 0.519 (-64%) 4-bladed (E) 0.064 (-84.7%) 0.085 (-92.3%) 0.056 (-96.1%)
The same trends as presented for both torque and thrust ripples are observed for the lateral force. Particularly, Fig. 6 and Tab. 4 show that the three-bladed turbine is characterized by smaller lateral force coefficient variations compared to the two-bladed turbine. This does not agree with results from Bedon et al. [7] who show the opposite. However, the current results seem to be logical, when looking at the single blades lateral force coefficient (Fig. 7). For the two-bladed turbine, the peak lateral force coefficient of blades 1 and 2 are positive (or negative) at the same time. The turbine peak lateral force coefficient is therefore higher than for a single blade. For the three-bladed turbine however, when one blade reaches its peak lateral force coefficient, the two other blades produce a negative lateral force coefficient which balances lateral force for the entire turbine.
0 40 80 120 160 200 240 280 320 360
−1
−0.5 0 0.5 1
Azimuth (◦)
Lateral
Force
Coef
ficient
(
CLat
)
2-bladed 3-bladedσ= 0.16
4-bladedσ= 0.16
(a)
0 40 80 120 160 200 240 280 320 360
−1
−0.5 0 0.5 1
Azimuth (◦)
Lateral
Force
Coef
ficient
(
CLat
)
2-bladed 3-bladedσ= 0.16
4-bladedσ= 0.16
(b)
0 40 80 120 160 200 240 280 320 360
−1
−0.5 0 0.5 1
Azimuth (◦)
Lateral
Force
Coef
ficient
(
CLat
)
2-bladed 3-bladedσ= 0.16
4-bladedσ= 0.16
[image:6.595.79.521.404.558.2](c)
Figure 6. Instantaneous lateral force coefficient at TSR = 2.02 (a), TSR = 4.6 (b) and TSR = 7.98 (c).
Table 4. Lateral force ripple factor (CLat max−CLat min) of turbines A, D and E.
TSR 2.02 4.6 7.98
[image:6.595.137.451.662.726.2]0 40 80 120 160 200 240 280 320 360
−0.5
0 0.5
Azimuth (◦)
Lateral
Force
Coef
ficient
(
CLat
) Blade 1 Blade 2
(a)
0 40 80 120 160 200 240 280 320 360
−0.5
0 0.5
Azimuth (◦)
Lateral
Force
Coef
ficient
(
CLat
) Blade 1 Blade 2 Blade 3
[image:7.595.87.508.111.291.2](b)
Figure 7. Instantaneous blade lateral force coefficient at TSR = 4.6 for turbines A (a) and turbine D (b).
4. Conclusions
In this work, a vortex model has been used to predict the power coefficient and the instantaneous torque, thrust and lateral forces of five different turbines designed based on the Sandia 17-m vertical axis wind turbine, employing two, three and four blades. Two versions of the three-and four-bladed turbines are studied: one with the same chord length as the two-bladed turbine and the other with the same solidity as the two-bladed turbine. The results of the two-bladed turbine are validated against experimental power coefficient and instantaneous torque measured at three tip speed ratios, covering a typical operating range of vertical axis wind turbines. The following conclusions can be drawn from the present study:
(i) Increasing the number of blades while keeping the same solidity gives similar power curves. (ii) With a constant solidity, increasing the number of blades from two to three significantly
reduces the torque, thrust and lateral force ripples at all tip speed ratios.
(iii) With a constant solidity, increasing the number of blades from three to four further reduces torque, thrust and lateral force ripples, except for the torque ripple at low tip speed ratio.
Opting for an additional blade reduces the maximum loads generated by the turbine but it also increases the frequency of these loads. However, the reduction of maximum thrust and lateral force obtained by the use of a third or even a fourth blade seems to be significant enough to improve the design life of the turbine (or allow the use of less material). Finally, in future studies these aerodynamic considerations should be coupled with a cost analysis, specific to a given turbine, to see if the cost of adding an extra blade is lower than the savings it would lead to.
References
[1] Mertens S 2002 Wind energy in urban areas: concentrator effects for wind turbines close to buildingsRefocus
322-24
[2] Owens B and Griffith D 2014 Aeroelastic stability investigation for large-scale vertical axis wind turbinesJ.
Phys.: Conf. Series 524(The Science of Making Torque from Wind 2014, Lyngby, Denmark) 012092
[3] Paulsen U, Madsen H, Hattel J, Baran I and Nielsen P 2013 Design optimization of a 5 MW floating offshore vertical-axis wind turbineDeepWind’2013
[5] Marsh P, Ranmuthugala D, Penesis I and Thomas G 2015 Three-dimensional numerical simulations of straight-bladed vertical axis tidal turbines investigating power output, torque ripple and mounting forces Renew
Energ 8367-77
[6] Li Q, Maeda T, Kamada Y, Murata J, Furukawa K and Yamamoto M 2015 Effect of number of blades on aerodynamic forces on a straight-bladed vertical axis wind turbineEnergy90784-795
[7] Bedon G, Paulsen US, Madsen HA, Belloni F, Castelli MR and Benini E 2015 Computational assessment of the Deep Wind aerodynamic performance with different blade and airfoil configurationsAppl Energ
[8] Simao Ferreira C, Madsen HA, Barone M, Roscher B, Deglaire P and Arduin I 2014 Comparison of aerodynamic models for vertical axis wind turbines.J. Phys.: Conf. Series 524 (The Science of Making Torque from Wind 2014, Lyngby, Denmark) 012125
[9] Worstell MH 1981 Aerodynamic performance of the DOE/Sandia 17-m diameter vertical axis wind turbineJ
Energ 39-42
[10] Akins R, Berg D, Cyrus W 1987 Measurements and calculations of aerodynamic torques for a vertical-axis wind turbineTech RepSAND86-2164, Sandia National Laboratories
[11] Worstell MH 1978 Aerodynamic performance of the 17 meter diameter darrieus wind turbine Tech Rep
SAND78-1737, Sandia National Laboratories
[12] Murray J and Barone M 2011 The development of CACTUS, a wind and marine turbine performance simulation code49th AIAA Aerospace Sciences Meeting (4-7 January 2011, Orlando, Florida)
[13] Paraschivoiu I 2002Wind Turbine Design: with Emphasis on Darrieus Concept Polytechnic Int Press [14] Eboibi O, Danao LA, Howell R and Edwards JM 2013 A numerical study of the influence of blade profile and
solidity on the performance of vertical axis wind turbines51st AIAA Aerospace Sciences Meeting (07-10 January, Grapevine, Texas)
[15] Worstell MH 1982 Aerodynamic performance of the 17-m-diameter Darrieus wind turbine in the three-bladed configuration: an addendumTech RepSAND79-1753, Sandia National Laboratories
[16] Kolios A, Chahardehi A and Brennan F 2013 Experimental determination of the overturning moment and net lateral force generated by a novel vertical axis wind turbine: experiment design under load uncertainty