Abstract: This research Paper examines the export competiveness of oilseeds. The main and huge production in agriculture is oilseeds which make India on the first number in Production of oilseeds in the world. Oilseeds compose one of the significant groups of cash crops in Indian agriculture. India has a proportional benefit in agriculture and there is a considerable potential in raising farm returns and employment by stepping up agro base exports. The constant market share (CONSTANT MARKET SHARE) study framework is used to decompose changes in India’s share of the worldwide market for goods export in to competitiveness and structural consequence over 2001-2017. The CONSTANT MARKET SHARE Method is universally used to observe empirically the country’s export performance. This paper is addressed to examine the regions export performance by applying CONSTANT MARKET SHARE Method.
Index Terms: CONSTANT MARKET SHARE, Export, Export Competitiveness, Trade Specialization, Groundnut, Oilseed, Export Potential.
I.INTRODUCTION
For economic strength of entire world it is essential that international trade grows. The growth of international trade is directly related to import and export. Two biggest challenges of international trade is sudden change of policies and unawareness of trade rules of particular country. There was a necessity of a global body that can provide international traders confidence to trade across the planet.[5] Until 1991 the trade in agriculture was heavily controlled by government interventions, namely tariff and non-tariff barriers, quantitative restrictions, licensing and canalization and subsidies. Economic reforms in the early 1990s followed by establishment of WORLD TRADE ORGANIZATION in 1995 changed agricultural trade rapidly.[6] Trade liberalization led to greater integration of world economies. It opened up new opportunities, challenges and competition in agricultural markets (Jagdambe 2016). Studies shows mixed effect of liberalisation on Indian agricultural trade (Bhalla 2004; Karnool et al. 2007; Angles et al. 2011; Sharma 2013). In order to boost agriculture exports it becomes indispensable to assess the competitiveness of agricultural exports. We couldn’t come across any study that
Revised Manuscript Received on July 02, 2019.
Anudeep Arora, Assistant Professor, Kamal Institute of Higher Education and Advance Technology,Affilated to IP university, New Delhi, India
Dr.Durgesh Batra, Associate Professor Amity University Jaipur, India .
focuses on competitiveness of groundnut from India other than Rani et al.
(2014). Therefore, competitiveness of Indian groundnut in post- WORLD TRADE ORGANIZATION period is crucial to analyse its sustainability in domestic and international markets. This study has made a modest attempt to analyse competitiveness of India’s groundnut export using CONSTANT MARKET SHARE approach.
Oilseeds constitute one of the important groups of cash crops in Indian agriculture. They are the most important sources of supply of edible oils in the country. Indian vegetable oil economy is the fourth largest in the world, next only to that of USA, China and Brazil, accounting for about 14 per cent of world oilseed area and 7 per cent of global production. However, the productivity in India is low, only 986 kg/ha (2003) as compared to the world average of 1777 kg/ha (2003).[6] The oilseed sector has been playing a major role in reducing the gap in domestic demand and supply, and is also earning valuable foreign exchange from its byproducts (Virupakshappa and Kiresur, 1998). The oilseed scenario in the country has undergone a sea change during the past twenty years.[14] India emerged as a net exporter of edible oil in 1990s from a net importer during the early 1980s. However, it has again become a net importer, accounting for more than 40 per cent of annual edible oil needs. India has a comparative advantage in agriculture, and there is a considerable potential in raising farm income and employment by stepping up agro-based exports. Economic integration and trade liberalization will have a great impact on the national economy in general, and on the agricultural sector in particular. It will be a good opportunity to expand markets and acquire advanced technologies from the developed countries.[16]
II. REVIEW OF LITERATURE
Samar Verma (November, 2002) researched and take a deep dig into “Export Competitiveness of Indian Textile and Garment Industry” massively where he originate the competitiveness is expanding day by day in coming era for all the firms including clothes and textiles. Indian textile and clothing industry takes a considerable place in Indian economy which contributes about 4% of GDP and 14% of industrial output. This is the second largest employer after agriculture. It reveals that
agriculture is the first largest containing employer. This study has also clarified &
Export Competitiveness of Indian Oilseeds: The
Method of Constant Market Share (CMS) with
Special Reference to Groundnut
examined the India’s competitive performance in two international EU and US markets for (ATC) product categories which all are important for Indian export. He also found the Indian exports to the US and EU are the whole export competitive. It has also delineated the changing landscape in the international trading environment which is likely to be extensively get a impact on global textile and clothing trade.
Widgren (2005) on the comparative benefit of a sample of Asian, American and European countries from 1996 to 2002. His probe is into mostly used the data of HS classification at the 4-digit level. He studied the source of comparative advantage and came to the following conclusion. In the context of the Asian continent, the factor content of comparative advantage had some kind of similarity. Whereas in the case of the US, it was basically based on highly expert labour and for the EU, it moved towards use of human as well as physical capital.
Ranjana Kumar (2005) reported in his worked that “Constrains facing Indian agriculture: Need for policy intervention” India continues to be predominantly an agrarian economy and without improvements and development in this sector, the economy as a whole cannot anticipate achieving and maintaining a balanced and sustainable development trend.
RS Deshpande (March, 2005) has researched that after the review in Karnataka, he come across with looking at the economy factor of Karnataka state all over peers it entirely depends upon the agriculture. The mostly part of the Karnataka is enclosed by the agriculture. Karnataka is also having mostly poor population which is located in rural areas among the agriculture laborers this shows that most of the poor population do the agriculture which makes the Karnataka strong in their back bone because Karnataka state is having the large production of agriculture and hence for increasing their motherland export market recently Karnataka emergence as an important partner in boosting up the export growth of the country. Among all other states in the production Karnataka comes on a medium level. HailegiorgisBiramoAllaro (2011) researched on “Export Performance of Oilseeds and ITS Determinants in Ethiopia”than he found the export presentation of the oilseed over the period 1974 – 2009. The Ethiopia country still depends upon the few product of agriculture. This research also examines the coefficients of real output and nominal exchange. In Ethiopia technology were applied for agriculture production. This theory studies over the last half of 18th century when Adam Smith realized the significance of specialization. Ethiopia also do the trade of oilseed over the world. Ethiopia exports the oilseeds in world market. He also explained the major oil seeds worldwide are: Soybean, rapeseed, cottonseed, safflower seed, groundnut, palm, copra, Sesame, Castro seed, maize oil and coconut oil. The major producers of oilseeds are India, China, US, Europe, Canada and Brazil. All these countries have the large production of oilseed across the world. Ethiopia is only 500m above from the sea level so Ethiopia has a very different climate so the production of oilseed in Ethiopia is very less.
Oilseed is only the one crop which is second largest earner for the country in agriculture trade.
Shoufeng et.al (2011) analyses the export competitiveness of agricultural products between China and Central Asian countries by using the RCA index and trade competitiveness index, came to the following conclusions: (1) China’s total agriculture products do not have comparative advantage while Central Asian countries have changed from comparative advantage into comparative 4 disadvantage, (2) The total agri-products of both China and Central Asian countries have changed from trade competitive advantage to trade competitive disadvantage, (3) China and Central Asian countries have different advantage structures on specific categories of agricultural products, which presents vast bilateral trade potential on the basis of comparative advantage.
Dr. N C Pahariya (2014) researched on “Impact Assessment of Trade Liberalisation in Oilseeds Sector: Rajasthan” than he originated and came up with that India followed different types of oilseed policies until 1994 which gave different types of benefits in oilseed sector. It means all the policies followed for oilseed they all are followed before establishing the WORLD TRADE ORGANIZATION agreement on oilseed in 1995. These all policies was not only able to double the oilseed output and stabilize the oilseed production but these also use to production of new crops like soybean, sunflower etc. even for those areas where poor farmers typically face more limited growth opportunities. In 1990’s India was more self sufficient in edible oils and a large exporter in oilseeds. This represent that India is always a large exporter in oilseeds which represent India always has good creation of oilseeds this make India unique and put India among those countries who have large market share of oilseed in world market. In the mid of 1990’s cheaper imports and faster economic growth accelerates the demand of edible oils which was imported sufficiently according to the demand. The trade liberalization in oilseed sector initiated in 1994-45.
DushyantKumar(Feb,2015) researched on “EXPORT COMPETITIVENESS OF INDIAN TEXTILE INDUSTRY” and subsequently he followed that sectoral structure of world trade and country condition in competitiveness reflect in its export performance. Whereas Dushyant Kumar imply those methods which is constant market share (CONSTANT MARKET SHARE) to analyze the constant measures in variations market share found that the geographical structure of exports. Dushyant Kumar essentially analyzes the export performance and export competitiveness from 2010 to 2013. He created and come across with both export performance and export competitiveness more than three years and groping in depth for both export performance competitiveness he applied Balassa (1965) formula where he get a hold on Revealed Comparative Advantage (RCA) which represent the competitiveness of the
export competitiveness all the required data occupied from Indian Trade Center (ITC) which is used as source of statistics.
Sunil Kumar Niranjan (2016) whereas he researched and after the study on WORLD TRADE ORGANIZATION agreements in India that the WORLD TRADE ORGANIZATION agreement and other previous agreement like GATT they all put a great impact on all different sectors of the India either it is industry or any trading business but the major effect of this agreement is on agriculture of India because Indian economy is mainly depend upon the agriculture if the trade of agriculture increase than Indian economy increase also. Here Sunil Kumar Niranjan also did some researches on the way of imports and exports he find out and come across that how do India agriculture trade in and sell overseas what are their level of creative ideas and outline to promote import and export since 1995 and he also analyze the trend of export and imports since 1995 of the India. Here he mainly illustrate & explain the agriculture trade after establishing the WORLD TRADE ORGANIZATION. It reveals that WORLD TRADE ORGANIZATION is the successor over the GATT. There were 77 countries member when WORLD TRADE ORGANIZATION established on 1 Jan 1995 and there are 154 countries have member of WORLD TRADE ORGANIZATION by 2011. Leading aim and principles of WORLD TRADE ORGANIZATION was to enlarge the economic factor for the trade in goods and services to increase the living standard of member countries still Indian trade did not add on or put any effort to enhance enough as much we expected and neither had we seen any change in the living standard of India.
Girish Kumar Gupta and Mohd.Asif Khan (2017) take a deep dig into it and scrutinize on “Exports Competitiveness of the Indian Textile Industry throughout and after ATC” later than he started and initiate with the level of the output productivity of the country by calculating the export competitiveness. Here he make clear and enlighten the way to calculate the export competitiveness. He also enlighten & examines the International market share, Revealed Comparative Advantage (RCA), Compound Annual Growth Rate (CAGR) and Coefficient variation. In favor of considering all these results all the data occupied from International Trade Center (ITC). He also examined that the country is growing on the rise in the production of textiles. It also examines comparative analysis. If we see according to the % share point of view than India and China are the most competitive country but Brazil did not get better to progress its position after ATC.
III. OBJECTIVES
1. To examine the export performance of Indian oilseeds. 2. To analysis the competitiveness of Indian oilseed for period of 2001 to 2017.
IV. RESEARCH METHODOLOGY
To achieve the objectives of the paper the study employs two economic methodologies. Firstly it uses various Revealed
Comparative Advantage’s and then CONSTANT MARKET SHARE (Constant Market Share).
Measures of revealed comparative advantage (RCA) have been used to help assess a country’s export potential. The RCA indicates whether a country is in the process of extending the products in which it has a trade potential, as opposed to situations in which the number of products that can be competitively exported is static. [1][2]
Balassa - RCA Index
Bela Balassa introduced the revealed comparative index to measure the comparative advantage of any country. According to Balassa (1979, 1986, 1989) when the factor costs related data are not available, comparative advantage of a country can be revealed with the help of relative costs and differences in various factors other than price as indicated by pattern of exports. Balassa’s Revealed Comparative Advantage (RCA) Index known as Balassa Index is more likely an index of revealed export advantage (RXA) [1] The RCA index of country I for product j is often measured by the product’s share in the country’s exports in relation to its share in world trade:
RCAij = RXA=(xij/Xit) / (xwj/Xwt) (1)
Where xij and xwj are the values of country i’s exports of product j and world exports of product j and where Xit and Xwt refer to the country’s total exports and world total exports. A value of less than unity implies that the country has a revealed comparative disadvantage in the product. Similarly, if the index exceeds unity, the country is said to have a revealed comparative advantage in the product. Vollrath- Alternative RCA Indices
One major censure has been identified in Balassa’s RCA is the oversight of imports; this index reveals only export advantage of nation rather than the comparative advantage. In 1991, Thomas Lachlan Vollrath has proposed three alternative RCA indices to measure the revealed comparative advantage of nation. The first, the relative trade advantage (RTA) is can be expressed as:
RCAij=RTA=RXA-RMA= (2)
Here all variables are same as in RCA expect M represents imports.
The second measure is the logarithm of the relative export advantage (ln RXA ) is expressed as:
RCAij= ln RXA=ln {(Xij/Xit) / (Xwj/Xwt)} (3) The third Vollrath measure is revealed competitiveness (RC) can be defined as:
RCAij=ln RXA-ln RMA= (4)
If the values of all three of Vollrath’s measures are positive it shows a competitive advantage of country in that product while negative values imply
CONSTANT MARKET SHARE (CMS)
Constant Market Share method decomposes the export growth to provide a better understanding of whether this growth is coming from increased competitiveness or resulting from various other structural factors. Constant Market Share (CMS) technique facilitates to comprehend about export performance of a selected country or group of countries vis-à-vis to their competitors in choosing fast growing markets (product or destination or sectors). According to the CMS model the export growth of concern country can attribute to structural or competitive factors as below:
Structural Effects or Demand Effects
a. General Rise in World's Demand/Import b. Product/Commodity Composition Effects c. Market Distribution Effects
Competitivness Effects
The four key components of CONSTANT MARKET SHARE model which play a vital role in country’s export performance are World Trade Effect (WTE); Commodity Composition Effects (CCE); Market Distribution Effects (MDE) and Competitiveness Effects (CE).
The CONSTANT MARKET SHARE model, as applied in this study, can be numerically presented as:
Here, Superscript 1 and 0 1 = Terminal time period 0 = Initial time period
i = 1,2…..n = Number of commodities j = 1,2…..n = Number of markets
qi0=Total exports by the focus country of commodity i, in the initial period
qi1=Total exports by the focus country of commodity i, in the terminal period
Period of analysis
The study focuses on to analyze the competitiveness of Indian oilseeds specially groundnut (HS code 1202). For the purpose this study uses primarily various methods of RCA and finally CONSTANT MARKET SHARE. The time period use for RCA(Revealed Comparative Advantage) is from 2008 to 2017, whereas to apply CONSTANT MARKET SHARE two periods have been used 2000-2006 and 2007-17 because of WORLD TRADE ORGANIZATION agreement which start impacting from 2007.
V. RESULTS
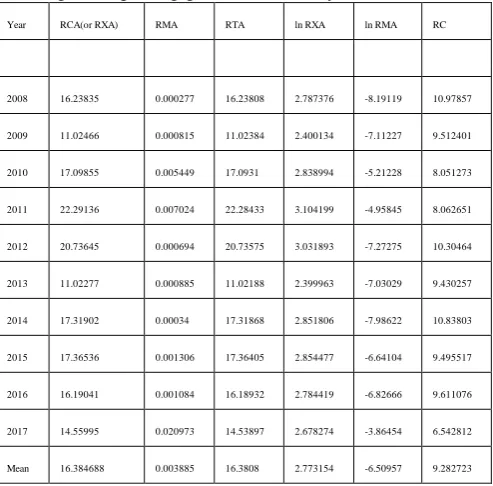
[image:4.595.308.555.354.597.2]The analysis employs Revealed Comparative Advantage Indices as indicated in the following table. The RCA introduced by Bela Balassa, known as Balassa Index. RCA index value greater than 1 indicates that country has comparative advantage in the export of product in the world market and the RCA index value lesser than 1 shows that country has comparative disadvantage in the world market. In 1991, Thomas Lachlan Vollrath has proposed three alternative RCA indices to measure the revealed comparative advantage of nation; the Relative trade advantage (RTA), the logarithm of the relative export advantage (ln RXA) and the Vollrath measure of revealed competitiveness (RC). [1][2][6] To overcome the problem of upward-biased RCA index values, Laursen (1998) adjusts the RCA index to make it symmetric, such that the adjusted index values are between –1 and +1. Positive (negative) values of following RC’s show a competitive advantage (disadvantage) in exporting product in the world market.
Table I: RCA Calculations
The above table with various methodologies of Relative Competitiveness indicates that India has the competitive advantage in exporting groundnuts from year 2008 to 2017.
The mean values of all the RC’s are above >1 (other than 0.003885) and thus India has a comparative advantage in export of oilseeds specially groundnuts.
Further to analyze the competitiveness from the changes in the export performance of a country the Constant Market Share (CMS) model is widely used. The CMS analysis can be applied as a descriptive or diagnostic tool (Ahmadi Esfahani, 2006). This model decomposed into four structural components that could cause changes in the country’s export share overtime.
Constant market share calculations
Table II: CONSTANT MARKET SHARE Calculations
Year RCA(or RXA) RMA RTA ln RXA ln RMA RC
2008 16.23835 0.000277 16.23808 2.787376 -8.19119 10.97857
2009 11.02466 0.000815 11.02384 2.400134 -7.11227 9.512401
2010 17.09855 0.005449 17.0931 2.838994 -5.21228 8.051273
2011 22.29136 0.007024 22.28433 3.104199 -4.95845 8.062651
2012 20.73645 0.000694 20.73575 3.031893 -7.27275 10.30464
2013 11.02277 0.000885 11.02188 2.399963 -7.03029 9.430257
2014 17.31902 0.00034 17.31868 2.851806 -7.98622 10.83803
2015 17.36536 0.001306 17.36405 2.854477 -6.64104 9.495517
2016 16.19041 0.001084 16.18932 2.784419 -6.82666 9.611076
2017 14.55995 0.020973 14.53897 2.678274 -3.86454 6.542812
Country (2001-2006) qo AVERAGE (2007-17) q1 AVERAGE q1-q0 r rq0 r1 r1q0 r1q0 - rq0
Albania 0 82.81818182 82.81818 1.898807 0 2.002039 0 0
Algeria 370 7681.454545 7311.455 1.898807 702.5588 2.002039 740.7544 38.19564
Angola 0 56.72727273 56.72727 1.898807 0 2.002039 0 0
Armenia 0 18.90909091 18.90909 1.898807 0 2.002039 0 0
Australia 10.5 24.45454545 13.95455 1.898807 19.93748 2.002039 21.02141 1.08393
Austria 0.333333333 1.545454545 1.212121 1.898807 0.632936 2.002039 0.667346 0.03441
Azerbaijan 0 35.63636364 35.63636 1.898807 0 2.002039 0 0
Bahrain 11.16666667 105.6363636 94.4697 1.898807 21.20335 2.002039 22.3561 1.152751
Bangladesh 42.83333333 370.8181818 327.9848 1.898807 81.33225 2.002039 85.754 4.421748
Belarus 4.666666667 192 187.3333 1.898807 8.861102 2.002039 9.342848 0.481747
Belgium 339.8333333 307.9090909 -31.9242 1.898807 645.2781 2.002039 680.3596 35.08149
Bhutan 0 6.090909091 6.090909 1.898807 0 2.002039 0 0
Bosnia and
Herzegovina 0 56.45454545 56.45455 1.898807 0 2.002039 0 0
Botswana 0 0.181818182 0.181818 1.898807 0 2.002039 0 0
Brazil 1.166666667 13.63636364 12.4697 1.898807 2.215275 2.002039 2.335712 0.120437
Brunei Darussalam 96 454.0909091 358.0909 1.898807 182.2855 2.002039 192.1957 9.91022
Bulgaria 104.1666667 156.1818182 52.01515 1.898807 197.7924 2.002039 208.5457 10.75328
Cabo Verde 0 10.18181818 10.18182 1.898807 0 2.002039 0 0
Cambodia 0 633.7272727 633.7273 1.898807 0 2.002039 0 0
Canada 487 593.1818182 106.1818 1.898807 924.7192 2.002039 974.993 50.27372
China 74 14679.27273 14605.27 1.898807 140.5118 2.002039 148.1509 7.639128
Colombia 0 188.8181818 188.8182 1.898807 0 2.002039 0 0
Costa Rica 0 3.272727273 3.272727 1.898807 0 2.002039 0 0
Croatia 0 289.9090909 289.9091 1.898807 0 2.002039 0 0
Cyprus 1.5 1.181818182 -0.31818 1.898807 2.848211 2.002039 3.003058 0.154847
Czech Republic 12.16666667 0 -12.1667 1.898807 23.10216 2.002039 24.35814 1.255983
Denmark 5.333333333 0 -5.33333 1.898807 10.12697 2.002039 10.67754 0.550568
Dominican
Republic 0 4.090909091 4.090909 1.898807 0 2.002039 0 0
Ecuador 0 91.27272727 91.27273 1.898807 0 2.002039 0 0
Egypt 320.3333333 2017.181818 1696.848 1.898807 608.2513 2.002039 641.3198 33.06848
Estonia 50.16666667 286.3636364 236.197 1.898807 95.25684 2.002039 100.4356 5.178778
Ethiopia 0 215.4545455 215.4545 1.898807 0 2.002039 0 0
Fiji 0.666666667 0.363636364 -0.30303 1.898807 1.265872 2.002039 1.334693 0.068821
Finland 0 13.27272727 13.27273 1.898807 0 2.002039 0 0
France 10.16666667 5.909090909 -4.25758 1.898807 19.30454 2.002039 20.35406 1.04952
Georgia 7.166666667 706.6363636 699.4697 1.898807 13.60812 2.002039 14.34795 0.739825
Germany 494.1666667 805.8181818 311.6515 1.898807 938.3274 2.002039 989.3409 51.01355
Greece 5.166666667 299.0909091 293.9242 1.898807 9.810505 2.002039 10.34387 0.533363
Grenada 0 8.181818182 8.181818 1.898807 0 2.002039 0 0
Guyana 0 0.636363636 0.636364 1.898807 0 2.002039 0 0
Hong Kong, China 51.66666667 4347.818182 4296.152 1.898807 98.10505 2.002039 103.4387 5.333626
Iceland 17.16666667 0 -17.1667 1.898807 32.5962 2.002039 34.36834 1.77214
Indonesia 43958.16667 193161.7273 149203.6 1.898807 83468.1 2.002039 88005.96 4537.866
Iran, Islamic
Republic of 18.33333333 4152.272727 4133.939 1.898807 34.81147 2.002039 36.70405 1.892577
Ireland 57.33333333 243.7272727 186.3939 1.898807 108.865 2.002039 114.7836 5.918604
Israel 8.166666667 589.3636364 581.197 1.898807 15.50693 2.002039 16.34998 0.843057
Italy 720.8333333 23.45454545 -697.379 1.898807 1368.724 2.002039 1443.136 74.41268
Jamaica 0 0.727272727 0.727273 1.898807 0 2.002039 0 0
Japan 103.5 431.6363636 328.1364 1.898807 196.5266 2.002039 207.211 10.68446
Jordan 71.66666667 382 310.3333 1.898807 136.0812 2.002039 143.4795 7.398255
Kazakhstan 0 113.8181818 113.8182 1.898807 0 2.002039 0 0
Kenya 2.166666667 15.54545455 13.37879 1.898807 4.114083 2.002039 4.337751 0.223668
Korea, Republic of 1.833333333 13.45454545 11.62121 1.898807 3.481147 2.002039 3.670405 0.189258
Kuwait 130.1666667 762.9090909 632.7424 1.898807 247.1614 2.002039 260.5987 13.4373
Latvia 19 134.9090909 115.9091 1.898807 36.07734 2.002039 38.03874 1.961398
Lebanon 0 229 229 1.898807 0 2.002039 0 0
Lithuania 17.5 283 265.5 1.898807 33.22913 2.002039 35.03568 1.806551
Macedonia, The Former Yugoslav
Republic of 8 68.18181818 60.18182 1.898807 15.19046 2.002039 16.01631 0.825852
Malawi 0 1.727272727 1.727273 1.898807 0 2.002039 0 0
Malaysia 19335.16667 65575.90909 46240.74 1.898807 36713.76 2.002039 38709.76 1995.998
Maldives 4.666666667 4.363636364 -0.30303 1.898807 8.861102 2.002039 9.342848 0.481747
Mali 2.166666667 0 -2.16667 1.898807 4.114083 2.002039 4.337751 0.223668
Malta 7.5 0 -7.5 1.898807 14.24106 2.002039 15.01529 0.774236
Mauritius 221.1666667 351.1818182 130.0152 1.898807 419.9529 2.002039 442.7843 22.83136
Mexico 299.3333333 7074.181818 6774.848 1.898807 568.3764 2.002039 599.277 30.90062
Moldova, Republic
of 0 29.72727273 29.72727 1.898807 0 2.002039 0 0
Montenegro 0 48.18181818 48.18182 1.898807 0 2.002039 0 0
Morocco 94.66666667 5.363636364 -89.303 1.898807 179.7538 2.002039 189.5264 9.772579
Mozambique 0 19.54545455 19.54545 1.898807 0 2.002039 0 0
Nepal 281.5 1358.090909 1076.591 1.898807 534.5143 2.002039 563.574 29.05966
Netherlands 1679.833333 3014.090909 1334.258 1.898807 3189.68 2.002039 3363.092 173.4117
Netherlands
Antilles 4.5 0 -4.5 1.898807 8.544634 2.002039 9.009175 0.464542
New Zealand 0.166666667 12.63636364 12.4697 1.898807 0.316468 2.002039 0.333673 0.017205
Niger 1.5 0 -1.5 1.898807 2.848211 2.002039 3.003058 0.154847
Nigeria 0 0.818181818 0.818182 1.898807 0 2.002039 0 0
Norway 4.666666667 8.272727273 3.606061 1.898807 8.861102 2.002039 9.342848 0.481747
Oman 10 363.3636364 353.3636 1.898807 18.98807 2.002039 20.02039 1.032315
Pakistan 466 15289.72727 14823.73 1.898807 884.8443 2.002039 932.9502 48.10586
Philippines 8423.5 55389 46965.5 1.898807 15994.6 2.002039 16864.18 869.5702
Poland 515.6666667 11.54545455 -504.121 1.898807 979.1517 2.002039 1032.385 53.23302
Portugal 0.166666667 0 -0.16667 1.898807 0.316468 2.002039 0.333673 0.017205
Qatar 22 232.7272727 210.7273 1.898807 41.77376 2.002039 44.04486 2.271092
Romania 62.83333333 4.363636364 -58.4697 1.898807 119.3084 2.002039 125.7948 6.486377
Saudi Arabia 675.5 2342 1666.5 1.898807 1282.644 2.002039 1352.377 69.73285
Senegal 0 0.181818182 0.181818 1.898807 0 2.002039 0 0
Serbia 0 335.6363636 335.6364 1.898807 0 2.002039 0 0
Seychelles 2 7.636363636 5.636364 1.898807 3.797615 2.002039 4.004078 0.206463
Singapore 3018.833333 6580 3561.167 1.898807 5732.183 2.002039 6043.822 311.6386
Slovakia 24 4 -20 1.898807 45.57138 2.002039 48.04893 2.477555
Slovenia 10.66666667 6.363636364 -4.30303 1.898807 20.25395 2.002039 21.35508 1.101136
Somalia 10.83333333 0 -10.8333 1.898807 20.57041 2.002039 21.68876 1.118341
South Africa 1090 2573.818182 1483.818 1.898807 2069.7 2.002039 2182.222 112.5223
Spain 15.83333333 17.54545455 1.712121 1.898807 30.06445 2.002039 31.69895 1.634498
Sri Lanka 1066.333333 2508.272727 1441.939 1.898807 2024.762 2.002039 2134.841 110.0792
Suriname 0 12.54545455 12.54545 1.898807 0 2.002039 0 0
Swaziland 0 31.72727273 31.72727 1.898807 0 2.002039 0 0
Sweden 0 13.18181818 13.18182 1.898807 0 2.002039 0 0
Switzerland 0 0.454545455 0.454545 1.898807 0 2.002039 0 0
Syrian Arab
Republic 4.5 338.8181818 334.3182 1.898807 8.544634 2.002039 9.009175 0.464542
Taipei, Chinese 546.5 2938.818182 2392.318 1.898807 1037.698 2.002039 1094.114 56.41599
Thailand 100 27485.45455 27385.45 1.898807 189.8807 2.002039 200.2039 10.32315
Trinidad and
Tobago 0 13.45454545 13.45455 1.898807 0 2.002039 0 0
Tunisia 0 49.27272727 49.27273 1.898807 0 2.002039 0 0
Turkey 74.33333333 1179.454545 1105.121 1.898807 141.1447 2.002039 148.8182 7.673539
Turkmenistan 0 33.27272727 33.27273 1.898807 0 2.002039 0 0
Uganda 1.333333333 0 -1.33333 1.898807 2.531743 2.002039 2.669385 0.137642
Ukraine 1992.166667 11811.18182 9819.015 1.898807 3782.741 2.002039 3988.395 205.6543
United Arab
Emirates 1621.666667 8025.545455 6403.879 1.898807 3079.233 2.002039 3246.64 167.407
United Kingdom 4698 4906.545455 208.5455 1.898807 8920.598 2.002039 9405.579 484.9814
United States of
America 3336.833333 281.0909091 -3055.74 1.898807 6336.004 2.002039 6680.47 344.4662
Uruguay 0 0.272727273 0.272727 1.898807 0 2.002039 0 0
Viet Nam 112.3333333 89871.09091 89758.76 1.898807 213.2994 2.002039 224.8957 11.59633
Yemen 174.8333333 3812.818182 3637.985 1.898807 331.9748 2.002039 350.0231 18.0483
97983.66667 557802 459818.3 218.3629 186052.1 230.2345 196167.1 10115
459818.3
100 40.46209 2.199781
[image:7.595.44.571.60.597.2]Total Effect WTE CCE
Table III : Competitiveness Effect
2000-2006 compared to 2007-2017
Decomposition Value(in USD) %
Change in Exports 459818.3333 100
World Trade Effect 186052.1198 40.46209
Market Distribution
Effect 10114.99729 2.199781
Commodity
Composition Effect -520647.5087 -113.229
Competitiveness Effect 784298.725 170.5671
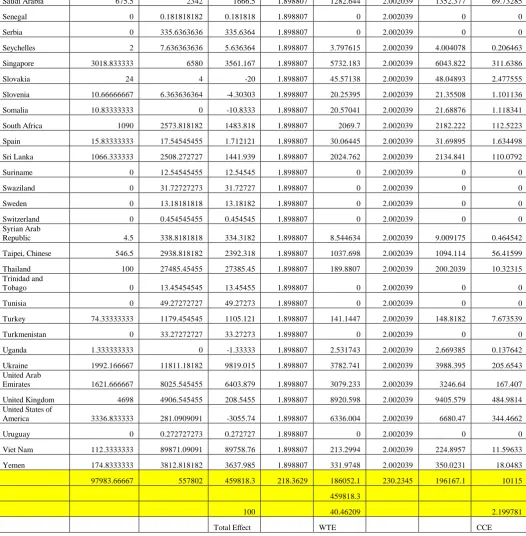
Above table is formed to examine the results of Constant Market Share (CONSTANT MARKET SHARE) on the basis of the export share of India in the total world export for the four Groundnut oilseeds during the period I (2000-06) and period II (2007-17). The above table decompose the results of CONSTANT MARKET SHARE into four structural components (Change in Total Export)
1. World Trade Effects,
3. Market Distribution Effect and 4. Competitiveness Effect
Table indicates the relative contribution of each of the components of CONSTANT MARKET SHARE
model on the expansion of export of Groundnut (OILseeds) for India for the selected periods. Total export change of India for Groundnut (OILseeds) in value term USD 459818.3333 million for the period I to II. The world trade effect and market distribution effects have positively contributed to the change in the total export of India during the period I(2000-06) to period II (2007-17) with the contribution of 40.46209% and 2.199781%. The results for World trade effects in the table indicates the increases in the Groundnut (OILseeds) export of India with expansion in the size of world market during the period I to period II. Similarly, the results of market distribution effects exhibit that Indian export of Groundnut (OILseeds) is concerted in the markets where demand is rising faster than world demand. The negative value -113.229of commodity composition effects suggests that India concentrates on slowly grew markets for Groundnut (OILseeds). During the same period, India gains market share of her export of Groundnut (OILseeds) in the various markets due to its competitiveness in the export of the same product.
VI. CONCLUSION
The above analyses clearly depicts that India has a competitive advantage in exports for Groundnut (OILSeed). The RCA reveals that over the years from 2008 to 2017 after WORLD TRADE ORGANIZATION india maintained the advantage. Fturther CONSTANT MARKET SHARE reveals that while comparing the periods before and after WORLD TRADE ORGANIZATION India has benefited in the advantage.
REFERENCES
[1]Balassa, Bela (1977), “'Revealed' Comparative Advantage Revisited: An Analysis of Relative Export Shares of the Industrial Countries, 1953-1971”, The Manchester School of Economic & Social Studies, 1977, vol. 45, issue 4, pp. 327-44.
[2]Verghese SK (1979) Developments in International Competitiveness in
India in 1970. Economic and Political Weekly 14: 1718-1726.
[3]Balance, Robert H, Helmut Forstner and Tracy Murray (1987),
“Consistency Tests of Alternative Measures of Comparative Advantage”, the Review of Economics and Statistics, Vol. 69, No. 1, pp. 157-161. 2.
[4]Reddy, B. D. R., Lalith Achoth and B. V. Chenappa Reddy., 1998, Export Competitiveness of Groundnut Empirical Evidence from Karnataka. Astha Vijnana, Vol.15 (3): pp. 263-270.
[5]Bhavani T.A (2001), “Determinants of firm-level export performance: a
case study of Indian Textile garments and apparel industry”, The Journal of International Trade & Economic Development.10:1, 65-92.
[6]Datta, S.K., 2001. How to Judge Global Competitiveness of Indian Agribusiness: Methodological Issues and Lessons for India. In S.K.Datta and S.Y.Deodhar (Eds), Implications of WORLD TRADE ORGANIZATION Agreements for Indian Agriculture. Oxford and IBH Publishing Co.Pvt.Ltd, New Delhi.
[7]Samar Verma (November, 2002) “Export Competitiveness Of Indian
Textile And Garment Industry” .
[8]Verma S (2002) Export Competitiveness of Indian Textile and Garment
Industry Working.Indian Council for Research on International Economic Relations 94.
[9]Ranjana Kumar (2005) “Constrains facing Indian agriculture: Need for
policy intervention”, Indian journal of agricultural economics, Vol. 60, No. 01, Jan –March.
[10] RS Deshpande (March, 2005) “Karnataka Oilseed Production”.
[11] Zhang, Xiu-ling and Liu, M., 2008. Experimental study on the
international competition power of China’s peanut industry. Journal of Henan Agricultural Sciences, 11.
[12] Bhatt PR (2010) China’s Competitiveness in World Economy Foreign
Trade 44: 19-41.
[13] Jiang Y, Zhang Q, Chai J (2010) The Empirical Research of the Competitiveness based on the Informationization of China’s Textile & Clothing Industry. The Conference on Web Based Business Management.
[14] HailegiorgisBiramoAllaro (2011) “Export Performance of Oilseeds
and ITS Determinants in Ethiopia”.
[15] Devendra S (2013) Performace of Indian Textile and Clothing
Industry in the United States Market A Post ATC Analysis. Journal of Research in Commerce & Management 2: 64-76.
[16] Sharma SK, Bugalya K (2014) Competitiveness of Indian agriculture
sector a case study of cotton crop Procedia - Social and Behavioral Sciences 133: 320-335.
[17] Dr. N C Pahariya (2014) “Impact Assessment of Trade Liberalisation
in Oilseeds Sector : Rajasthan”.
[18] Akmal, N., W. Akhtar, H. Shah, M. A. Niazi and T. Saleem, 2014.
The structure and competitiveness of Pakistan’s Basmati Rice exports. Asian Journal of Agriculture and Rural Development, 4 (4): 304-312.
[19] Sunil Kumar Niranjan (2016) “WORLD TRADE
ORGANIZATION Agreement on Indian Oilseed Agriculture”.
[20] Cann O (2016) what is competitiveness? World Economic Forum.
AUTHORS PROFILE
Anudeep Arora was honored with 25th Prestigious Dr
Sarvepalli Radhakrishnan Smriti National Media and Teacher Network Award at Hansraj College Delhi University. He received this award from Ram Niwas Goyal, speaker of Delhi Vidhan Sabha and RajInder Pal Gautam, Minister of water, social welfare, art and culture, GNCT Delhi.
He has facilitated various conferences, programs and seminars on Digital Media Marketing, Leadership and other topics for Corporate Professionals, faculties and students. He has been associated as an Assistant professor with Kamal Institute of Higher education and Advance Technology (G.G.S.IPU). He has taught subjects like International Business Management, Export and import documentation, International Marketing, Entrepreneurship Development, International Trade Operations, Market Research, Production and Operation Management, Family Business Management, Indian Economy, Foreign Trade Policy, Brand Management in MBA and other post graduate programs. He has prepared students for various cultural and literary
competitions. More than Twenty five research papers of Anudeep
Arora have been published in well-regarded national and international
journals. He is UGC NET Qualified and did his Masters in International
Business from Amity University and currently pursuing Ph.D in
Management from Amity University. He was awarded the silver medal for
standing second in academics in entire university while doing graduation
Durgesh Batra, BSc, (Rajasthan University),
BT(Computing),(Thompson River University,
Canada), MSc(statistics),(Rajasthan