Interleukin-10 Modulation of Virus Clearance and Disease in
Mice with Alphaviral Encephalomyelitis
Nina M. Martin,
aDiane E. Griffin
aaW. Harry Feinstone Department of Molecular Microbiology and Immunology, Johns Hopkins Bloomberg
School of Public Health, Baltimore, Maryland, USA
ABSTRACT
Alphaviruses are an important cause of mosquito-borne outbreaks of
ar-thritis, rash, and encephalomyelitis. Previous studies in mice with a virulent strain
(neuroadapted SINV [NSV]) of the alphavirus Sindbis virus (SINV) identified a role for
Th17 cells and regulation by interleukin-10 (IL-10) in the pathogenesis of fatal
en-cephalomyelitis (K. A. Kulcsar, V. K. Baxter, I. P. Greene, and D. E. Griffin, Proc Natl
Acad Sci U S A 111:16053–16058, 2014,
https://doi.org/10.1073/pnas.1418966111
). To
determine the role of virus virulence in generation of immune responses, we analyzed
the modulatory effects of IL-10 on disease severity, virus clearance, and the CD4
⫹T cell
response to infection with a recombinant strain of SINV of intermediate virulence
(TE12). The absence of IL-10 during TE12 infection led to longer morbidity, more weight
loss, higher mortality, and slower viral clearance than in wild-type mice. More severe
disease and impaired virus clearance in IL-10
⫺/⫺mice were associated with more Th1
cells, fewer Th2 cells, innate lymphoid type 2 cells, regulatory cells, and B cells, and
delayed production of antiviral antibody in the central nervous system (CNS) without an
effect on Th17 cells. Therefore, IL-10 deficiency led to more severe disease in
TE12-infected mice by increasing Th1 cells and by hampering development of the local B cell
responses necessary for rapid production of antiviral antibody and virus clearance from
the CNS. In addition, the shift from Th17 to Th1 responses with decreased virus
virulence indicates that the effects of IL-10 deficiency on immunopathologic responses
in the CNS during alphavirus infection are influenced by virus strain.
IMPORTANCE
Alphaviruses cause mosquito-borne outbreaks of encephalomyelitis,
but determinants of outcome are incompletely understood. We analyzed the effects
of the anti-inflammatory cytokine IL-10 on disease severity and virus clearance after
infection with an alphavirus strain of intermediate virulence. The absence of IL-10
led to longer illness, more weight loss, more death, and slower viral clearance than
in mice that produced IL-10. IL-10 influenced development of disease-causing T cells
and entry into the brain of B cells producing antiviral antibody. The Th1 pathogenic
cell subtype that developed in IL-10-deficient mice infected with a less virulent virus
was distinct from the Th17 subtype that developed in response to a more virulent
virus, indicating a role for virus strain in determining the immune response. Slow
production of antibody in the nervous system led to delayed virus clearance.
There-fore, both the virus strain and the host response to infection are important
determi-nants of outcome.
KEYWORDS
B cells in brain, CD4
⫹T cells, IL-10, Sindbis virus, Th1 cells, antibody in
brain, central nervous system infections, encephalitis, mice
O
utbreaks of mosquito-borne viral diseases are on the rise, with recent extensions
of rash, arthritis and encephalomyelitis to new regions (1, 2). Alphaviruses,
includ-ing chikungunya, eastern equine encephalitis, and Venezuelan equine encephalitis
viruses, are important causes of these outbreaks and can cause encephalomyelitis, a
Received29 August 2017Accepted11 December 2017
Accepted manuscript posted online20 December 2017
CitationMartin NM, Griffin DE. 2018. Interleukin-10 modulation of virus clearance and disease in mice with alphaviral encephalomyelitis. J Virol 92:e01517-17. https://doi.org/10.1128/JVI.01517-17.
EditorTerence S. Dermody, University of Pittsburgh School of Medicine
Copyright© 2018 American Society for Microbiology.All Rights Reserved.
Address correspondence to Diane E. Griffin, dgriffi[email protected].
crossm
on November 6, 2019 by guest
http://jvi.asm.org/
potentially fatal inflammatory disease of the central nervous system (CNS) with
fre-quent long-term neurological deficits in survivors (3–5).
Sindbis virus (SINV), the prototypical alphavirus, is the most widespread alphavirus
and causes rash and arthritis in humans (6). In mice, SINV causes encephalomyelitis, the
severity of which depends on virus and host factors, including host age and genetic
background and virus strain (7–10). SINV strains with various degrees of pathogenicity
for mice have been developed by passage
in vitro
and
in vivo
and by construction of
recombinant viruses. Neuroadapted SINV (NSV), a strain obtained by passaging the
original isolate AR339 in mouse brain, causes fatal encephalomyelitis in adult C57BL/6
(B6) mice (8, 11), while virus derived from the tissue culture-passaged HRSP clone
Toto1101 causes little disease even in newborn mice (10). TE12 is a recombinant SINV
strain with the E1 and E2 envelope glycoproteins from NSV inserted into the Toto1101
background and has intermediate virulence, with approximately 50% mortality in adult
B6 mice (10). Strains with variable virulence allow for identification of factors associated
with immunopathogenesis and death as well as recovery and virus clearance (7).
Previous studies have shown that the immune response has both positive and
negative effects on disease pathogenesis after SINV infection. In nonfatal infections,
both antibody and interferon gamma (IFN-
␥
) contribute to noncytolytic viral clearance
from neurons (12–16), while in fatal encephalomyelitis, T cell responses regulated by
interleukin-10 (IL-10) are implicated in immunopathogenesis and death (17–21). In
particular, in NSV-infected IL-10-deficient mice, Th17 cells are associated with
acceler-ated morbidity and mortality (19, 20). IL-10 dysregulation has also been implicacceler-ated in
inflammatory disease due to infection with influenza virus and cytomegalovirus (22, 23),
as well as in autoimmune diseases (24–28).
Previous studies of NSV-infected IL-10-deficient mice also indicated a delay in viral
clearance compared to that in wild-type (WT) mice, but rapid death of the mice made
analysis of the mechanism difficult. Therefore, in the current study we analyzed the role
of IL-10 in pathogenesis of disease in mice that survived longer after infection than
NSV-infected mice. IL-10-deficient mice infected with TE12 had longer morbidity, more
weight loss, higher mortality, and slower viral clearance than WT mice. More severe
disease in IL-10
⫺/⫺mice was associated with more Th1 cells, fewer Th2 T cells, type 2
innate lymphoid cells, regulatory T cells (Tregs) and B cells (Bregs), and B cells, and
delayed production of antiviral antibody in the CNS after infection without an effect on
Th17 responses. These data demonstrate an important but slightly different role for
IL-10 in regulating pathogenesis during infection with a less virulent strain of SINV than
NSV and identify increased Th1 and reduced Th2 and B cell responses in the CNS that
hamper local antiviral antibody production as reasons for exacerbated disease and
delayed virus clearance.
RESULTS
IL-10 is upregulated in response to TE12 infection.
To determine if IL-10 is
upregulated in the CNS after TE12 infection, mRNA expression in the brains and spinal
cords of WT mice was measured and compared to those in uninfected controls. In both
the brain (Fig. 1A) and spinal cord (Fig. 1B),
Il10
gene expression was increased by day
3, peaked at day 10, and remained above baseline through 21 days postinfection.
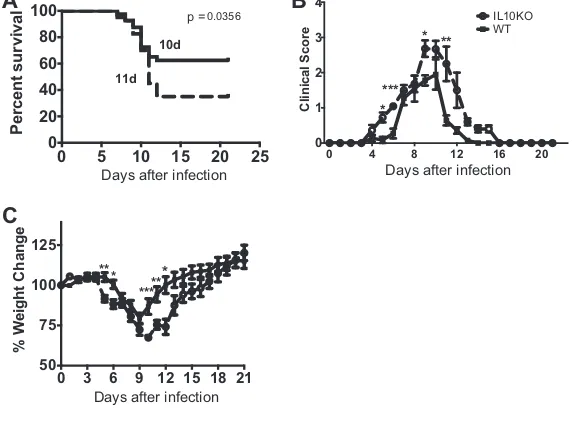
IL-10 deficiency leads to prolonged morbidity and increased mortality.
To
determine the effect of IL-10 deficiency on TE12-induced morbidity and mortality, 4- to
6-week-old WT and IL-10
⫺/⫺mice were intranasally infected and evaluated daily. The
mean days of death were similar, but IL-10-deficient mice had higher mortality (62.5%)
than WT mice (35.0%) (Fig. 2A) (
P
⫽
0.0356). Mice lacking IL-10 also showed signs of
encephalomyelitis earlier (day 3) than WT mice (day 4), and those that survived were
slower to recover from infection (Fig. 2B). IL-10-deficient mice also lost more weight,
and surviving mice recovered weight more slowly than WT mice. These clinical
mani-festations of disease taken together demonstrate an important role for IL-10 in survival
and recovery from TE12 infection.
on November 6, 2019 by guest
http://jvi.asm.org/
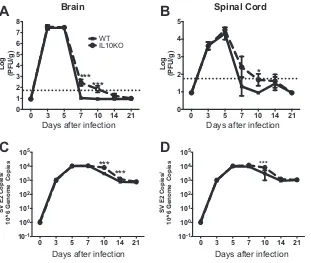
IL-10 deficiency leads to delayed clearance of infectious virus and viral RNA.
To
assess the impact of IL-10 deficiency on virus replication and clearance, infectious virus
in brain (Fig. 3A) and spinal cord (Fig. 3B) was measured by plaque assay. Amounts of
infectious virus peaked at day 3 to 5 after infection with similar virus titers in both WT
0 3 5 7 10 14 21 10-1
100 101 102 103 104
Days Post Infection
IL-1
0
m
R
N
A
Fold C
h
a
n
g
e
0 3 5 7 10 14 21 0
20 40 60
Days Post Infection
IL
-10 mRN
A
Fold Cha
n
g
e
A
B
Brain
Spinal Cord
FIG 1IL-10 is upregulated in response to TE12 infection. WT B6 mice were intranasally infected with 105
PFU TE12.Il10mRNA expression was measured by quantitative real-time PCR in the brains (A) and spinal cords (B) of TE12-infected mice.CTvalues were normalized to GAPDH RNA.CTvalues and fold change were calculated relative to uninfected controls (ΔΔCT). Data are averaged from 2 independent experi-ments and represent the mean⫾SEM for 6 individual mice at each time point.
0 3 6 9 12 15 18 21 50
75 100 125
** *
*****
*
%
We
ig
h
t
C
ha
n
g
e
0 4 8 12 16 20
0 1 2 3 4
C
linic
a
l Sc
or
e
**
* ***
*
IL10KO WT
0 5 10 15 20 25 0
20 40 60 80
100 p =
10d
11d
0.0356
P
erce
nt
su
rvi
v
al
A
B
C
Days after infection Days after infection
Days after infection
FIG 2IL-10 deficiency leads to prolonged morbidity and increased mortality after TE12 infection. WT and IL-10⫺/⫺B6 mice were intranasally infected with 105 PFU TE12. (A) Survival was assessed using a
Kaplan–Meier curve and log rank (Mantel-Cox) test,P⫽0.0356. The median days of death were 10 for WT and 11 for IL-10⫺/⫺mice. (B) Signs of disease were monitored daily. The clinical score scale was as
follows: 0, no signs; 1, abnormal hind-limb and tail posture, ruffled fur, and/or hunched back; 2, unilateral hind-limb paralysis; 3, bilateral hind-limb paralysis and/or moribund; 4, dead. (C) The percent weight change was determined by comparing the weight each day to the original weight of each mouse. Data are pooled from 3 independent experiments for a total of 40 mice for each group and presented as the mean⫾SEM.*,P⬍0.05;**,P⬍0.01;***,P⬍0.001.
on November 6, 2019 by guest
http://jvi.asm.org/
[image:3.585.134.278.73.290.2] [image:3.585.60.350.438.651.2]and IL-10
⫺/⫺mice. However, viral clearance was delayed in IL-10-deficient mice
com-pared to WT mice in both brain and spinal cord. While infectious virus was cleared from
most WT mice by day 7, it was still detectable in many IL-10
⫺/⫺mice at days 7 and 10
after infection.
The amount of viral RNA was also quantified in brain (Fig. 3C) and spinal cord (Fig.
3D). SINV E2 gene RNA was detected by 3 days after infection, and amounts of viral RNA
peaked on day 5 to 7 in brain and spinal cord of both WT and IL-10
⫺/⫺mice. However,
IL-10-deficient mice had higher viral RNA levels on days 10 and 14 in brain and on day
10 in spinal cord than WT mice. These results combined show a role for IL-10 in
regulating viral clearance in both the brain and spinal cord.
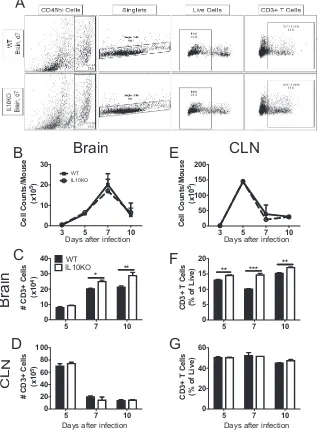
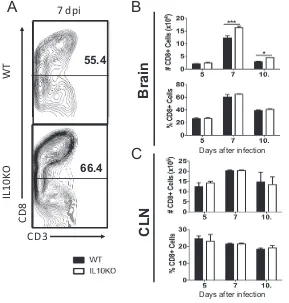
Effect of IL-10 deficiency on CD3
ⴙ, CD4
ⴙ, and CD8
ⴙT cells.
To assess the impact
of IL-10 deficiency on T cell responses to TE12 infection, lymphocytes isolated from the
draining cervical lymph nodes (CLNs) and brain tissues from IL-10
⫺/⫺and WT mice on
days 5, 7, and 10 after infection were analyzed by flow cytometry (Fig. 4A). IL-10
deficiency did not affect the total number of cells in brain (Fig. 4B) or CLN (Fig. 4E), but
the numbers (Fig. 4C) and percentages (Fig. 4F) of CD3
⫹T cells were higher in the
brains, but not the CLNs (Fig. 4D and G), of IL-10
⫺/⫺mice.
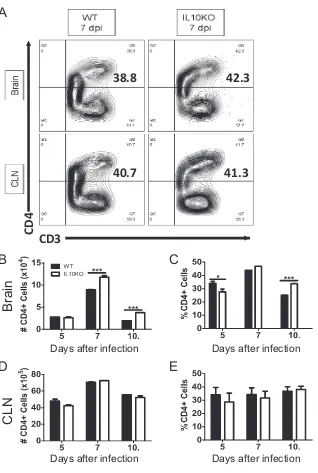
To characterize the T cells present, CD4
⫹and CD8
⫹T cells were quantified in brains
and CLNs from WT and IL-10
⫺/⫺mice (Fig. 5A and 6A). On days 7 and 10 after infection,
more CD4
⫹T cells were present in the brains of IL-10-deficient mice than in those of
WT mice (Fig. 5B), and the percentage of cells that were CD4
⫹T cells was higher in
IL-10
⫺/⫺mice at 5 and 10 days after infection (Fig. 5C). There were no differences in
numbers or percentages of CD4
⫹T cells in CLNs (Fig. 5D and E).
Similar analysis of the impact of IL-10 deficiency on CD8
⫹T cells showed more CD8
⫹T cells in the brains of IL-10
⫺/⫺mice at 7 and 10 days after infection (Fig. 6B, top panel),
0 3 5 7 10 14 21 0
1 2 3 4 5 6 7 8
***
***
WT IL10KO
Log
(PF
U/
g
)
0 3 5 7 10 14 21 0
1 2 3 4 5
*
Log
(PF
U
/g
)
0 3 5 7 10 14 21
10-1 100 101 102 103 104 105
***
***
SV E2
C
opie
s
/
1
0
^6
Ge
nom
e
C
o
pie
s
0 3 5 7 10 14 21
10-1 100 101 102 103 104 105
***
SV E2
C
opie
s
/
1
0
^6
Ge
nom
e
C
o
pie
s
A
B
C
D
Brain
Spinal Cord
Days after infection
Days after infection
Days after infection
Days after infection
FIG 3IL-10 deficiency leads to delayed clearance of infectious virus and viral RNA. WT and IL-10⫺/⫺B6
mice were intranasally infected with 105PFU TE12. (A and B) Virus titers were determined by plaque assay
using brain (A) or spinal cord (B) homogenates prepared from WT (filled squares, solid lines) and IL-10⫺/⫺
(open circles, dashed lines) mice. The limit of detection is displayed as a horizontal dotted line. For statistical analysis, mice with no detectable plaques were assigned a value midway between the limit of detection and zero. (C and D) Viral RNA copy numbers were determined by RT-qPCR on RNA isolated from brain (C) or spinal cord (D). Data are pooled from 3 independent experiments and presented as the mean⫾SEM for 6 mice at each time point.*,P⬍0.05;**,P⬍0.01;***,P⬍0.001.
on November 6, 2019 by guest
http://jvi.asm.org/
[image:4.585.51.362.70.333.2]but the percentages were not different (Fig. 6B, bottom panel). There were no
differ-ences in the numbers or percentages of CD8
⫹T cells in the CLNs (Fig. 6C). Therefore,
IL-10 deficiency generally increases the representation of CD3
⫹, CD4
⫹, and CD8
⫹T cells
in the CNS in response to TE12 infection.
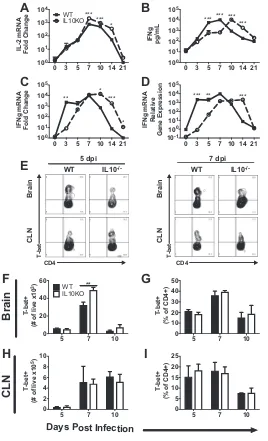
Effect of IL-10 deficiency on Th1 cells and Th1-related cytokines.
Subsets of
CD4
⫹T cells are important for viral clearance but can also be a source of
immuno-pathogenesis. To determine the impact of IL-10 deficiency on production of Th1-related
cytokines, reverse transcription-quantitative PCR (RT-qPCR) was performed on cDNA
from brains of IL-10
⫺/⫺or WT mice. Levels of
Il2
mRNA (Fig. 7A) in IL-10
⫺/⫺mice
increased similarly to but were higher than those in WT mice at 7 to 14 days after
5 7 10
0 10 20 30 40
** *
#
CD3
+ C
e
ll
s
(x10
4)
WT IL10KO
3 5 7 10
0 10 20 30
WT IL10KO
Ce
ll
C
ount
s
/M
ou
s
e
(x10
5)
5 7 10
0 20 40 60 80 100
# CD3+
Ce
ll
s
(x1
0
5)
3 5 7 10
0 50 100 150 200
C
e
ll C
ount
s
/M
ou
s
e
(x10
5)
5 7 10
0 5 10 15 20
**
** ***
CD3+
T
Cel
ls
(% of L
ive)
5 7 10
0 20 40 60
CD3
+
T
Cel
ls
(% of L
ive)
C
B
D
E
A
F
G
Brain
CLN
ni
ar
B
CLN
A
Days after infection Days after infection Days after infection Days after infection
FIG 4Effect of IL-10 deficiency on CD3⫹T cells in the CNS. WT and IL-10⫺/⫺B6 mice were intranasally
infected with 105PFU TE12. Flow cytometric analysis of cells isolated from the pooled brains and CLNs
of WT (black bars) or IL-10-deficient (white bars) mice at 5 (n⫽6), 7 (n⫽10), and 10 (n⫽10) days after infection is shown. (A) Representative flow cytometry plots of cells isolated from brain at 7 days after infection. (B and E) Total numbers of cells isolated from brains (B) and CLNs (E). (C and F) Number (C) and percentage (F) of CD3⫹T cells isolated from brain. (D and G) Number (D) and percentage (G) of CD3⫹
T cells isolated from CLNs. The data represent the mean⫾SEM from 3 independent experiments.*,P⬍
0.05;**,P⬍0.01;***,P⬍0.001.
on November 6, 2019 by guest
http://jvi.asm.org/
[image:5.585.45.367.77.512.2]infection. Levels of
Ifn
␥
mRNA (Fig. 7C and D) and IFN-
␥
protein (Fig. 7B) increased more
rapidly in WT mice, but IL-10-deficient mice had higher levels of
Ifn
␥
mRNA and protein
than WT mice at late times after infection.
To identify and quantify Th1 cells during TE12 infection, lymphocytes isolated
from brains and CLNs were stained for CD3, CD4, and T-bet, the master transcription
factor for differentiation and activation of Th1 cells (Fig. 7E). Brains of IL-10
⫺/⫺mice
had more Th1 cells at 7 days after infection than those of WT mice (Fig. 7F). There
were no significant differences in numbers or percentages of Th1 cells in the CLNs
(Fig. 7H and I).
C
B
D
E
A
CD3
CD4
42.3
38.8
40.7
41.3
Brain
CLN
Days after infection
Days after infection
Days after infection
Days after infection
FIG 5Effect of IL-10 deficiency on CD4⫹T cells in the CNS. WT and IL-10⫺/⫺B6 mice were intranasally
infected with 105PFU TE12. Flow cytometric analysis of cells isolated from the pooled brains or CLNs of
WT (black bars) or IL-10-deficient (white bars) mice at 5 (n⫽6), 7 (n⫽10), and 10 (n⫽10) days postinfection (dpi) is shown. (A) Representative flow cytometry plots of cells isolated from brain and CLN at 7 days after infection. (B and C) Number (B) and percentage (C) of CD3⫹cells that were CD4⫹T cells
in brain. (D and E) Number (D) and percentage (E) of CD3⫹T cells in CLNs that were CD4⫹T cells. The
data represent the mean⫾SEM from 3 independent experiments.*,P⬍0.05;**,P⬍0.01;***,P⬍0.001.
on November 6, 2019 by guest
http://jvi.asm.org/
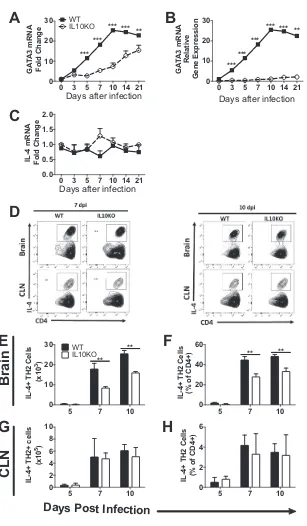
[image:6.585.48.366.67.540.2]Effect of IL-10 deficiency on ILC2 cells, Th2 cells, and Th2-related cytokines.
Th2
cells are important for activation and differentiation of B cells and ultimate production
of antibody. To determine the impact of IL-10 deficiency on expression of genes for
Th2-related proteins, RT-qPCR was performed on cDNA from brains from IL-10
⫺/⫺and
WT mice.
Gata3
mRNA was lower in brains of IL-10
⫺/⫺mice than in those of WT mice
at all times after infection (Fig. 8A and B). Levels of
Il4
mRNA did not increase in
response to infection in either IL-10
⫺/⫺or WT mice (Fig. 8C), consistent with the
posttranscriptionally regulated expression of this cytokine.
Th2 cell frequency in CNS tissues was measured via flow cytometry by quantifying
CD4
⫹T cells that produce IL-4 and express Gata3, a transcription factor important for
the differentiation and activation of Th2 cells (Fig. 8D). Mice deficient in IL-10 had lower
numbers and percentages of CD4
⫹T cells producing IL-4 on days 7 and 10
postinfec-tion than WT mice (Fig. 8E and F). There were no differences in numbers or percentages
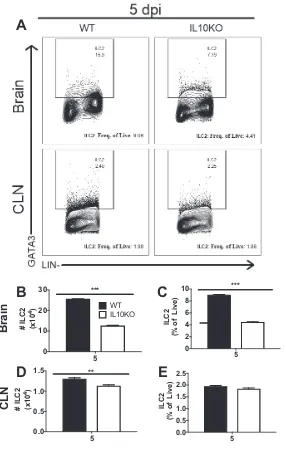
in CLNs (Fig. 8G and H). Because IL-10 deficiency had an impact on Th2 responses,
numbers of innate lymphoid cell type 2 (ILC2) cells, early sources of IL-5 and IL-13 and
activators of Th2 and B cell responses (29, 30), were examined 5 days after infection
(Fig. 9A), before entry of substantial numbers of T cells (Fig. 4C). Mice deficient in IL-10
had lower numbers and percentages of ILC2 cells in brains (Fig. 9B and C) and fewer
ILC2 cells in CLNs (Fig. 9D) than WT mice on day 5 after infection.
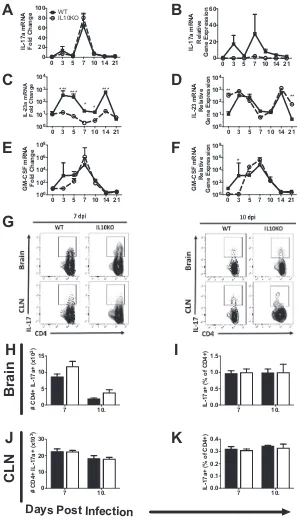
Effect of IL-10 deficiency on Th17 cells.
Previous studies showed that IL-10
⫺/⫺mice had accelerated production of
Il17a
mRNA and pathogenic Th17 cells after NSV
infection (19). However, after TE12 infection,
Il17a
mRNA expression in brains of
A
CL
N
Br
a
in
CD3
CD
8
WT
IL
10
KO
7 dpi
55.4
66.4
C
B
Days after infection Days after infection
FIG 6Effect of IL-10 deficiency on CD8⫹T cells in the CNS. WT and IL-10⫺/⫺B6 mice were intranasally
infected with 105PFU TE12. Flow cytometric analysis of isolated cells pooled from the brains or CLNs of
WT (black bars) or IL-10-deficient (white bars) mice at 5 (n⫽6), 7 (n⫽10), and 10 (n⫽10) days postinfection is shown. (A) Representative flow cytometry plots of cells isolated from brains. (B) Number (top panel) and percentage (bottom panel) of CD3⫹brain cells that were CD8⫹T cells. (C) Number (top
panel) and percentage (bottom panel) of CD3⫹cells in CLNs that were CD8⫹T cells. The data represent
the mean⫾SEM from 3 independent experiments.*,P⬍0.05;**,P⬍0.01;***,P⬍0.001.
on November 6, 2019 by guest
http://jvi.asm.org/
[image:7.585.61.350.72.375.2]IL-10
⫺/⫺and WT mice was not different (Fig. 10A and B), and
Il23
and
Gmcsf
mRNAs
increased more in WT than in IL-10
⫺/⫺mice after infection (Fig. 10C to F). We also
assessed Th17 responses after TE12 infection by flow cytometry (Fig. 10G). There were
no differences in the numbers or percentages of IL-17a-producing CD4
⫹T cells in the
brain (Fig. 10H and I) or CLN (Fig. 10J and K). Therefore,
Il17a
mRNA levels and Th17
cells increase in the CNS after TE12 infection, but unlike in NSV infection, IL-10
deficiency did not exacerbate this response.
0 3 5 7 10 14 21
100 101 102 103 104 *** *** * WT IL10KO IL-2 m R N A Fold C ha ng e
0 3 5 7 10 14 21
100 101 102 103 104 105 IFN g m R N A Fold C h a ng e ** * * ***
5 7 10
0 20 40 60 ** WT IL10KO T -b et+ (# of li ve x10 3)
5 7 10
0 2 4 6 8 10 T -b et+ (# o f li v e x1 0 5)
0 3 5 7 10 14 21
100 101 102 103 104 105 *** ****** *** IFN g pg/m L
0 3 5 7 10 14 21
10-1 100 101 102 103 104 105 IFN g m R N A Re la ti ve Ge ne Ex pr e s s io n *** ** ***
5 7 10
0 10 20 30 40 50 T-b e t+ (% o f CD4+ )
5 7 10
0 5 10 15 20 25 T-b e t+ (% o f CD4+ )
A
B
C
D
E
F
Brai
n
CL
N
G
H
Days Post Infection
T-b e t T-b e t CD4 CD4
WT IL10-/- WT IL10
-/-5 dpi 7 dpi
CLN Brain CLN Brai n
I
FIG 7Effect of IL-10 deficiency on Th1 cells and Th1-related cytokines. WT and IL-10⫺/⫺B6 mice were
intranasally infected with 105PFU TE12. (A to D) Analysis ofIl2mRNA (A), IFN-␥protein (B), andIfn␥
mRNA (C and D) in the brains of WT (filled squares, solid lines) and IL-10-deficient (open circles, dashed lines) mice. GeneCTvalues were normalized to the GAPDH gene, and changes in levels were calculated relative to uninfected mice of the same strain (A and C) or to uninfected WT mice (D) (ΔΔCT). Data were pooled from three independent experiments and presented as the mean⫾SEM from 6 mice at each time point.*,P⬍0.05;**,P⬍0.01;***,P⬍0.001. (E to I) Flow cytometric analysis of cells isolated from the pooled brains (n⫽6) of WT (black bars) or IL-10⫺/⫺(white bars)
mice at 5, 7, and 10 days postinfection. (E) Representative flow cytometry plots of Th1 cells, defined as CD45hiCD3⫹CD4⫹T cells expressing T-bet. (F to I) Frequency and percentage of CD4⫹T cells
expressing T-bet in brain (F and G) and CLN (H and I). The data represent the mean⫾SEM from 2 independent experiments.**,P⬍0.01.
on November 6, 2019 by guest
http://jvi.asm.org/
[image:8.585.72.340.71.512.2]0 3 5 7 10 14 21 0 10 20 30 WT IL10KO ** *** *** *** *** G A T A3 mRN A Fold C ha ng e
0 3 5 7 10 14 21 0.0 0.5 1.0 1.5 2.0 IL-4 m R N A Fold C ha ng e
5 7 10
0 10 20 30 ** ** WT IL10KO IL -4+ T H 2 Cel ls (x1 0 3)
5 7 10
0 2 4 6 8 10 IL-4 + TH 2 + c e lls (x10 5)
0 3 5 7 10 14 21 0 10 20 30 ** *** *** *** *** G AT A3 mRN A Rel a tiv e Ge ne Ex pr e s s io n ***
5 7 10
0 20 40 60 ** ** IL-4 + TH 2 C e lls (% o f CD4+ )
5 7 10
0 2 4 6 IL-4 + TH 2 Ce lls (% of CD4+ )
A
B
C
D
E
F
Brai
n
CLN
G
H
Days Post Infection
Days after infection
Days after infection
Days after infection
FIG 8Effect of IL-10 deficiency on Th2 cells and Th2-related cytokines. WT and IL-10⫺/⫺B6 mice were
intranasally infected with 105PFU TE12. (A to C) Analysis ofGata3(A and B) andIl4(C) mRNA expression
in the brains of WT (filled squares, solid lines) and IL-10⫺/⫺(open circles, dashed lines) mice. GeneC
T values were normalized to the GAPDH gene, and changes in levels were calculated relative to uninfected mice of the same strain (A and C) or to uninfected WT mice (B) (ΔΔCT). Data were pooled from three independent experiments and are presented as the mean⫾SEM from 6 mice at each time point.**,P⬍
0.01;***,P⬍0.001. (D to H) Flow cytometric analysis of isolated cells pooled from the brains of WT (black bars) or IL-10⫺/⫺(white bars) mice at 5 (n⫽6), 7 (n⫽10), and 10 (n⫽10) days postinfection. (D)
Representative flow cytometry plots of Th2 cells, defined as CD45hiCD3⫹CD4⫹Gata3⫹T cells producing
IL-4. (E to H) Frequency and percentage of CD4⫹T cells producing IL-4 in brain (E and F) and CLN (G and
H). The data represent the mean⫾SEM from 3 independent experiments.**,P⬍0.01.
on November 6, 2019 by guest
http://jvi.asm.org/
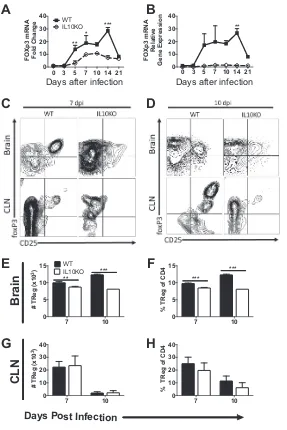
[image:9.585.52.359.63.589.2]Effect of IL-10 deficiency on regulatory cells.
Regulatory T cells are major
pro-ducers of IL-10 and can affect the function of many immune cells (31). Levels of
foxp3
mRNA transcripts in brain (Fig. 11A and B) were lower in IL-10
⫺/⫺mice than in WT mice
from day 5 to 14 after infection. Flow cytometry was performed on lymphocytes
isolated from CLN and brain tissues of IL-10
⫺/⫺or WT mice to measure regulatory T
cells (CD3
⫹CD4
⫹CD25
⫹foxP3
⫹) on days 7 and 10 after TE12 infection (Fig. 11C and
D). Staining patterns were distinct, and at day 10 in the CLNs of WT, but not IL-10
⫺/⫺,
mice, two populations were evident. IL-10
⫺/⫺mice had lower numbers and
percent-ages of Tregs in brains than WT mice on days 7 and 10 (Fig. 11E and F). There were
similar numbers and percentages of Tregs in CLNs (Fig. 11G and H).
Because regulatory B cells (CD19
⫹CD5
⫹CD1d
hiIgM
⫹), as well as T cells, produce IL-10
and downregulate Th1 and Th17 responses, they were also assessed (Fig. 12A).
IL-10-5 0
10 20
30 ***
WT IL10KO
# I
L
C2
(x10
4)
5 0
2 4 6 8 10
* ***
ILC
2
(%
o
f Li
v
e
)
5 0.0
0.5 1.0
1.5 **
# I
L
C2
(x10
4)
5 0.0
0.5 1.0 1.5 2.0 2.5
ILC
2
(% of L
ive
)
E
D
C
B
Brai
n
CL
N
A
FIG 9Effect of IL-10 deficiency on ILC2 cells. WT and IL-10⫺/⫺B6 mice were intranasally infected with 105
PFU TE12. Flow cytometric analysis of isolated cells pooled from the brains and CLNs of 10 WT (black bars) and IL-10⫺/⫺(white bars) mice at 5 days after infection is shown. (A) Representative flow cytometry
plots of ILC2 cells defined as IL-7Ra⫹lineage⫺Gata3⫹. (B to E) Number and percentage of ILC2 cells in
brain (B and C) and CLN (D and E). The data are plotted as the mean⫾SEM from 3 independent experiments.**,P⬍0.01;***,P⬍0.001.
on November 6, 2019 by guest
http://jvi.asm.org/
[image:10.585.64.350.70.521.2]0 3 5 7 10 14 21 0
20 40 60 80 100
IL
-17
a
mRNA
Fold Chang
e WTIL10KO
0 3 5 7 10 14 21 100
101 102 103 104
IL
-2
3
a
mRNA
Fold Chang
e
*** *** *
* ***
0 3 5 7 10 14 21 100
102 104 106 108
GM-CSF mRNA Fold Chang
e
7 10.
0 5 10 15
# CD4+ IL-17a+ (x10
2)
7 10.
0 10 20 30
# CD4+ IL-17a+ (x10
3)
0 3 5 7 10 14 21 0
20 40 60
IL-17a mRNA
Re
la
tiv
e
Gene Expressio
n
0 3 5 7 10 14 21 100
101 102 103 104
IL-23 mRN
A
Relative
Gene Expressio
n
**
**
0 3 5 7 10 14 21 100
102 104 106 108
GM-CSF mRN
A
Relative
Gene Expressio
n
*
7 10.
0.0 0.5 1.0 1.5
IL-17a+ (% of CD4+
)
7 10.
0.0 0.1 0.2 0.3 0.4
IL-17a+ (% of CD4+
)
B
A
F
E
Brai
n
CLN
G
H
Days Post Infection
D
C
I
J
K
FIG 10Effect of IL-10 deficiency on Th17 cells. WT and IL-10⫺/⫺B6 mice were intranasally infected with
105PFU TE12. (A to F) Analysis ofIl17a(A and B),Il23(C and D), andGmcsf(E,F) mRNA expression in the
brains of WT (filled squares, solid lines) and IL-10⫺/⫺(open circles, dashed lines) mice. GeneC
Tvalues were normalized to the GAPDH gene, and changes in levels were calculated relative to uninfected mice of the same strain (A, C, and E) or to uninfected WT mice (B, D, and F) (ΔΔCT). Data are pooled from two independent experiments and presented as the mean⫾SEM from 6 mice at each time point. (G to K) Flow cytometric analysis of cells isolated from the pooled (n⫽10) brains and CLNs of WT (black bars) and IL-10⫺/⫺(white bars) mice at 7 and 10 days postinfection. (G) Representative flow cytometry plots
of Th17 cells, defined as CD3⫹CD4⫹T cells producing IL-17a. (H to K) Number and percentage of Th17
cells in brain (H and I) and CLN (J and K). The data are plotted as the mean⫾SEM from 3 independent experiments.
on November 6, 2019 by guest
http://jvi.asm.org/
[image:11.585.53.358.71.598.2]deficient mice also had lower numbers and percentages of regulatory B cells in brains (Fig.
12B and C) and fewer, but similar, percentages in CLNs (Fig. 12D and E) than WT control
mice at 10 days after infection. These data suggest that IL-10 is important for development
of both T and B regulatory cell populations within the infected CNS.
Effect of IL-10 deficiency on CD19
ⴙB cells and antibody production in the CNS.
To determine the impact of IL-10 deficiency on B cell entry and antibody production,
CD19
⫹B cells were quantified (Fig. 13A). Mice deficient in IL-10 had lower numbers and
percentages of CD19
⫹B cells in both brains (Fig. 13B and C) and CLNs (Fig. 13D and E).
To determine the effect of fewer B cells on local antibody production, SINV-specific IgM
0 3 5 7 10 14 210 10 20 30 40
WT
IL10KO ***
* **
F
O
X
p
3 mRN
A
Fold C
h
a
n
g
e
7 10
0 10 20 30 40
# TReg
(x10
3)
7 10
0 5 10 15
**
***
WT IL10KO
# TReg
(x1
0
3)
0 3 5 7 10 14 21 0
10 20 30 40
**
FOXp3
m
R
N
A
Re
la
tiv
e
Ge
ne
Ex
pr
e
s
s
io
n
7 10
0 5 10 15
***
***
%
T
Re
g o
f
CD4
7 10
0 10 20 30 40
% T
R
e
g o
f
CD4
A
B
C
D
E
F
Brai
n
CLN
G
H
Days Post Infection
Days after infection
Days after infection
FIG 11Effect of IL-10 deficiency on regulatory T cells. WT and IL-10⫺/⫺B6 mice were intranasally infected
with 105PFU TE12. (A and B) Analysis offoxP3mRNA expression in the brains of WT (filled squares, solid
lines) and IL-10⫺/⫺ (open circles, dashed lines) mice during TE12 infection. Gene C
T values were normalized to the GAPDH gene, and changes in levels were calculated relative to uninfected mice of the same strain (A) or to uninfected WT mice (B) (ΔΔCT). Data are pooled from 2 independent experiments and presented as the mean⫾SEM from 6 mice at each time point.*,P⬍0.05;**,P⬍0.01;***,P⬍0.001. (C to H) Flow cytometric analysis of cells isolated from pooled (n⫽10) brains and CLNs from WT (black bars) and IL-10⫺/⫺(white bars) mice at 7 and 10 days postinfection. (C and D) Representative flow
cytometry plots of regulatory T cells, defined as CD3⫹CD4⫹CD25⫹foxP3⫹cells. (E to H) Number and
percentage of regulatory T cells in brain (E and F) and CLN (G and H). The data are plotted as the mean⫾SEM from 3 independent experiments.**,P⬍0.01;***,P⬍0.001.
on November 6, 2019 by guest
http://jvi.asm.org/
[image:12.585.60.347.70.500.2]and IgG antibodies were quantified via enzyme immunoassay (EIA) (Fig. 14). The
antibody response was delayed in IL-10
⫺/⫺mice compared to WT mice, with less
SINV-specific IgM antibody in brains (Fig. 14A) and spinal cords (Fig. 14B) at 7 and 10
days after infection and less SINV-specific IgG in brains (Fig. 14C) and spinal cords (Fig.
14D) on days 10 and 14 after infection.
DISCUSSION
Studies with the intermediate virulent TE12 strain of SINV provided the
oppor-tunity to study mechanisms of immunopathogenesis and viral clearance that are
modulated by IL-10 during alphaviral encephalomyelitis. IL-10 deficiency led to
prolonged morbidity, increased weight loss, increased mortality, and delayed viral
clearance after TE12 infection. IL-10 has an important role in regulating T cell
responses, particularly for subsets of CD4
⫹T cells. More severe disease in
IL-10-deficient mice compared to WT mice was associated with increased numbers of Th1
10 0
10 20 30
40 ***
WT IL10KO
#
B
Reg
s
(x 10
3)
10 0
5 10
15 ***
B
Re
g
s
(% CD19
)
10 0.0
0.5 1.0 1.5
B
Reg
(% CD19
)
10 0
1 2 3 4
***
# B Reg
s
(x
10
4)
B
C
D
E
Brai
n
CL
N
A
FIG 12Effect of IL-10 deficiency on regulatory B cells. WT and IL-10⫺/⫺B6 mice were intranasally infected
with 105PFU TE12. Flow cytometric analysis of cells isolated from the pooled brains or CLN of 10 WT
(black bars) and IL-10⫺/⫺(white bars) mice at 10 days postinfection is shown. (A) Representative flow
cytometry plot of regulatory B cells, defined as CD19⫹CD1dhiCD5⫹IgM⫹cells. (B to E) Numbers and
percentages of Bregs in brain (B and C) and CLN (D and E). The data are plotted as the mean⫾SEM from 3 independent experiments.**,P⬍0.01;***,P⬍0.001.
on November 6, 2019 by guest
http://jvi.asm.org/
[image:13.585.63.351.67.488.2]cells and decreased numbers of Tregs and Bregs, without a difference in Th17 cells.
IL-10 deficiency also resulted in delayed virus clearance associated with decreased
numbers of Th2 cells, ILC2 cells, and B cells along with lower levels of antiviral
antibody in the CNS. Therefore, in contrast to studies with NSV, IL-10 deficiency
affected outcomes by a combination of increased Th1-mediated rather than
Th17-mediated immunopathogenesis and delayed production of antiviral antibody in the
CNS, which is important for viral clearance.
Many cells can produce IL-10, but regulatory T cells play a major role during viral
infections of multiple organs, including the CNS (21, 32–35), and are important
deter-minants of NSV infection outcome in susceptible and resistant strains of mice (20).
SINV-induced neurologic disease is a manifestation of the inflammatory response to
infection rather than virus replication
per se
(36–38). In both NSV- and TE12-induced
encephalomyelitis, IL-10 deficiency and more severe disease were associated with
fewer Tregs in the CNS than in the CNS of WT mice (19). Furthermore, differences in
staining patterns in the current study suggest that Tregs in IL-10
⫺/⫺and WT mice may
also be functionally distinct. Impairment of regulatory cell production of IL-10 also
results in more severe disease during acute encephalitis caused by tick-borne
enceph-alitis virus, Japanese encephenceph-alitis virus, and mouse coronavirus (33, 39) and in the
10 0
10 20 30 40
**
# CD19
+
B cel
ls
(x 10
4)
10 0
5 10 15 20
25 ***
CD19
+
B
cel
ls
(% L
ive
)
10 0
10 20 30 40
**
WT IL10KO
#
CD19
+ B
cel
ls
(x
1
0
5)
10 0
10 20
30 **
CD19
+ B
c
e
ll
s
(%
Li
ve
)
B
C
D
E
Brain
CLN
A
FIG 13Effect of IL-10 deficiency on CD19⫹B cells in the CNS. WT and IL-10⫺/⫺B6 mice were intranasally
infected with 105PFU TE12. Flow cytometric analysis of isolated cells pooled from the brains and CLNs of 10
WT (black bars) and IL-10⫺/⫺(white bars) mice at 10 days postinfection is shown. (A) Representative flow
cytometry plot. (B to E) Frequency and percentage of CD19⫹B cells in brain (B and C) and CLN (D and E). The
data are plotted as the mean⫾SEM from 3 independent experiments.**,P⬍0.01;***,P⬍0.001.
on November 6, 2019 by guest
http://jvi.asm.org/
[image:14.585.75.340.66.453.2]autoimmune diseases of the nervous system experimental autoimmune encephalitis
and experimental autoimmune neuritis (40–42). Because IL-10 deficiency did not affect
numbers of Tregs in the CLN, the site of induction of the SINV-specific adaptive immune
response (16, 43), it is likely that IL-10 deficiency affects either recruitment to or
differentiation of Tregs in the CNS.
Both Th1- and Th17-mediated immunopathology can be regulated by IL-10.
Regu-latory T cells decrease Th1 responses primarily by downregulating major
histocompat-ibility complex (MHC) type II on antigen-presenting cells with suppression of
proin-flammatory chemokines and cytokines such as IFN-
␥
(44), while IL-10 directly inhibits
both differentiation and proliferation of Th17 cells (45, 46). IL-10 deficiency led to an
increase in Th17 cells in NSV-infected mice (19), but TE12-infected IL-10-deficient mice
had an increase in CNS Th1 cells without a change in Th17 cells. Early in TE12 infection,
IFN-
␥
was lower in IL-10
⫺/⫺mice than in WT mice, but later IFN-
␥
production was
higher and Th1 cells became more abundant. The reason for this change in pattern is
not known, but microglial cells and NK cells can produce IFN-
␥
independently of T cells
in acute infection (47), and in the absence of IL-10, innate factors such as transforming
growth factor

(TGF-

) may suppress IFN-
␥
production prior to arrival of adaptive
components of the immune response (48–52). Because TGF-

can induce the
differen-tiation of Th17 cells (53–58), a potential dose- and cytokine-dependent role for TGF-

in the differential responses of TE12- and NSV-infected IL-10-deficient mice is under
investigation.
A major effect of IL-10 deficiency on TE12 pathogenesis was a reduction in CNS Th2
and B cell responses compared to those in WT mice. Because Th1 cells and IFN-
␥
suppress Th2 cells and production of IL-4, increases in IL-10
⫺/⫺mice may contribute to
this defect. IL-10, along with IL-4, also plays an important role in isotype switching to
IgG and B cell survival (31, 59, 60). Antibody is essential to viral clearance during
alphaviral encephalomyelitis (12–16), and without Th2 cell activation, a mature B cell
and antibody response cannot be induced. Furthermore, a role for early production of
CNS antiviral antibody in determining outcome from arboviral encephalitis is
recog-nized for infections of both mice and humans (20, 61, 62). Decreased B cell infiltration
into the CNS was likely responsible for the delay in local production of antiviral IgM and
IgG, a delay in viral clearance, and higher mortality.
0 3 5 7 10 14 21 0.0
0.5 1.0 1.5
*** ***
O
D,
450n
m
0 3 5 7 10 14 21 0.0
0.1 0.2 0.3 0.4
** ***
WT IL10KO
O
D
, 450n
m
0 3 5 7 10 14 21 0.0
0.2 0.4 0.6 0.8
*** ***
O
D
, 450n
m
0 3 5 7 10 14 21 0.00
0.05 0.10 0.15 0.20
*** ***
OD,
450n
m
SINV-specific IgG
SINV-Specific IgM
Brai
n
S
p
in
al
Co
rd
A
C
B
D
Days after infection Days after infection Days after infection Days after infection
FIG 14Effect of IL-10 deficiency on antibody production in the CNS. WT and IL-10⫺/⫺B6 mice were
intranasally infected with 105PFU TE12. EIA measurement of SINV-specific IgM (A and B) and IgG (C and
D) antibodies in the brains (A and C) and spinal cords (B and D) of WT (filled squares, solid lines) and IL-10⫺/⫺(open circles, dashed lines) mice is shown. Data were pooled from 2 independent experiments
and are plotted as the means⫾SEM for 6 mice at each time point.***,P⬍0.001.
on November 6, 2019 by guest
http://jvi.asm.org/
[image:15.585.73.340.71.280.2]Reasons for the differences in the characteristics of NSV- and TE12-induced
immu-nopathogenesis and disease are not clear. The sequences of the surface glycoproteins
are identical, so this difference in virulence is likely the result of differences in the
nonstructural region of the virus genome that could lead to differences in peptide
epitopes recognized for induction of effector T cells (35). Another potentially important
difference is nucleotide 5 in the 5
=
untranslated region (UTR) (10). NSV has a G, while
Toto1101/TE12 has an A. The UTRs of alphaviral genomes play critical roles in the
regulation of RNA replication and translation, as well as interaction with the host
cellular machinery and immune response (63). This G/A polymorphism affects
interac-tion of the viral genomic RNA with the viral restricinterac-tion factor IFIT1/ISG56 (63), an
interferon-stimulated protein that blocks viral replication by interacting with the 5
=
UTRs of RNA viruses (63–66). IFIT1 usually distinguishes host mRNA from viral RNA that
is unmethylated at the 2
=
O position of the cap (64). Alphaviruses lack this modification
but evade IFIT1 inhibition by altering the structure of the 5
=
UTR with a G at nucleotide
5 (63).
Finally, there is interest in host viral replication blockers to identify new classes
of drugs that activate these genes. Antiviral drugs that target host proteins instead
of viral proteins could in theory minimize the emergence of resistance (66). IL-10
immune therapy is the focus of many clinical trials for the treatment of
inflamma-tory diseases (67–70). Because there are no therapeutic interventions for viral
encephalomyelitis, understanding the potential of IL-10 as a therapeutic agent
remains important.
MATERIALS AND METHODS
Animals and virus.C57BL/6J (WT) and B6.129P2-Il10tm1Cgn/J (C57BL/6 [backcrossed 13 times] IL-10⫺/⫺) mice were purchased from Jackson Laboratories and bred in-house. Mice in all experiments
were sex and age (4 to 6 weeks) matched. The TE12 strain of SINV was grown and assayed by plaque formation in BHK cells (10), and mice were infected intranasally with 1⫻105PFU in phosphate-buffered
saline (PBS). Morbidity and mortality were assessed as previously described (19) using the following scoring system: 0, no clinical signs observed; 1, abnormal hind-limb and tail posture, ruffled fur, and/or hunched back; 2, unilateral hind-limb paralysis; 3, bilateral hind-limb or full-body paralysis; and 4, dead. For collection of cervical lymph nodes (CLNs), brains, and spinal cords, mice were first deeply anesthe-tized with isoflurane and perfused with ice-cold PBS. Tissues were used fresh or were snap-frozen and stored at⫺80°C. All experiments were performed according to guidelines and protocols approved by the Johns Hopkins University Institutional Animal Care and Use Committee.
Quantification of infectious virus.Tissue homogenates (20%, wt/vol) were made by homoge-nizing frozen tissues in PBS. Homogenates were serially diluted in Dulbecco modified Eagle medium (DMEM) plus 1% fetal bovine serum (FBS), plated on BHK-21 cell monolayers, incubated for 1 h, overlaid with 1.2% Bacto agar, and incubated at 37°C with 5% CO2for 48 h. Cells were stained with
neutral red and plaques counted. The result for each time point is plotted as the geometric mean of the log10value of PFU per gram⫾standard error of the mean (SEM). Samples in which no virus
was detected at a 1:10 dilution were given a value midway between the lower limit of detection and zero for statistical analyses.
Mononuclear cell isolation.Mononuclear cells were isolated from brains and CLNs collected from WT and IL-10⫺/⫺mice at 5, 7, and 10 days postinfection. CLNs were pooled from 6 to 10 mice
per group per time point in 10 ml of RPMI plus 1% FBS and homogenized in C tubes using the GentleMACS system (Miltenyi) spleen program 1 for 2 cycles. Brain tissue was collected from 6 to 10 mice per group per time point in ice cold Hanks balanced salt solution. For cell isolation, 2 brains were pooled per C tube containing 4 ml of enzyme digest mix (RPMI–1% FBS, 1 mg/ml collagenase [Roche], 0.1 mg/ml DNase) and dissociated with scissors. Further dissociation was performed via GentleMACS (Miltenyi) brain program 3 (total of 5 times with two 15-min 37°C incubations with gentle rocking). All suspensions were filtered through 70-m cell strainers and centrifuged. Red blood cells were lysed using 2 ml of red blood cell lysis buffer for 3 min. Cells were washed with PBS and resuspended in 30% Percoll, underlaid with 70% Percoll for a 30/70% discontinuous gradient, and centrifuged for 30 min at 850⫻gat 4°C. The top layer was removed, mononuclear cells at the interface were collected, washed, and resuspended in PBS plus 2 mM EDTA, and live cells were counted using trypan blue exclusion.
Identification of cells by flow cytometry.For cell typing, 106cells were used for each panel. Cells
were stained with a violet live/dead stain (Invitrogen), blocked with rat anti-mouse CD16/CD32 Block (BD), surface stained for phenotyping, and fixed using a 1:1 dilution of 4% paraformaldehyde and fluorescence-activated cell sorter (FACS) buffer, and data were acquired. The surface marker anti-bodies (all from BD or eBioscience) used were anti-CD45–fluorescein isothiocyanate (FITC), CD3-allophycocyanin (APC), CD4 –peridinin chlorophyll protein (PerCP)-Cy5.5, CD8 –phycoerythrin (PE)-Cy7, CD25-PE, Lineage-FITC, IL-7Ra–PE-(PE)-Cy7, Gata3–PerCP-Cy5.5, CD19 –PerCP-Cy5.5, CD5–PE-(PE)-Cy7,
on November 6, 2019 by guest
http://jvi.asm.org/
CD1d-APC, and IgM-FITC. Cell types were defined as follows: T cells (CD3⫹), CD4 T cells (CD3⫹CD4⫹),
CD8 T cells (CD3⫹CD8⫹), regulatory B cells (CD19⫹CD5⫹CD1dhiIgM⫹), and ILC2 cells (lineage⫺
IL-7Ra⫹Gata3⫹).
For determination of T cell differentiation, transcription factor expression was assessed using the Foxp3 buffer set (eBioscience). After surface staining, cells were fixed, permeabilized, and stained (eBioscience) for Gata3, foxP3, ROR␥t, or Tbet. Cell types were defined as follows: Th1 cells (CD3⫹CD4⫹
Tbet⫹), Th2 cells (CD3⫹CD4⫹Gata3⫹), Th17 cells (CD3⫹CD4⫹ROR␥t⫹), and regulatory T cells (CD3⫹
CD4⫹CD25⫹foxp3⫹).
For determination of CD4⫹T cell cytokine production, 2⫻106to 3⫻106cells were stimulated with
RPMI plus 1% FBS containing 50 ng/ml of phorbol-12-myristate 13-acetate (PMA) and 1 g/ml of ionomycin in the presence of GolgiPlug (BD) for 4 h. After surface staining with CD3-APC (BD) and CD4-FITC (BD), cells were fixed and permeabilized using the Cytofix/Cytoperm kit (BD). Cytokine staining was performed alone or in conjunction with transcription factor staining. Cells were stained (BD) for IFN-␥–PE, IL-4 –PE, or IL-17a–PE. All flow cytometry data were acquired using the BD FACSCanto II flow cytometer and FACS Diva software and analyzed using FlowJo (v10.3.0).
Gene expression and viral RNA analysis using real-time PCR.RNA was extracted from frozen tissues using the RNeasy lipid mini-RNA isolation kit (Qiagen). RNA was quantified with a NanoDrop instrument, and 500 ng was used to synthesize cDNA with a high-capacity cDNA reverse transcription kit (Life Technologies). Quantification of viral RNA in brains and spinal cords was performed using 2.5l of cDNA, TaqMan Universal PCR master mix (Roche), TaqMan probe (5=-6-carboxyfluorescein [FAM]-CGCA TACAGACTTCCGCCCAGT-6-carboxytetramethylrhodamine [TAMRA]-3=(Applied Biosystems), and primers to the SINV E2 gene (forward, 5=-TGGGACGAAGCGGACGATAA-3=; reverse, 5=-CTGCTCCGCTTTGGTCGTA T-3=) on a 7500 Fast real-time PCR system for 50 cycles. Results were analyzed using Sequence Detector software, version 1.4, using a standard curve made of 10-fold dilutions of the SINV subgenomic region derived from a pGEM-3Z plasmid and normalized to endogenous mouse glyceraldehyde-3-phosphate dehydrogenase (GAPDH) RNA.
For cytokine gene expression, quantitative real-time PCR was performed using 2.5l of cDNA and TaqMan gene expression arrays forIfn␥,Il2,Il10,Il17a,Il4,gata3, andfoxp3in 2⫻Universal PCR Mastermix (Applied Biosystems). GAPDH mRNA levels were determined using the rodent primer and probe set (Applied Biosystems). All reactions were run on an Applied Biosystems 7500 real-time PCR machine. Transcript levels were determined by normalizing the target gene threshold cycle (CT) value to theCT value of the endogenous GAPDH housekeeping gene. This normalized value was used to calculate the fold change relative to uninfected mice of the same strain and, for IL-10⫺/⫺mice, also gene expression
relative to that in uninfected WT mice (ΔΔCTmethod).
Quantification of protein via EIA.IFN-␥protein levels in brains from WT and IL-10⫺/⫺mice infected
with TE12 were measured by enzyme immunoassay (EIA) (R & D Systems) according to the manufac-turer’s instructions. Brain homogenates (10%, wt/vol) from 6 mice per time point were pooled and tested in duplicate.
EIA was also used to quantify SINV-specific IgM and IgG antibodies in brains and spinal cords. Ninety-six-well MaxiSorp plates (Nalgene Nunc) were coated with 106PFU/well of polyethylene
glycol-precipitated SINV in 50 mM NaHCO3(pH 9.6) at 4°C overnight. Blocking buffer (10% FBS and 0.05%
Tween 20 in PBS) was added and left for 2 h at 37°C. Tissue homogenates (10%, wt/vol) diluted 1:2 in blocking buffer were added to the wells and incubated at 4°C overnight. Bound antibodies were detected using horseradish peroxidase-conjugated goat anti-mouse IgM or IgG (Southern Biotech) diluted 1:1,000 in blocking buffer and incubated at room temperature for 2 h. Plates were developed using the BD OptEIA tetramethylbenzidine (TMB) substrate reagent kit with H2SO4as a stop solution.
Absorbance was read at 450 nm. Average optical density (OD) values for tissues from uninfected mice were subtracted from the OD values for tissues from infected mice.
Statistical analysis.Data were from three independent experiments or at least 6 mice per group. All statistical analysis was done using GraphPad Prism 5 (v5.01). Survival was calculated using Kaplan-Meier survival curves (log rank [Mantel-Cox] test). Differences between groups during the course of infection were determined using a 2-way analysis of variance (ANOVA) and Bonferroni posttests to compare the differences between groups at each time point (morbidity, cellular infiltrates, cytokine analysis, and viral titers).
ACKNOWLEDGMENTS
This work was supported by a research grant from the National Institutes of Health
(R01 NS87539) to D.E.G. and a training grant (T32 AI007417) to N.M.M.
We thank Johns Hopkins School of Public Health animal facility technicians Mary
Archer and D. J. Johnson for help with animal maintenance and Victoria K. Baxter and
Elizabeth Troisi for animal breeding assistance.
REFERENCES
1. Thomas DL, Santiago GA, Abeyta R, Hinojosa S, Torres-Velasquez B, Adam JK, Evert N, Caraballo E, Hunsperger E, Munoz-Jordan JL, Smith B, Banicki A, Tomashek KM, Gaul L, Sharp TM. 2016. Reemergence of dengue in southern
Texas, 2013. Emerg Infect Dis 22:1002–1007.https://doi.org/10.3201/eid2206 .152000.
2. Griffin DE. 2010. Emergence and re-emergence of viral diseases of the
on November 6, 2019 by guest
http://jvi.asm.org/
central nervous system. Prog Neurobiol 91:95–101.https://doi.org/10 .1016/j.pneurobio.2009.12.003.
3. Saxton-Shaw KD, Ledermann JP, Kenney JL, Berl E, Graham AC, Russo JM, Powers AM, Mutebi JP. 2015. The first outbreak of Eastern equine encephalitis in Vermont: outbreak description and phylogenetic rela-tionships of the virus isolate. PLoS One 10:e0128712.https://doi.org/10 .1371/journal.pone.0128712.
4. Adams AP, Navarro-Lopez R, Ramirez-Aguilar FJ, Lopez-Gonzalez I, Leal G, Flores-Mayorga JM, Travassos da Rosa AP, Saxton-Shaw KD, Singh AJ, Borland EM, Powers AM, Tesh RB, Weaver SC, Estrada-Franco JG. 2012. Venezuelan equine encephalitis virus activity in the Gulf Coast region of Mexico, 2003–2010. PLoS Negl Trop Dis 6:e1875. https://doi.org/10 .1371/journal.pntd.0001875.
5. Gerardin P, Couderc T, Bintner M, Tournebize P, Renouil M, Lemant J, Boisson V, Borgherini G, Staikowsky F, Schramm F, Lecuit M, Michault A, Encephalchik Study Group. 2016. Chikungunya virus-associated encephalitis: a cohort study on La Reunion Island, 2005–2009. Neurology 86:94 –102.https://doi.org/10.1212/WNL.0000000000002234.
6. Laine M, Luukkainen R, Toivanen A. 2004. Sindbis viruses and other alphaviruses as cause of human arthritic disease. J Intern Med 256: 457– 471.https://doi.org/10.1111/j.1365-2796.2004.01413.x.
7. Tucker PC, Strauss EG, Kuhn RJ, Strauss JH, Griffin DE. 1993. Viral deter-minants of age-dependent virulence of Sindbis virus for mice. J Virol 67:4605– 4610.
8. Griffin DE, Levine B, Tyor WR, Tucker PC, Hardwick JM. 1994. Age-dependent susceptibility to fatal encephalitis: alphavirus infection of neurons. Arch Virol Suppl 9:31–39.
9. Thach DC, Kimura T, Griffin DE. 2000. Differences between C57BL/6 and BALB/cBy mice in mortality and virus replication after intranasal infec-tion with neuroadapted Sindbis virus. J Virol 74:6156 – 6161.https://doi .org/10.1128/JVI.74.13.6156-6161.2000.
10. Lustig S, Jackson AC, Hahn CS, Griffin DE, Strauss EG, Strauss JH. 1988. Molecular basis of Sindbis virus neurovirulence in mice. J Virol 62: 2329 –2336.
11. Griffin DE. 1976. Role of the immune response in age-dependent resis-tance of mice to encephalitis due to Sindbis virus. J Infect Dis 133: 456 – 464.https://doi.org/10.1093/infdis/133.4.456.
12. Binder GK, Griffin DE. 2001. Interferon-gamma-mediated site-specific clearance of alphavirus from CNS neurons. Science 293:303–306.https:// doi.org/10.1126/science.1059742.
13. Burdeinick-Kerr R, Griffin DE. 2005. Gamma interferon-dependent, non-cytolytic clearance of sindbis virus infection from neurons in vitro. J Virol 79:5374 –5385.https://doi.org/10.1128/JVI.79.9.5374-5385.2005. 14. Burdeinick-Kerr R, Wind J, Griffin DE. 2007. Synergistic roles of antibody
and interferon in noncytolytic clearance of Sindbis virus from different regions of the central nervous system. J Virol 81:5628 –5636.https://doi .org/10.1128/JVI.01152-06.
15. Burdeinick-Kerr R, Govindarajan D, Griffin DE. 2009. Noncytolytic clear-ance of sindbis virus infection from neurons by gamma interferon is dependent on Jak/STAT signaling. J Virol 83:3429 –3435.https://doi.org/ 10.1128/JVI.02381-08.
16. Griffin DE, Metcalf T. 2011. Clearance of virus infection from the CNS. Curr Opin Virol 1:216 –221.https://doi.org/10.1016/j.coviro.2011.05.021. 17. Griffin DE. 2011. Viral encephalomyelitis. PLoS Pathog 7:e1002004.
https://doi.org/10.1371/journal.ppat.1002004.
18. Rowell JF, Griffin DE. 2002. Contribution of T cells to mortality in neu-rovirulent Sindbis virus encephalomyelitis. J Neuroimmunol 127: 106 –114.https://doi.org/10.1016/S0165-5728(02)00108-X.
19. Kulcsar KA, Baxter VK, Greene IP, Griffin DE. 2014. Interleukin 10 modu-lation of pathogenic Th17 cells during fatal alphavirus encephalomyeli-tis. Proc Natl Acad Sci U S A 111:16053–16058.https://doi.org/10.1073/ pnas.1418966111.
20. Kulcsar KA, Baxter VK, Abraham R, Nelson A, Griffin DE. 2015. Distinct immune responses in resistant and susceptible strains of mice during neurovirulent alphavirus encephalomyelitis. J Virol 89:8280 – 8291.https:// doi.org/10.1128/JVI.00173-15.
21. Kulcsar KA, Griffin DE. 2016. T cell-derived interleukin-10 is an impor-tant regulator of the Th17 response during lethal alphavirus encepha-lomyelitis. J Neuroimmunol 295–296:60 – 67. https://doi.org/10.1016/j .jneuroim.2016.04.010.
22. McKinstry KK, Strutt TM, Buck A, Curtis JD, Dibble JP, Huston G, Tighe M, Hamada H, Sell S, Dutton RW, Swain SL. 2009. IL-10 deficiency un-leashes an influenza-specific Th17 response and enhances survival
against high-dose challenge. J Immunol 182:7353–7363.https://doi.org/ 10.4049/jimmunol.0900657.
23. Mutnal MB, Cheeran MC, Hu S, Little MR, Lokensgard JR. 2010. Excess neutrophil infiltration during cytomegalovirus brain infection of interleukin-10-deficient mice. J Neuroimmunol 227:101–110.https://doi .org/10.1016/j.jneuroim.2010.06.020.
24. Danikowski KM, Jayaraman S, Prabhakar BS. 2017. Regulatory T cells in multiple sclerosis and myasthenia gravis. J Neuroinflammation 14:117.
https://doi.org/10.1186/s12974-017-0892-8.
25. Cen Z, Guo Y, Kong Q, Zhou Q, Wu W. 2015. IL-10-producing B cells involved in the pathogenesis of coxsackie virus B3-induced acute viral myocarditis. Int J Clin Exp Pathol 8:830 – 835.
26. Lindberg E, Magnusson Y, Karason K, Andersson B. 2008. Lower levels of the host protective IL-10 in DCM—a feature of autoimmune pathogen-esis? Autoimmunity 41:478 – 483.https://doi.org/10.1080/089169308020 31645.
27. Liberal R, Grant CR, Holder BS, Cardone J, Martinez-Llordella M, Ma Y, Heneghan MA, Mieli-Vergani G, Vergani D, Longhi MS. 2015. In autoim-mune hepatitis type 1 or the autoimautoim-mune hepatitis-sclerosing cholan-gitis variant defective regulatory T-cell responsiveness to IL-2 results in low IL-10 production and impaired suppression. Hepatology 62: 863– 875.https://doi.org/10.1002/hep.27884.
28. Guo B. 2016. IL-10 modulates Th17 pathogenicity during autoimmune diseases. J Clin Cell Immunol 7:400.https://doi.org/10.4172/2155-9899 .1000400.
29. Kim BS, Artis D. 2015. Group 2 innate lymphoid cells in health and disease. Cold Spring Harb Perspect Biol 7:a016337.https://doi.org/10 .1101/cshperspect.a016337.
30. Halim TY. 2016. Group 2 innate lymphoid cells in disease. Int Immunol 28:13–22.https://doi.org/10.1093/intimm/dxv050.
31. Ho AS, Moore KW. 1994. Interleukin-10 and its receptor. Ther Immunol 1:173–185.
32. Reuter D, Sparwasser T, Hunig T, Schneider-Schaulies J. 2012. Foxp3⫹ regulatory T cells control persistence of viral CNS infection. PLoS One 7:e33989.https://doi.org/10.1371/journal.pone.0033989.
33. Trandem K, Jin Q, Weiss KA, James BR, Zhao J, Perlman S. 2011. Virally expressed interleukin-10 ameliorates acute encephalomyelitis and chronic demyelination in coronavirus-infected mice. J Virol 85:6822– 6831.https:// doi.org/10.1128/JVI.00510-11.
34. Jung MK, Shin EC. 2016. Regulatory T cells in hepatitis B and C virus infections. Immune Netw 16:330 –336.https://doi.org/10.4110/in.2016 .16.6.330.
35. Perlman S, Zhao J. 2017. Roles of regulatory T cells and IL-10 in virus-induced demyelination. J Neuroimmunol 308:6 –11.https://doi.org/10