This is a repository copy of Using Flow Cytometry to Analyze Cryptococcus Infection of
Macrophages..
White Rose Research Online URL for this paper:
http://eprints.whiterose.ac.uk/117211/
Version: Accepted Version
Book Section:
Evans, R.J. orcid.org/0000-0003-0678-6510, Voelz, K., Johnston, S.A.
orcid.org/0000-0002-3429-9536 et al. (1 more author) (2017) Using Flow Cytometry to
Analyze Cryptococcus Infection of Macrophages. In: Botelho, R., (ed.) Phagocytosis and
Phagosomes. Methods in Molecular Biology (1519). Springer New York , pp. 349-357.
ISBN 978-1-4939-6579-3
https://doi.org/10.1007/978-1-4939-6581-6_24
[email protected] https://eprints.whiterose.ac.uk/ Reuse
Unless indicated otherwise, fulltext items are protected by copyright with all rights reserved. The copyright exception in section 29 of the Copyright, Designs and Patents Act 1988 allows the making of a single copy solely for the purpose of non-commercial research or private study within the limits of fair dealing. The publisher or other rights-holder may allow further reproduction and re-use of this version - refer to the White Rose Research Online record for this item. Where records identify the publisher as the copyright holder, users can verify any specific terms of use on the publisher’s website.
Takedown
If you consider content in White Rose Research Online to be in breach of UK law, please notify us by
USING FLOW CYTOMETRY TO ANALYSE CRYPTOCOCCUS INFECTION OF
MACROPHAGES
Robert J. Evans1,2,3, Kerstin Voelz1, Simon A. Johnston2,3 and Robin C. May1
Affiliation
1
Institute of Immunology and Infection, School of Biosciences, College of Life and Environmental
Sciences, University of Birmingham, Birmingham, West Midlands, United Kingdom.
2
Bateson Centre, Firth Court, University of Sheffield, Western Bank, Sheffield, South Yorkshire
United Kingdom.
3
Department of Infection, Immunity and Cardiovascular Disease, Medical School, University of Sheffield, Sheffield, South Yorkshire, United Kingdom.
Running header
CRYPTOCOCCUS MACROPHAGE INFECTION FLOW CYTOMETRY
Summary
Flow cytometry is a powerful analytical technique, which is increasingly being used to study the
interaction between host cells and intracellular pathogens. Flow cytometry is capable of measuring a
greater number of infected cells within a sample compared to alternative techniques such as
fluorescence microscopy. This means that robust quantification of rare events during infection is
possible. Our lab and others have developed flow cytometry methods to study interactions between
host cells and intracellular pathogens, such as Cryptococcus neoformans, to quantify phagocytosis,
intracellular replication and non-lytic expulsion or ‘vomocytosis’ from the phagosome. Herein we
describe these methods and how they can be applied to the study of C. neoformans as well as other
similar intracellular pathogens.
Key words
Cryptococcus neoformans
Cryptococcus gattii
Flow cytometry
Macrophage
Mycology
1. Introduction
1.1 Cryptococcus neoformans and Cryptococcus gattii
The Cryptococcus genus is part of the basidiomycete phylum of the fungal kingdom of life. The genus
contains over 50 described species, however almost all human and veterinary cases of cryptococcal
infection are caused by just two species – Cryptococcus neoformans and Cryptococcus gattii.
Although these two species are closely related they present with different pathologies during
infection. C. neoformans is an opportunistic pathogen of individuals with existing immune
deficiencies whereas C. gattii can infect immune competent hosts. During infection both fungal
species interact with host phagocytes in the lungs and phagocytosis by host alveolar macrophages
provides an intracellular niche for Cryptococcus to replicate (4). However, occasionally cryptococci
can escape from the macrophage via a process known as non-lytic expulsion or ‘vomocytosis’ (3, 5,
6). The central role of macrophages during cryptococcal infection makes this host pathogen
interaction a key area of Cryptococcus research. In vitro cell culture is often used to study this
interaction as in many cases, the interaction between Cryptococcus species and macrophages cultured
in vitro can be used as a reliable indicator of virulence in vivo (2, 7).
Methods to quantify cryptococcal parasitism of macrophages with flow cytometry have been
previously published by our lab and others (1-3). Typically, such methods exploit Cryptococcus
strains with a genomic fluorescent tag (1), or a combination of antibody and cell dye stains (2, 3).
Herein we will describe our previously published method for flow cytometry analysis of cryptococcal
phagocytosis by macrophages and subsequent Cryptococcus replication within the phagosome (1).
1.2 Creating fluorescently tagged Cryptococcus strains
Our protocol relies on the use of Cryptococcus strains that have been genetically modified to express
a fluorescent marker protein such as green fluorescent protein (GFP). During the development of this
assay we created two fluorescent strains in the H99 (C. neoformans var. grubii serotype A, genotype
VNI) and R265 (C. gattii serotype B, genotype VGII) genetic backgrounds. These two strains are both
common ‘wild type’ reference strains used by many Cryptococcus researchers.
The step by step generation the H99-GFP and R265-GFP used in this study can be found in our
previous publication (1) but, in brief, cryptococci were transformed via biolistic delivery with an
insertion cassette containing the GFP gene flanked upstream by the Cryptococcus JEC21 actin
For an investigator seeking to make their own fluorescently tagged strains a number of factors must
be considered once stable transformants have been produced to ensure valid results in the flow
cytometry assay. It must be ensured that the insertion of the transgene and/or its expression has not
significantly altered the physiology of the fluorescent mutant in comparison to its wild type parent.
This process is important as it helps to ensure the validity of all future findings using the transformed
strain (see Note 1).
2. Materials
2.1 Cells and strains
1. J774.A1 cells were acquired from the European Collection of Authenticated Cell
Cultures (ECACC).
2. The genetic background for the fluorescent Cryptococcus neoformans mutants used
was H99 C. neoformans var grubii. serotype A.
2.2 Specialist equipment
1. Class II laminar flow hood: Cryptococcus neoformans is a class II organism and as
such should be worked on inside a class II safety hood to protect the user.
Additionally, cells in culture are easily susceptible to outside contamination;
therefore, any work with uninfected cells should be performed within a laminar flow
hood.
2. Tissue culture incubator: mammalian cells such a J774 cells should be grown in a
specialist incubator that can control heat, humidity and CO2 levels. J774 cells are
grown at 37 oC with 5% CO2 and 95 % relative humidity.
3. Haemocytometer: to determine the correct concentration of Cryptococcus neoformans
cells for infection a haemocytometer counting chamber should be used. A BS 748
standard haemocytometer with a chamber depth of 0.1 mm is recommended.
4. Flow cytometer – this protocol requires a flow cytometer that is capable of exciting
and measuring GFP (excitation wavelength 395 nm, and detection wavelength 509
nm).
2.3 Media (Macrophage)
1. Serum supplemented DMEM: Dulbecco’s Modified Eagle medium, low glucose, 10
% v/v Fetal bovine serum (FBS), 1 % v/v 10,000 units Penicillin & 10 mg/ml
2. Serum free DMEM: Dulbecco’s Modified Eagle medium, low glucose, 1 % v/v
10,000 units Penicillin & 10 mg/ml streptomycin, 1 % v/v 200 mM L-glutamine.
Keep sterile and store at 4oC.
2.4 Media (Cryptococcus)
YPD (Yeast, peptone, dextrose) liquid growth media: 1 % w/v peptone, 1 % w/v
yeast extract and 2 % w/v D-(+)-glucose. Autoclave to sterilise.
YPD agar: Liquid YPD growth media + 2 % w/v agar. Autoclave to sterilise, pour
into 9 cm Petri dishes.
2.5 Miscellaneous reagents
Phorbol 12-myristate 13-acetate (PMA): l mg/ml PMA in dimethyl sulfoxide
(DMSO) store at -20 oC aliquoted.
Phosphate buffered saline (1x PBS): 8 g/L sodium chloride, 0.2 g/L potassium
chloride, 1.15 g/L disodium hydrogen phosphate, 0.2 g/L potassium dihydrogen
phosphate, in deionised H2O pH 7.3, autoclave to sterilise and store at room
temperature.
18B7 antibody (: 10 mg/ml in 100 % glycerol (a kind gift from Arturo Casadevall,
Johns Hopkins Bloomberg School of Public Health, Maryland USA), mouse IgG
against Cryptococcus capsule polysaccharide Glucuronoxylomannan store at -20 oC
aliquoted.
Accutase: use at concentration suggested by manufacturer, store at -20oC aliquoted. Fixing media: 2 % w/v formaldehyde, 2 % v/v FBS in 1x PBS, store at -20 oC
3. Protocol
3.1 Experimental design
1. C. neoformans samples to be analysed by this protocol need to be fluorescently tagged.
Additionally, a sample that contains macrophages infected with a non-fluorescent C.
neoformans strain is also need as a control for the flow cytometer (see section 3.4).
Ideally this non fluorescent strain should be the same genetic background as the
fluorescent Cryptococcus strain.
2. For each condition, 4 duplicate infections need to be prepared (e.g. four separate wells)
for measurement at each time point. The following time points are recommended for
the calculation of intracellular proliferation - 0 hours (2 hours post infection,
immediately after washing away extracellular yeast), 18 hours (20 hours post
infection), 24 hours (26 hours post infection) and 48 hours (50 hours post infection)
(see Note 2).
3.2 Cryptococcus preparation
Long term, Cryptococcus strains can be stored at – 80 oC in glycerol stocks or using Biobank storage
beads. For experimentation Cryptococcus strains are grown on YPD agar at 25 oC and stored at 4 oC.
1. Prepare overnight cultures of the fluorescently tagged Cryptococcus strain from YPD
agar stock plates 24 hours prior to the start of the assay. Grow overnight cultures in 2
ml YPD broth with constant rotational movement to prevent sedimentation.
2. On the day of experiment, transfer 1 ml of the overnight culture into a sterile 1.5 ml
microcentrifuge tube and wash 3 times with sterile PBS.
3. Once washed, count the overnight culture with a haemocytometer (a 1:20 dilution of
the overnight is usually sufficient for accurate counting) and dilute to a concentration
of 1x10⁷ Cryptococcus cells per 1ml in PBS in 1.5 ml microcentrifuge tubes.
4. Opsonise Cryptococcus for 1 hour with 10 g/ml anti capsular 18B7 antibody (a kind
gift from Arturo Casadevall, Albert Einstein College of Medicine, New York USA)
for best results put microcentrifuge tubes on a rotator. Alternatively, C. neoformans
can be opsonised with pooled human serum (separated from donor blood).
3.3 Macrophage infection
The J774 murine macrophage cell line is used here as an example, however this protocol could easily
be adapted for other in vitro cell lines or in vitro cultured primary monocytes/macrophages. While the
basic principles remain the same, when using this protocol for other cell types it will be important to
1. Before experimentation maintain J774 macrophages in serum supplemented (10 %
FBS) DMEM media for at least 4 passages (from liquid nitrogen storage) before use,
only use J774 cells between passages 4 and 15. Maintain J774 cells in T75 tissue
culture flasks and incubate at 37 oC with 5 % CO2 (see Note 2).
2. 24 hours prior to the start of the experiment, take a confluent T75 flask of J774 cells
and seed into a 24-well plate at a concentration of 1x10⁵ cells per well in 1 ml serum
supplemented DMEM. Incubate the plate for 24 hours at 37 oC, 5 % CO2.
3. 1 hour before the start of the experiment, activate the seeded macrophages by
removing the media and replacing with 1 ml serum free DMEM media supplemented
with 150 ng/ml phorbol 12-myristate 13-acetate (PMA) per well. Incubate for 1 hour
at 37 oC, 5 % CO2
4. After 1 hour incubation, remove the media from each well and replace with 1 ml
serum-free DMEM.
5. Infect the macrophage monolayer by adding 100 l washed and opsonised
fluorescently tagged C. neoformans (1x10⁷ Cryptococcus per ml, see step 3 in ‘3.1
Cryptococcus preparation’). Incubate for 2 hours at 37 oC, 5 % CO2.
6. After 2 hours incubation, aspirate the media from each well and wash gently with
37oC PBS to remove extracellular, non phagocytosed cryptococci. Repeat this wash
step, checking periodically under a tissue culture microscope to check for remaining
extracellular Cryptococcus cells (see Notes 3 and 4).
7. Once extracellular cryptococci cells have been washed away, add 250 l accutase to
each well and incubated for 15 minutes at 37 oC. After this incubation, gently pipette
the accutase to disassociate infected macrophages from the growing surface and to
create a single cell suspension.
3.4 Flow cytometer setup
The setup for each flow cytometer is different. This assay was developed using a FACSCaliber (BD
Biosciences), it should be possible to perform this assay using any flow cytometer that can detect
GFP.
1. Take the cell suspensions from the previous step. Fix the samples by adding an equal
volume of fixing media (2% formaldehyde, 2 % fetal bovine calf serum in PBS) to
the accutase samples (see Note 5).
2. To setup the flow cytometer, first calibrate the instrument using a non-fluorescent
control – (macrophages infected with a non fluorescent C. neoformans strain). Using
the dot plot output adjust the forward scatter (FSC-H) and side scatter (SSC-H)
non-fluorescent control also adjust the GFP detection channel (in this case FL1-H) using a
histogram output to set the negative fluorescent signal to a baseline value (on most
instruments this is three log10 from the detection maximum).
3. Analyse each sample, making sure to keep the same calibration settings throughout
the experiment. To enable reliable comparison between samples, collect events for
each sample over a fixed period. Ideally 10,000 events should be collected for each
sample to provide reliable data.
3.5 Data analysis
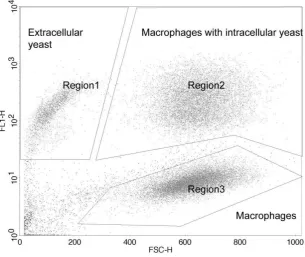
1. Phagocytosis – Display the collected data on a dot plot with FSC-H on the ‘X’ axis
and FL1-H on the ‘Y’ axis (as in figure 2). The rate of phagocytosis can be calculated
by comparing the number of macrophages with intracellular yeast (Figure 2
‘Region2’) to the number of macrophages without intracellular yeast (Figure 2
‘Region3’).
2. Intracellular proliferation – For each strain, collect data for a series of time points
post infection – 0 hours (2 hours post infection, immediately after washing away
extracellular yeast), 18 hours (20 hours post infection), 24 hours (26 hours post
infection) and 48 hours (50 hours post infection). Display the collected data for each
time point on a dot plot with FSC-H on the ‘X’ axis and FL1-H on the ‘Y’ axis (as in
figure 2). Draw a gate around the region of the plot containing macrophages with
intracellular yeast (Figure 2 ‘Region2’). For each time point calculate the geometric
mean fluorescent intensity of events within this gate. To calculate the intracellular
proliferation rate (IPR) take the time point with the highest mean fluorescent intensity
(usually 18 hours or 24 hours) , divide this mean fluorescent intensity by the mean
References
1. Voelz K, Johnston SA, Rutherford JC et al (2010) Automated analysis of cryptococcal macrophage parasitism using GFP-tagged cryptococci. PLoS One 5(12):e15968. 10.1371/journal.pone.0015968 [doi]
2. Alanio A, Desnos-Ollivier M, Dromer F (2011) Dynamics of Cryptococcus neoformans-macrophage interactions reveal that fungal background influences outcome during cryptococcal meningoencephalitis in humans. MBio 2(4):10.1128/mBio.00158-11. Print 2011.
10.1128/mBio.00158-11 [doi]
3. Nicola AM, Robertson EJ, Albuquerque P et al (2011) Nonlytic exocytosis of Cryptococcus neoformans from macrophages occurs in vivo and is influenced by phagosomal pH. MBio 2(4):10.1128/mBio.00167-11. Print 2011. 10.1128/mBio.00167-11 [doi]
4. Feldmesser M, Kress Y, Novikoff P et al (2000) PMC101732; Cryptococcus neoformans is a facultative intracellular pathogen in murine pulmonary infection. Infect Immun 68:4225-4237
5. Ma H, Croudace JE, Lammas DA et al (2006) Expulsion of live pathogenic yeast by macrophages. Curr Biol 16:2156-2160. S0960-9822(06)02225-1 [pii] 10.1016/j.cub.2006.09.032
6. Alvarez M, Casadevall A (2006) Phagosome extrusion and host-cell survival after Cryptococcus neoformans phagocytosis by macrophages. Curr Biol 16:2161-2165. S0960-9822(06)02294-9 [pii] 10.1016/j.cub.2006.09.061
7. Ma H, Hagen F, Stekel DJ et al (2009) Pmc2722359; The fatal fungal outbreak on Vancouver Island is characterized by enhanced intracellular parasitism driven by mitochondrial regulation. Proc Natl Acad Sci U S A 106:12980-12985. 10.1073/pnas.0902963106
Figure 1 – Schematic layout of pAG32_GFP plasmid used to create H99-GFP and R265-GFP (1).]
Figure 2 – Dot plot (FL1-H vs FSC-H) generated from flow cytometry data collected from a sample
of macrophages infected with a GFP tagged Cryptococcus strain. Three cell populations have been
‘gated’ – Region1 Extracellular yeast (GFP high, FSC low), Region2 Macrophages with intracellular yeast (GFP high, FSC high) and Region3 macrophages that do not contain intracellular yeast (GFP
4. Notes
1. To calculate the intracellular proliferation rate, the Cryptococcus count at the maximal time
point (e.g. the time point when Cryptococcus count is highest) is divided by the count at the
baseline (0hr) time point. Generally, the maximal time point is either 18 hr or 24 hr. At later
time points the fungal burden within macrophages decrease due to macrophage lysis.
2. To confirm a newly transformed strain behaves like the original during infection, a number of
tests should be performed. Firstly, the location of the insertion should be determined – e.g.
Southern blotting, genome sequencing of flanking regions. Ensure that the transformed
fragment has not inserted into a (known) gene. Additionally check how many copies of the
fragment have inserted into the strain (multiple insertions are possible), multiple insertions
help to increase a strain’s fluorescent signal however excessive expression of transgenes can
lead to sub-optimal growth due to increased cellular stress. Secondly the transformed strain
should be tested in a number of culture conditions and in cell culture (preferably in the same
cell line which will be used for the flow cytometry assay) to check for differences to the wild
type, which again could have been caused due to insertion and/ or expression of the transgene.
To see the full range of tests we performed on our H99-GFP and R265-GFP strains please
refer to our previous publication (1). Finally when using the strain for flow cytometry analysis
it must be confirmed that the fluorescent signal of the strain is resolvable from the
background auto-fluorescence which all cells display. In the case of our strains the
fluorescence signal was strong and easily discernible from non-transformed strains using
spectral confocal microscopy (1).
3. For best results never split the cells less than 1/8, while passaging as sparse cell numbers
affects cellular viability and potentially also immunological responses.
4. Three to four washes are usually sufficient to remove extracellular cryptococci, gentle tapping
of the plate can be performed between washes to encourage cryptococci cells to unstuck from
the plate surface.
5. While washing, care must be taken to avoid washing away macrophages – avoid pipetting
liquid directly onto the growing surface, always pipette liquid down the edge of the well.
6. The protocol we describe herein is a one colour assay – needing only GFP excitation (395
nm) and emission (509 nm) filters. The filter set used for GFP is the same used for fluorescein
isothiocyanate (FITC) – one of the most ubiquitous fluorophores in flow cytometry. Thus,
almost all flow cytometers should be capable of analysing samples produced using the below
protocol. Additional colours can be added to the protocol to allow the measurement of
additional parameters such as phagocytosed / non phagocytosed cells or to measure
7. When preparing macrophage samples for flow cytometry, different volumes of accutase and
fixing solution can be used to optimise sample concentration. For flow cytometry the sample
concentration should be adjusted such that the number of events per second detected by the
instrument is in its optimal range, this range differs between instruments. Always ensure that