White Rose Research Online URL for this paper: http://eprints.whiterose.ac.uk/112807/
Version: Accepted Version
Article:
Jin, H., Li, X., Kang, J. orcid.org/0000-0001-8995-5636 et al. (1 more author) (2017) An evaluation of the lighting environment in the public space of shopping centres. Building and Environment, 115. pp. 228-235. ISSN 0360-1323
https://doi.org/10.1016/j.buildenv.2017.01.008
Article available under the terms of the CC-BY-NC-ND licence (https://creativecommons.org/licenses/by-nc-nd/4.0/)
[email protected] https://eprints.whiterose.ac.uk/
Reuse
This article is distributed under the terms of the Creative Commons Attribution-NonCommercial-NoDerivs (CC BY-NC-ND) licence. This licence only allows you to download this work and share it with others as long as you credit the authors, but you can’t change the article in any way or use it commercially. More
information and the full terms of the licence here: https://creativecommons.org/licenses/
Takedown
If you consider content in White Rose Research Online to be in breach of UK law, please notify us by
An evaluation of the lighting environment in the public space of shopping centres
Hong Jin1,2, Xinxin Li1,2, Jian Kang1,2,3(), Zhe Kong4
1.School of Architecture, Harbin Institute of Technology, Harbin 150001, China
2.Heilongjiang Cold Region Architectural Science Key Laboratory, Harbin 150001, China
3.School of Architecture, University of Sheffield, Sheffield S10 2TN, UK
4.
School of Architecture and Urban Planning, University of Wisconsin-Milwaukee, Milwaukee, WI
53211, USA
* Corresponding author
Abstract: Interior lighting quality influences people’s visual comfort and satisfaction with a space. Based on a field study about the effects of lighting environments on occupancies in eight shopping malls with three different latitudes and a wide range of size from 30,000 to 210,000 m2 all over China, this study investigates the differences in subjective evaluations, the correlations between the lighting environments of public spaces and people’s evaluations, and the regressions of scene mean luminance. A questionnaire survey and HDR-image techniques have been used to gather subjective feedback and collect physical lighting data. The results show that the subjective evaluations among different groups (gender, age, education background, and duration of stay in the shopping malls) are similar. The existence of daylighting plays an important role in subjective satisfaction, but not crucial enough to their brightness perception. The mean luminance values of these scenes are closely correlated to the diversity of the subjective evaluations. For shopping centres, the optimal Lmean value is 1000 cd/m2 for a mixed daylighting and artificial lighting environment, and 75 cd/m2 as the recommended Lmean value for an artificial lighting environment.
Keywords: Shopping centre; Public space; Light environment; Luminance metric;
Subjective evaluation
1. Introduction
The turnover effects of shopping centre environments such as value perception, satisfaction, loyalty, and behaviours like the length of stay and shopping have been studied from the viewpoint of psychology [1-5]. The quality of light environment is an important consideration in shopping centres. Improving the artificial lighting and
introducing daylight has positive effects on turnover [6-9].
In terms of evaluating the light environment, the results of differential analysis may vary in different types of buildings. In the office, there is no significant difference amongst age groups regarding visual satisfaction [10]; The satisfaction with lighting of those workers occupying stations closer to the windows was significantly higher than those located in the core areas; However, gender elicited a difference in the evaluation of satisfaction with lighting only in the core areas and
men’s ratings were higher than the women’s [11]; Significant gender differences were observed for mean satisfaction level with each indoor environmental quality factor based on data from office buildings [12]; User satisfaction revealed significant differences in illuminance level in different workstation locations in modern offices located in Southern California[13]. In Hong Kong housing units, no significant difference was found between males and females, however, distinct differences were found amongst age groups in satisfaction evaluation, and the elders’ ratings were the highest [14]. Using nonparametric statistics, the differences among schools and between genders were studied based on physical measurements and a questionnaire survey in 28 classrooms in seven Italian primary schools [15]. The majority of differential analysis conducted on the shopping centre is about consumption psychology and behaviour [16, 17], but the field of light environment evaluation is studied less. Space layout is related to spatial attributes and various types of merchandise, which are related to the characteristics of the users in the shopping
centre. It is therefore essential to study the differences in light environment evaluation according to the types of light and the characteristics of occupants.
stimulation and performance [20]. Earlier research on the relationship between luminance level and subjective evaluation was focused on object and background luminance [21, 22], but it is difficult to get scene luminance values. In recent years, with the development of high dynamic range (HDR) imaging techniques, it is possible to collect luminance data of whole scenes [23]. It has also been proven that the error
margin is less than 10% by comparing HDR images and the actual measurements, which indicates that the per-pixel luminance value has reasonable accuracy and repeatability [24]. HDR imaging techniques can take into account all the luminance information in the view and the appropriate luminance metric to explain variability in subjective responses has been gradually explored. In the office located in Boise, Idaho, the most effective metrics are mean luminance of the task, and mean luminance of the entire scene; In terms of satisfaction with the view, standard deviation of the entire scene luminance is also a good predictor [25]. The predictive ability of the luminance-based metric for each questionnaire item is explored using HDR images and subjective evaluations from four separate field sites during winter 2016 in Eugene, Oregon [26]. The viability of HDR image tool is demonstrated, highlighting reduced luminance contrast on the egress staircase for lower visual acuity conditions [27]. There have been many developments in the field of luminance uniformity, daylight glare evaluation and sky modeling by using HDR imaging techniques [25, 28-38]. HDR imaging techniques are a more suitable method to evaluate light environment in shopping centres that have no fixed task position, however, the research in this field is scarce. In order to explore the appropriate metrics applied to the public spaces in shopping centres, luminance-based metrics including luminance level, luminance distribution, and the ratio of luminance are measured by using HDR images.
There was a statistically significant relationship between impressions and lighting levels [39]. The regression of light environment evaluations and objective
metrics can provide evidence for design indexes and index classification. In the office, the relationship between the proportions of the respondents who selected ‘satisfaction’ and illuminance is in the normal distribution, and a value of 2000lx corresponds to the
to luminance of the target and background [22]. The illuminance values in similarity spaces were usually proposed through research in a simple space, but the method is limited to meeting the basic demands of visual function and ignores the effects of building types on environmental psychology. In recent years, regression models for predicting the relationship between brightness and illuminance have been more
common for office and education buildings [41-44], however, we found only one study on large commercial buildings [45]. Since there is no research on the relationship between scene luminance-based metrics and subjective responses, this study therefore concentrates on it.
The aim of this paper is to explore the general satisfaction with light environments and occupants’ perceptions of luminance through a field study including both objective measurements and questionnaire surveys in shopping centres. We considered three aspects: we examined the differences caused by the characteristics of the users and two forms of lighting in subjective evaluations; we analysed the correlations between scene luminance-based metrics (absolute value, the percentage of the rating level, and luminous distribution) and subjective responses in order to determine the most effective metric; and we constructed the functions of subjective evaluation towards the lighting environment.
2. Methodology
2.1. Sites
The pedestrian street and atrium are the two most important types of public space in shopping centres. Their functions include business, traffic organization, and landscape. Consumers may remain in them for a longer period to go shopping, have a rest, or play, therefore, we chose these two public spaces for the field survey.
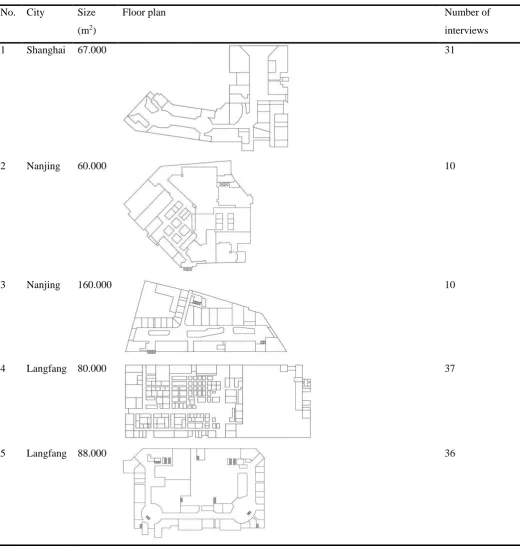
We selected eight shopping centres from four cities in China, namely Shanghai
No.4, No.5, No.6, No.7, No.8), and the other type is sidelight (No.1, No.2, No.6). The skylit space was selected for a more detailed study and this also avoided the orientation effect.
Table 1
Basic information of the case study sites. (For interpretation of the reference to colour in this table, the reader is referred to
the web version of this article.)
No. City Size
(m2)
Floor plan Number of
interviews
1 Shanghai 67.000 31
2 Nanjing 60.000 10
3 Nanjing 160.000 10
4 Langfang 80.000 37
6 Harbin 30.000 50
7 Harbin 123.870 47(41)
8 Harbin 210.100 60(57)
We carried out a more detailed study in two shopping centres, namely No.7 and No.8. The yellow and red lines stand for opening with and without daylight respectively, as shown in Table 1. One atrium has daylight in building No.7, while others have not. All of the pedestrian streets and the atriums have daylight in building No.8. Seventeen scenes in total were selected in the detailed study. The number of scenes with only artificial lighting is seven, on Floor 1 (Camera_2 and Camera_3), Floor 2 (Camera_4 and Camera_5), Floor 3 (Camera_5) and Floor 4 (Camera_4 and Camera_5) in building No.7. The number of scenes with daylight and artificial lighting is ten, on Floor 1 (Camera_1), Floor 2 (Camera_1) and Floor 3 (Camera_1) in building No.7, and on Floor 1 (Camera_1 and Camera_2), Floor 2 (Camera_1 and Camera_2) and Floor 3 (Camera_1, Camera_2 and Camera_3) in building No.8.
2.2. Questionnaire survey
[image:7.595.24.579.88.408.2]accordance with the previous studies was made. For each site 30–60 interviews were carried out. In total 281 interviews were conducted in eight public spaces in shopping centres, of which 98 interviews were part of a more detailed study in two shopping centres. The interviewees were selected randomly.
Table 2
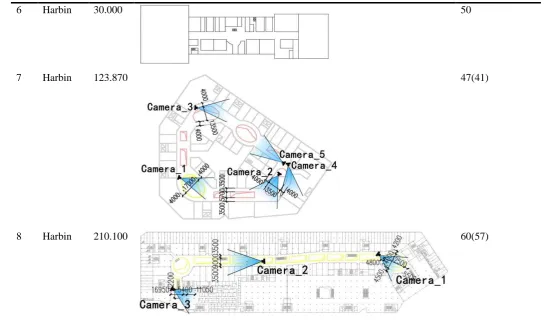
Summary of the research in the field of lighting evaluation.
Research area Source The type of
building The locations of studies Number of interviews Contents
Differences Boyce,
1973[10]
Laboratory - 150 Age groups
Boubekri,
1995[11]
Office - 102 Characteristics
of user and the
lighting
conditions
Xue et al.
2014[14]
Residence Hong Kong,
China
340 Characteristics
of users
Giuli V D et
al. 2012[15]
Classroom Ceggia,
Noventa di
Piave,
Maerne,
Spinea,
Italian
614 Among schools
and between
genders
Effective
metrics
Reinhart et al.
[image:8.595.86.510.209.751.2]2012, 2014
[46, 47]
Classroom - 60/334 Daylight
availability
metrics
Van Den
Wymelenberg
et al. 2010 [25]
Office Boise, Idaho 150 Predicting
human visual
comfort
Konis, 2014
[30]
Office San
Francisco,
California
523
and study area, classroom Relationship between subjective evaluation and objective metrics Mui and Wong, 2006 [41]
Office Hong Kong,
China
120 Average
illuminance and
lighting
satisfaction Cao et al. 2012
[42] Office, library, classroom Beijing and Shanghai, China 500
Huang et al.
2012 [44]
Office Beijing,
China
293
Jin and Li,
2014 [45]
Commercial
building
Harbin,
China
459 Horizontal
illuminance and
brightness
The space layout is based on the commodity classification which is related to the gender and age of the consumer. The evaluation of environment may differ among consumers with different education levels and lengths of stay which might cause a change of physical strength and mood. Therefore, interviewees were asked to record gender, educational background, age, and length of stay in the shopping centre.
The semantic differential method is widely used in the subjective evaluation towards the physical environment [48-51]. A subjective evaluation of light environment was also carried out, including satisfaction (five scales were used: 1, very dissatisfied; 2, dissatisfied; 3, neutral; 4, satisfied; and 5, very satisfied) and the luminous level (seven scales were used: 1, too dim; 2, dim; 3, dimmer; 4, neutral; 5, brighter; 6, bright; and 7, too bright).
The effect of natural and artificial lighting has been studied, and it has been shown that the evaluations of spaces with daylight are generally positive [52-55]. Therefore, the lighting conditions have been recorded in the case studies.
2.3. Objective data from HDR images
In the seventh and eighth buildings, we photographed multiple images while the questionnaires were distributed to participants. The Nikon D60 camera was used to take a sequence of images at f/5.6 at varying shutter speeds to cover a range from low
XYL-luminance meter with each scene for the calibration of the HDR images.
The HDR images were combined and analysed in Aftab alpha software. Figure. 1 shows two examples of the luminance distribution gathered from the atriums of two shopping centres. Compared with the first atrium, the access of daylight in the second atrium provides a dynamic lighting environment with a wider luminance distribution
that mainly ranges from about 0cd/m2 to 3000 cd/m2. The luminance data extracted from these HDR images are the mean luminance value of a scene (Lmean), the maximum (Lmax) and minimum (Lmin) luminance value, and the median luminance ratio of a scene (Lmedian). The appearance of ambient illumination that is related to adaptation levels and eye illuminance is divided into five scales [56]. This study selected two limits, 30cd/m2 corresponding to ‘lowest level for acceptably bright
appearance’ and 300cd/m2 corresponding to ‘distinctly bright appearance’ as the metric. Therefore, the percent of luminance ratios below 30cd/m2 (L30) and the percent of luminance ratios above 300cd/m2 (L300) were also calculated. Furthermore, the fluctuation of luminance distribution (Lstd, which is the standard deviation of luminance values), luminance contrast (Lmax/min, which is the ratio between the maximum and minimum luminance ratios of a scene), and luminance uniformity (Lmin/mean, which is the ratio between the minimum and mean luminance ratios of a scene) were also used for HDR images analysis.
(a)
(b)
Fig. 1. The HDR images and falsecolor images of two atriums in the shopping centres. (a)An
[image:10.595.92.502.481.702.2]3. Results
3.1. Differences in lighting evaluation
The effects of the users’ characteristics and the lighting conditions on satisfaction and brightness of lighting environment, which are based on nonparametric tests of independent samples, are discussed in this section. The Mann-Whitney U test and
Kruskal-Wallis-test were used to evaluate 2-independent and k-independent samples respectively.
3.1.1. The characteristics of the users
Table 3 shows the differences in subjective lighting evaluation among the various groups by gender, education level, age, and the length of stay for 281 interviews in all. In terms of occupant satisfaction and brightness, there is no significant difference
among different population groups (p 0.05). Therefore, the classification of
[image:11.595.85.512.564.762.2]interviewers was not taken into account. The results of this study show some differences from previous research in other types of buildings. Some studies about office buildings show that there is no significant difference amongst various age groups, and significant difference is found between different genders in core office areas, but not from those closer to the windows [10, 11]. A study in Hong Kong housing units showed that there is significant difference amongst various age groups, but not between males and females [14].
Table 3
The differences among different population groups.
Number of
interviewees
Satisfaction 1-5 Brightness 1-7
Mean Significance Mean Significance
Gender Male 121 3.52 0.230 3.98 0.083
Female 160 3.58 4.14
Education
level
High school and
secondary school
67 3.69 0.260 4.25 0.421
Bachelor degree 142 3.43 3.98
Master degree or
above
72 3.41 4.06
29-40 78 3.50 4.00
41 71 3.52 4.11
The length
of stay
Within an hour 85 3.43 0.402 4.04 0.561
1-2 h 99 3.45 4.04
2-3 h 58 3.61 4.02
More than 3 h 39 3.51 4.23
3.1.2. The lighting conditions
We conducted a difference analysis between the two lighting conditions. The number of interviewees is 177 and 104 respectively with and without daylight. Whether there was natural lighting in the space had a significant effect on occupant
satisfaction (p 0.05). The mean scores in the conditions with and without daylight
are 3.62 and 3.40 respectively. The result corresponds well with previous studies which demonstrate that people show positive attitudes towards daylighting evaluations. Nearly 78% of students thought working under daylighting conditions were better than under artificial lighting [53]. In libraries, occupants preferred the
zones closer to the window [55]. In offices, whether users were situated close to the windows or not had a significant effect on lighting satisfaction [11]. Our study shows
no significant effect on the brightness whether there is daylight or not (p 0.05).
Therefore, the data of the two different lighting conditions was analysed separately in the evaluation of satisfaction, but those were regarded as a whole to study in the evaluation of brightness.
3.2.1. The satisfaction under natural and artificial lighting conditions
The correlations between lighting satisfaction and luminance-based metrics under natural and artificial lighting conditions, based on data from a 61 occupant-survey, are shown in Table 4. There are strong correlations between Lmean ,
Lmax ,Lmin, Lmedian, Lstd, L30, L300 and the mean lighting satisfaction evaluations (p
0.01). The correlation with L30 is negative, whereas the other metrics are positive. There is a good correlation between luminance uniformity (Lmin/mean) and the mean
lighting satisfaction evaluation (p 0.05). There is no correlation between luminance
contrast (Lmax/min) and the mean lighting satisfaction evaluation (p 0.05). Based on
the significant level, the first available metric to evaluate the lighting satisfaction of the scene is Lmean, followed by Lstd and L30 under the mixed lighting conditions.
Table 4
Pearson correlation coefficients between the satisfaction of lighting environment and luminance-bases
metrics in the spaces with daylight and artificial lighting.
Lg (initial data) Initial data
Lmean Lmax Lmin Lmedian Lstd Lmax/min Lmin/mean L30 L300
Correlation 0.874** 0.775** 0.790** 0.812** 0.858** 0.507 -0.663* -0.845** 0.799**
Significance 0.001 0.008 0.007 0.004 0.002 0.135 0.037 0.002 0.006
**p 0.01.
* p 0.05.
3.2.2. The satisfaction under only artificial lighting conditions
Table 5 demonstrates the correlation between lighting satisfaction and luminance-based metrics under artificial lighting conditions based on the use of the survey data collected from 37 individuals. There is a good positive correlation
between Lmean and the mean lighting satisfaction evaluation (p 0.05), whereas others
metrics are not related to that.
Table 5
Pearson correlation coefficients between the satisfaction of lighting environment and
luminance-bases metrics in the spaces only with artificial lighting.
[image:13.595.75.522.402.478.2]Lmean Lmax Lmin Lmedian Lstd Lmax/min Lmin/mean L30 L300
Correlation 0.831* 0.342 -0.064 0.712 0.637 0.156 -0.331 -0.658 0.096
Significance 0.021 0.453 0.892 0.073 0.124 0.738 0.468 0.108 0.838
*p 0.05.
The above results are different from the ones from previous studies conducted in offices. A study on exploring the effective metrics to explain variability in subjective satisfaction responses shows that the top ten metrics are Max L Scene, Standard Deviation of Scene L, Mean L Glare Sources (based on five different mean luminance thresholds), DGP 10* Median L Scene, Mean Task L, and Sum Solid Angle of Glare Sources [25].
3.2.3. The brightness evaluation of the luminance level
Table 6 shows the correlations between the brightness evaluation and luminance-based metrics based on the use of the survey data collected from 98 individuals. There are strong positive correlations between the mean brightness
evaluations and the metrics of Lmean , Lmax , Lstd and L300 (p 0.01). There are good
positive correlations between the mean brightness evaluations and the metrics of
Lmedian and Lmax/min (p 0.05). There is no correlation between the mean brightness
evaluations and the metrics of Lmin, Lmin/mean and L30. Based on the significance level, the first available metric to evaluate the brightness of the scene is Lmax , the second is Lstd, the third are Lmean and L300.
Table 6
Pearson correlation coefficients between the brightness of lighting environment and luminance-bases metrics.
Lg (initial data) Initial data
Lmean Lmax Lmin Lmedian Lstd Lmax/min Lmin/mean L30 L300
Correlation 0.629** 0.678** 0.409 0.597* 0.661** 0.527* -0.448 -0.465 0.625**
Significance 0.007 0.003 0.104 0.011 0.004 0.030 0.071 0.060 0.007
**p 0.01.
*p 0.05.
[image:14.595.66.532.602.680.2]value is significantly related to an individual’s satisfaction degree and brightness perception, hence Lmean is proposed as the predictor to evaluate occupants’ estimation of lighting environments in shopping malls.
3.3. The regression of lighting evaluation
The relationships are established between the scenes’ mean luminance and the subjective evaluations. Each symbol of the regression curves represents the average of the subjective evaluations at the same scene. The range of the scenes’ mean luminance is from about 28 cd/m2 to 1120 cd/m2 in this study.
3.3.1. The satisfaction under natural and artificial lighting conditions
Figure 2 shows the relationships between Lmean and subjective satisfaction under natural and artificial lighting conditions using the survey data collected from 61 individuals, with a binomial regression and the R2 is 0.7944. When the Lmean is lower than a certain value, say 500 cd/m2, there is a remarkable growth in lighting satisfaction evaluation with the increase of the Lmean, whereas at the growth becomes progressively slower if the Lmean continues to increase. The evaluation value shows a peak when the Lmean is 1000 cd/m2.
3.3.2. The satisfaction only under artificial lighting conditions
Fig. 2. The relationship between satisfaction
and mean luminance under natural and artificial
[image:16.595.96.302.92.242.2]lighting conditions.
Fig. 3. The relationship between satisfaction
and mean luminance under only artificial
lighting conditions.
In previous studies, the regressions of the lighting satisfaction evaluations are mainly based upon horizontal illuminance and carried out in offices (Hong Kong and Beijing), libraries (Beijing and Shanghai) and classrooms (Beijing and Shanghai).
When the horizontal illuminance level is 1000lux, the satisfaction value is the highest [41-44, 57]. In order to compare with previous results, we converted our scene mean luminance values into eye vertical illuminance (E_Veye), according to E_Veye≈3.3* Lmean [56, 58]. That is to say, the peak E_Veye value is 3300 lux under mixed lighting conditions; The recommended E_Veye value is 248 lux under artificial lighting conditions.
3.3.3. The brightness evaluation of the luminance level
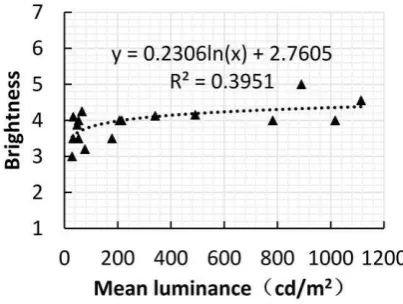
Figure 4 shows the relationship between Lmean and the brightness evaluation using the survey data collected from 98 individuals with a logarithm regression. The
predictive equation passed the F test (p 0.05). There is a significant correlation
Fig. 4. The relationship between brightness and mean luminance.
We compared our scene brightness evaluations to Bodman et al’s research on the
surface brightness of objects. The regression of the scene brightness evaluation is similar to previous results of Bodman’s research. However, the range of the brightness values is not wide in our study, a possible reason being that the brightness is based on the whole scene perception of users and is ranged from 1 to 7, whereas Bodman’s
research is based on the relative brightness amongst all the objects which is ranged from 1 to 100. The findings by Bodman et al are as follows: the relationship between brightness and object luminance is an S-shaped curve; under artificial lighting conditions, the scope of curve is the largest when the luminance ranges from 1cd/m2 to 100 cd/m2, and the brightness values at 100 remain unchanged when the luminance level is above 500 cd/m2; under daylighting conditions, the scope of curve is the largest when the luminance ranges from 5 cd/m2 to 200 cd/m2, and the brightness values at 95 remain unchanged when the luminance level is above 1000 cd/m2[59].
4. Conclusions
Based on occupants’ evaluation and the luminance maps generated through the
HDR-image techniques in eight shopping centres, we propose the conclusions below: 1) On the whole, there is no difference in responses based on the characteristics of users. In addition, the effects of daylight in a space on subjective evaluation have been studied. The existence of natural lighting in shopping malls can increase an
individual’s satisfaction with the lighting environment, which is consistent with
2) Based on this field study, the following luminance-based metrics for commercial environments are proposed: the three most effective metrics to reveal the
participants’ evaluation are Lmean, Lstd, and L30 in the mixed daylighting and artificial lighting conditions. Lmean is the only metric that has a significant correlation with the satisfaction evaluation in the artificial lighting only environments. For brightness
evaluation, the top effective four metrics are Lmax, Lstd, Lmean, and L300. In conclusion, there is a significant correlation between subjective evaluation and the mean luminance value of a scene. Therefore, the mean luminance value of a scene is
proposed as an appropriate metric to estimate users’ responses to lighting
environments in the public spaces of shopping centres.
3) According to the regression between subjective evaluation and the mean luminance value of a scene, 1000 cd/m2 is recommended as the mean luminance value with the existence of both natural and artificial lighting; 75 cd/m2 is recommended as the mean luminance value in only artificial lighting conditions. Furthermore, 200 cd/m2 provides the occupants with a neutral perception of brightness. The
interviewers felt that the light environment become ‘darker’ and ‘brighter’
respectively, when Lmean values become 24 cd/m2 and 1720 cd/m2.
Furthermore, it is noted that the overall comfort should be taken into account including soundscape and smellscape, for example, where considerable works have been carried out [60-62].
Acknowledgements
The authors would like to express sincere appreciation to the collaborator, including Nanjing Institute of Technology, Hebei Institute of Technology and Shanghai Weigu Engineering Industrial Co., Ltd. for collaboration. The work was supported by the National Natural Science Foundation of China (Grant No.
51438005).
References
[1] Donovan RJ, Rossiter JR. Store atmosphere: an environmental psychology approach. Journal of Retailing 1982, 58: 34-57.
[3] Donovan RJ, Rossiter JR, Marcoolyn G, Nesdale A. Store atmosphere and purchasing behaviour. Journal of Retailing 1994, 70: 283-94.
[4] Baker J, Parasuraman A, Grewal D, Voss GB. The influence of multiple store environment cues on perceived merchandise value and patronage intentions. Journal of Marketing 2002, 66: 120-41.
[5] El-Adly MI, Eid R. An empirical study of the relationship between shopping environment, customer perceived value, satisfaction, and loyalty in the UAE malls context. Journal of Retailing and Consumer Services 2016, 31: 217-27.
[6] Cuttle C, Brandston H. Evaluation of retail lighting. Journal of the Illuminating Engineering Society 1995, 24: 33-49.
[7] Boyce PR, Lloyd CJ, Eklund NH, Brandston HM. Quantifying the effects of good lighting: The Green Hills Farms project. Cleveland: Proceedings of the Illuminating Engineering Society of North America Annual Conference 1996.
[8] Boyce P, Hunter C, Howlett O. The benefits of daylight through windows. Troy, New York: Rensselaer Polytechnic Institute 2003.
[9] Heschong L, Mahone D, Kuttaiah K, Stone N, Chappell C, McHugh J, Burton S, Okura R, Wright B, Erwin M, Holtz. Skylighting and retail Sales: an investigation into the relationship between daylighting and human performance. San Francisco, California: The Pacific Gas and Electric Company 1999.
[10]Boyce PR. Age, illuminance, visual performance and preference. Lighting Research and Technology 1973, 5: 125-44.
[11]Boubekri M. Appraisal of the lighting conditions in an office building: results of a survey. Indoor and Built Environment 1995, 4: 162-9.
[12]Kim J, Dear RD, Cândido C, Zhang H, Arens E. Gender differences in office occupant perception of indoor environmental quality (IEQ). Building and Environment 2013, 70: 245-56.
[13]Choi JH, Moon J. Impacts of human and spatial factors on user satisfaction in office environments. Building and Environment 2016, 114: 23–35.
[14]Xue P, Mak CM, Cheung HD. The effects of daylighting and human behaviour on luminous comfort in residential buildings: a questionnaire survey. Building and Environment 2014, 81: 51-9.
[16]Alreck P, Settle RB. Gender effects on Internet, catalogue and store shopping. Journal of Database Marketing & Customer Strategy Management 2002, 9: 150-62. [17]Grewal D, Baker J, Levy M, Voss GB. The effects of wait expectations and store atmosphere evaluations on patronage intentions in service-intensive retail stores. Journal of Retailing 2003, 79: 259-68.
[18]Cuttle C. Brightness, lightness, and providing ‘a preconceived appearance to the
interior’. Lighting Research and Technology 2004, 36: 201-16.
[19]Ware C. Information visualization: perception for design. San Francisco: Morgan Kaufmann, 2012.
[20]DiLaura DL, Houser KW, Mistrick RG, Steffy GR. The lighting handbook: reference and application. New York: Illuminating Engineering Society of North America, 2011.
[21]Stevens SS. The psychophysics of sensory function. American Scientist 1960, 48: 226-53.
[22]Fischer D. A luminance concept for working interiors. Journal of the Illuminating Engineering Society 1973, 2: 92-8.
[23]Reinhard E, Heidrich W, Debevec P, Pattanaik S, Ward G, Myszkowski K. High dynamic range imaging: acquisition, display, and image-based lighting. San Francisco: Morgan Kaufmann 2010.
[24]Inanici MN. Evaluation of high dynamic range photography as a luminance data acquisition system. Lighting Research and Technology 2006, 38: 123-34.
[25]Van Den Wymelenberg K, Inanici M, Johnson P. The effect of luminance distribution patterns on occupant preference in a daylit office environment. Leukos 2010, 7: 103-22.
[26]Mahić A, Galicinao K, Van Den Wymelenberg K. A pilot daylighting field study: testing the usefulness of laboratory-derived luminance-based metrics for building
design and control. Building and Environment 2016, 113: 78-91.
[27]Tural E, Tural M. Luminance contrast analyses for low vision in a senior living facility: a proposal for an HDR image-based analysis tool. Building and Environment 2014, 81: 20-8.
prediction model for daylight environments with the use of CCD cameras. Energy and Buildings 2006, 38: 743-57.
[30]Konis K. Predicting visual comfort in side-lit open-plan core zones: results of a field study pairing high dynamic range images with subjective responses. Energy and Buildings 2014, 77: 67-79.
[31]Van Den Wymelenberg K, Inanici M. A critical investigation of common lighting design metrics for predicting human visual comfort in offices with daylight. Leukos 2014, 10: 145-64.
[32]Kong Z, Utzinger M, Liu L. Solving glare problems in architecture through integration of HDR image technique and modeling with DIVA. Proceedings of BS2015, 2015: 1221-8.
[33]Suk JY, Schiler M, Kensek K. Absolute glare factor and relative glare factor based metric: predicting and quantifying levels of daylight glare in office space. Energy and Buildings 2016, 130: 8-19.
[34]Suk JY, Schiler M, Kensek K. Investigation of existing discomfort glare indices using human subject study data. Building and Environment 2016, 13: 121-30.
[35]Bodart M, Cauwerts C. Assessing daylight luminance values and daylight glare probability in scale models. Building and Environment 2016, 113: 210-9.
[36]Konstantzos I, Tzempelikos A, Chan YC. Experimental and simulation analysis of daylight glare probability inoffices with dynamic window shades. Building and Environment 2015, 87: 244-54.
[37]Konstantzos I, Tzempelikos A. Daylight glare evaluation with the sun in the field of view through window shades. Building and Environment 2016, 113: 65-77.
[38]Inanici M, Hashemloo A. An investigation of the daylighting simulation techniques and sky modeling practices for occupant centric evaluations. Building and Environment 2016, 113: 220-31.
[39]Durak A, Olguntürk NC, Yener C, Güvenç D, Gürçınar Y. Impact of lighting
arrangements and illuminances on different impressions of a room. Building and Environment 2007, 42: 3476-82.
[40]De Boer JB, Fischer D. Interior lighting. Antwerp: Kluwer Technical Books, 1981.
[42]Cao B, Ouyang Q, Zhu Y, Huang L, Hu H, Deng G. Development of a multivariate regression model for overall satisfaction in public buildings based on field studies in Beijing and Shanghai. Building and Environment 2012, 47: 394-9. [43]Ye J, Li J, Ge C, Li Y. Evaluation on predicted dissatisfaction of indoor environment. HV&AC 2010, 40: 57-61.
[44]Huang L, Zhu Y, Ouyang Q, Cao B. A study on the effects of thermal, luminous, and acoustic environments on indoor environmental comfort in offices. Building and Environment 2012, 49: 304-9.
[45]Jin H, Li X. Light environment analysis and design strategies of large commercial buildings-a case study in Harbin. Journal of Harbin Institute of Technology 2014, 21: 1-9.
[46]Reinhart CF, Weissman DA. The daylit area–correlating architectural student assessments with current and emerging daylight availability metrics. Building and Environment 2012, 50: 155-64.
[47]Reinhart C, Rakha T, Weissman D. Predicting the daylit area—a comparison of students assessments and simulations at eleven schools of architecture. Leukos 2014, 10: 193-206.
[48]Monfared IG, Sharples S. Occupants’ perceptions and expectations of a green office building: a longitudinal case study. Architectural Science Review 2011, 54: 344-55.
[49]Chen B, Kang J. Acoustic comfort in shopping mall atrium spaces—a case study in Sheffield Meadowhall. Architectural Science Review 2004, 47: 107-14.
[50]Kang J, Zhang M. Semantic differential analysis of the soundscape in urban open public spaces. Building and Environment 2010, 45: 150-7.
[51]Ma H, Gong S. Laboratory study on effects of environment noise on children. Acoustical Society of America: Proceedings of Meetings on Acoustics, 2013.
[52]Heerwagen JH, Heerwagen DR. Lighting and psychological comfort. Lighting Design and Application 1986, 16: 47-51.
[53]Veitch JA, Hine DW, Gifford R. End users ‘knowledge, beliefs, and preferences for lighting. Journal of Interior Design 1993, 19: 15-26.
[54]Roche L, Dewey E, Littlefair P. Occupant reactions to daylight in offices. Lighting Research and Technology 2000, 32: 119-26.
Raja Tun Uda Public Library, Shah Alam. Procedia-Social and Behavioural Sciences 2012, 68: 244-57.
[56]Cuttle C. Lighting by Design. Oxford, UK: Architectural Press; 2008.
[57]Saunders JE. The role of the level and diversity of horizontal illumination in an appraisal of a simple office task. Lighting Research and Technology 1969, 1: 37-46.
[58]Wienold J. Daylight glare in offices. Freiburg, Germany: Fraunhofer Verlag; 2010.
[59]Bodmann HW, La Toison M. Predicted brightness-luminance phenomena. Lighting Research and Technology 1994, 26: 135-43.
[60]Q. Meng, J. Kang, H. Jin, Field study on the influence of spatial and environmental characteristics on the evaluation of subjective loudness and acoustic comfort in underground shopping streets, Appl. Acoust. 74 (2013) 1001-1009.
[61]J. Liu, J. Kang,T. Luo,H. Behm, Landscape effects on soundscape experience in city parks, Sci Total Environ. 454 (2013) 474-481.
[62]J.Y. Jeon, P.J. Lee, J. You, J. Kang. Acoustical characteristics of water sounds for soundscape enhancement in urban open spaces, J. Acoust. Soc. Am. 131 (2012) 2101-2109.