International Journal of Innovative Technology and Exploring Engineering (IJITEE) ISSN: 2278-3075, Volume-8 Issue-6, April 2019
Abstract: For the past one and half year decades, recommended system is playing a vital role and providing the outline and peripheral information to the mobile customers. The objective of the work is to recommend good quality mobiles for the requirement of the customers with all required amenities. Multilayer perceptron neural network classifier is the methodology deployed and employed for the recommendations. The result outcome will always be very precise and has got a high precision of accuracy because of the above said methodology. Reliability and the accuracy are the prominent factors to the non-functional activity and the customers to buy the trusted mobiles from the shopping cart. Ordinal values will taken into account for the evaluation of ten top mobiles. The real characterization can be gauged through the recommendation given by the customers in the respective portals. Customers’ sentiments and the values of their comments are the features used to gauge the commodity values. Overall in the research work recommendations are classified into supervised leanings. Non minor can easily get the most favorite mobile with existing money affordable by them to buy the mobile commodity.
Index Terms: Multilayer perceptron, Reliability, Accuracy, Recommender System and Sentiment analysis
I. INTRODUCTION
With the escalation of technology, more and more mobile
phones are introduced to the market through popular distribution channels. So there is uncertainty in the customers regarding the selection of mobile phones. E-commerce carts such as Flipkart, Amazon where users can search, buy, and sell different mobile phones with a few clicks. Use of Sentimental analysis in micro blogging sites to know user viewpoint SoftMax based algorithm is used to identify the user nature efficiently. Complete understanding on user interested over the product[1].These platforms also allow users to share their opinion about the products in the text reviews, ratings where they can express their satisfaction onRevised Manuscript Received on April 10, 2019.
K.R.Sekar, School of Computing, SASTRA Deemed University,
India
Makkena Sai Kumar, School of Computing, SASTRA Deemed University, India
Mogadampalli Jayanth, School of Computing, SASTRA Deemed University, India
N.Sivaramakrishan, School of Computing, SASTRA Deemed University, India
G.Sathiamoorthy, School of Humanities and Science, SASTRA Deemed University, India
specific mobile phone or request a new feature. Recent empirical studies showed that e-commerce reviews include feedback/opinion such as user requirements, bug reports, and documentation of user experiences with mobile phones. Product reviews are not only useful to the buyers for their purchasing decision but also extremely helpful for mobile companies and competitors. In understanding the emotions behind the user comments and to extract the reason behind it Polaris a system for analyzing and predicting users sentimental trajectories. Through trajectory and sentimental analysis users can obtain insight of the issue at a glance through other user comments [2]. The user opinions can be better grasped with analysis on user's ratings which helps the company and customers to get a good understanding of required features for opting a smartphone from wide range of variants in today mobile industry. To analyze the drawbacks in the software quality through user reviews QinU prediction, polarity classification and QinU scoring is the steps used in measuring the software reviews. QinUF automates software QinU measurement , therefore users could compare and acquire software [3]. To increase the quality of the online products by reviewing the customer suggestions Jont sentiment-topic model is used to extract the topics and associated sentiments in review texts. It helps business analytics operations by focusing on more relevant aspects that ultimately drive sales [4].Analyzing the viewpoints and sentiments of the users in the Twitter Cuckoo search method is used to find the optimum cluster heads from the sentimental contents of Twitter dataset. To know the latest trending topic on the internet by analyzing the user comments [5]. The information in the ratings and reviews represents “voice of the users" and is helpful to drive the development efforts and improve forthcoming release playing a key role in the revenue generation for the developers. So, in this paper we have applied a technique to get analysis and trend of various smart phones
II. RELATEDWORKS
To increase the quality of the online products by reviewing the customer suggestions Joint sentiment-topic model is used to extract the topics and associated sentiments in review texts. It helps business analytics operations by focusing on more relevant aspects that ultimately drive sales [4].Analyzing the viewpoints and sentiments of the users in the Twitter Cuckoo search method is used to find the optimum cluster heads from the sentimental contents of Twitter dataset. To know the latest trending topic on the internet by analyzing the user comments [5].
In reducing the error rate of video clips by incorporating
A Multi Layer Perceptron Classifier for
Content-based Recommender System
K.R.Sekar, Makkena Sai Kumar, Mogadampalli Jayanth, N.Sivaramakrishan,
G.Sathiamoorthy
contextual information from other utterances of the same clip. Hierarchical fusion with context modeling is used which fuses the modalities two in two and only then fusing all three modalities. Reduce in the error rate in the video clip to almost 10%. [6].To classify the opinions of the social media users expressed in the form of texts Corpora and lexicon based approaches are combined and lexicons are generated from the text. We can get a better understanding of the specific language and culture of twitter users and sentiment orientation of words in different contexts [7].Sentiment and emotional analysis in visualization of medical records of patient and identifying the type of disease and solution. Various sentiments and emotional analysis methodologies can be used to analyze the problem. Identifying the problem and cure for the disease from the complete reports of patient [8].Analysis of stock market indicators such as sensex and nifty has been done to predict the price of stock. Text mining and natural language programming are used to identify user emotions. Understanding in the ups and downs in stock market so that investors can invest [9].In analyzing peoples sentiments,opinions ,attitudes, and emotions on any topic products and services. Many methods like CRC, soft max algorithm etc., can be used to analyze. To know the higher preferences by many people on different products and services and hence, we can improve the quality of them [10].
III. APPLIED METHODOLOGY
The training set is taken from the website repository and the user sentiments above the top mobiles as arranged in a semantic so that to apply the methodology of multilayer
[image:2.595.310.556.135.365.2]perceptron neural network for classification. Here five attributes were employed as Excellent, Good, Bad, Satisfactory and Poor. The cardinal values will be distributed and normalized for manipulation purpose. Well reduced entropy training set were taken for increasing the accuracy of the Table 1.
Table 1.Training Set
Legends 1: Ex-Excelelnt, Gd- Good, Bt-Better, Sa-Satisfactory, Pr-Poor
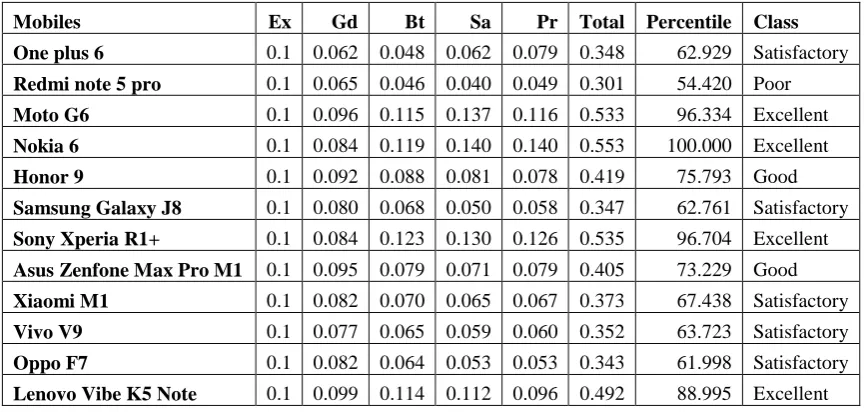
Table 2. Normalized Distribution with Class
Mobiles Ex Gd Bt Sa Pr Total Percentile Class
One plus 6 0.1 0.062 0.048 0.062 0.079 0.348 62.929 Satisfactory Redmi note 5 pro 0.1 0.065 0.046 0.040 0.049 0.301 54.420 Poor
Moto G6 0.1 0.096 0.115 0.137 0.116 0.533 96.334 Excellent
Nokia 6 0.1 0.084 0.119 0.140 0.140 0.553 100.000 Excellent
Honor 9 0.1 0.092 0.088 0.081 0.078 0.419 75.793 Good
Samsung Galaxy J8 0.1 0.080 0.068 0.050 0.058 0.347 62.761 Satisfactory Sony Xperia R1+ 0.1 0.084 0.123 0.130 0.126 0.535 96.704 Excellent Asus Zenfone Max Pro M1 0.1 0.095 0.079 0.071 0.079 0.405 73.229 Good Xiaomi M1 0.1 0.082 0.070 0.065 0.067 0.373 67.438 Satisfactory Vivo V9 0.1 0.077 0.065 0.059 0.060 0.352 63.723 Satisfactory Oppo F7 0.1 0.082 0.064 0.053 0.053 0.343 61.998 Satisfactory Lenovo Vibe K5 Note 0.1 0.099 0.114 0.112 0.096 0.492 88.995 Excellent
A. Multilayer Perceptron Classification
In the multi layered perceptron, the sigmoid value will be changed for the learning purpose of the method.The threshold value is also calculated for archiving the optimum results to the earliest. Fourteen iteration has been made to fix the supervised learning.
Mobiles Ex Gd Bt Sa Pr
One plus 6 710 160 40 20 70
redmi note 5 pro 734 169 38 13 44
Moto G6 505 250 95 44 103
Nokia 6 511 219 98 45 125
Honor 9 590 240 73 26 69
Samsung Galaxy J8 667 208 56 16 52 Sony Xperia R1+ 523 218 102 42 112 Asus Zenfone Max
Pro M1 592 247 65 23 70
Xiaomi M1 647 213 58 21 60
Vivo V9 670 201 54 19 53
Oppo F7 668 213 53 17 47
Lenovo Vibe K5 Note 525 257 94 36 85
[image:2.595.82.515.443.649.2]International Journal of Innovative Technology and Exploring Engineering (IJITEE) ISSN: 2278-3075, Volume-8 Issue-6, April 2019 Sigmoid Node 0, Threshold -2.44485970442835
Input Weight Input Weight
Node 4
0.12958139720214812
Node 5
-1.1422160166580497
Node 6
4.56637673678924
Node 7
-2.2763532664012085
Node 8
-0.062093580933367476
Node 9
0.3980041177295846
Node 10
-1.2615547165661463
Node 11
-0.17329600251594873
Node 12
-0.1057989963003019
Node 13
1.9842661064117113
Node 14
-0.6183795760407365
Sigmoid Node 1, Threshold 0.04639598154257539 Inputs Weights Inputs Weights
Node 4 -1.4419436240829677 Node 5 -0.8188760405570852 Node 6 -2.7335357001358296 Node 7 -1.509456199093708 Node 8 1.2709319333975884 Node 9 -1.7972230851355298 Node 10 -0.6908276590922425 Node 11 0.8283783474222036 Node 12 1.2915896739981905 Node 13 -1.9253120895991624 Node 14 -0.8587009634857665
Sigmoid Node 2 , Threshold -0.9074099331619964
Inputs Weights Inputs Weights Node 4 -0.02593891599515197 Node 5 1.5937985364497507 Node 6 -0.6821439567288093 Node 7 0.8531581845392925 Node 8 -1.7004698062671921 Node 9 -0.300155944961549 Node 10 1.612139763620821 Node 11 -3.1606313540279394 Node 12 -1.5232126272729911 Node 13 0.6262978208497636 Node 14 1.2002403031879278 S
Sigmoid Node 13, Threshold 0.09901086972676722
Inputs Weights Inputs Weights Inputs Weights
Attrib Mobile Name =One plus 6 0.5132108098395 418
Attrib Mobile Name =redmi note 5 pro
-1.675197931889 0753
Attrib Mobile Name =Moto G6 0.090356310180 36568
Attrib Mobile Name =Nokia 6 0.0142586148583 13097
Attrib Mobile Name =Honor 9 -1.584592612015 3964 Attrib Mobile Name =Samsung Galaxy J8 0.622067456497 6144 Attrib Mobile Name =Sony Attrib Mobile Name =Asus Attrib Mobile Name =Xiaomi Xperia R1+ 0.0775260194893 871
Zenfone Max Pro M1 -1.459075104210 365 M1 0.517566869271 4619 Attrib Mobile Name =Vivo V9 0.5672645639031 679
Attrib Mobile Name =Oppo F7 0.5945020009776 2
Attrib Mobile Name =Lenovo Vibe K5 Note 0.237400107022 25156 Attrib Excellent -0.015732385060 29203 Attrib Good -0.375193711721 99534 Attrib Satisfactory 0.253079179848 41155 Attrib Bad 0.3832618013963 9143 Attrib Worst 0.2016363429708 939 Attrib Total 0.206691229220 49185 Attrib Percentile 0.2831294651937 2634
Sigmoid Node 14, Threshold -0.010551016840935578
Inputs Weights Inputs Weights Inputs Weights
Attrib Mobile Name =One plus 6
0.104875072772 35857
Attrib Mobile Name =redmi note 5 pro
0.0811541225482 057
Attrib Mobile Name =Moto G6 0.3688269245593 6533
Attrib Mobile Name =Nokia 6 0.281846330366 4641
Attrib Mobile Name =Honor 9 -0.762908252606 8011 Attrib Mobile Name =Samsung Galaxy J8 0.0892107007196 5556 Attrib Mobile Name =Sony Xperia R1+ 0.303020165245 2199 Attrib Mobile Name =Asus Zenfone Max Pro M1 -0.598782701389 72 Attrib Mobile Name =Xiaomi M1 -0.007902097307 59472 Attrib Mobile Name =Vivo V9 0.089737616830 34183
Attrib Mobile Name =Oppo F7 0.0919686734881 061
Test Data Mobile
Name Excellent Good Satisfactory Bad Worst Total Percentile Honor 9 0.08 0.092 0.088 0.081 0.078 0.419 75.793
Input Node 0
Class Poor Input
Node 1 Class Excellent
Input Node 2
Class Good Input
Node 3
Predicted Class : Good ( Correctly Classified )
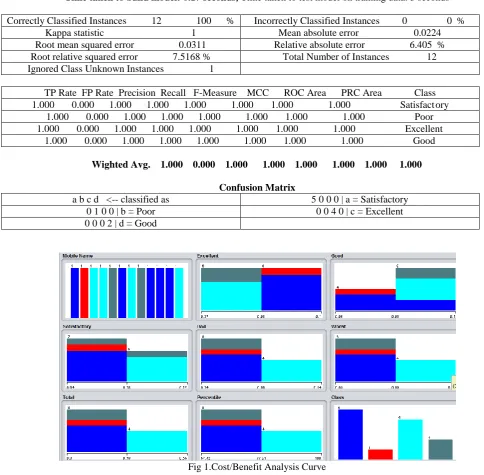
Time taken to build model: 0.17 seconds, Time taken to test model on training data: 3 seconds Correctly Classified Instances 12 100 % Incorrectly Classified Instances 0 0 %
Kappa statistic 1 Mean absolute error 0.0224 Root mean squared error 0.0311 Relative absolute error 6.405 % Root relative squared error 7.5168 % Total Number of Instances 12 Ignored Class Unknown Instances 1
TP Rate FP Rate Precision Recall F-Measure MCC ROC Area PRC Area Class 1.000 0.000 1.000 1.000 1.000 1.000 1.000 1.000 Satisfact ory
1.000 0.000 1.000 1.000 1.000 1.000 1.000 1.000 Poor 1.000 0.000 1.000 1.000 1.000 1.000 1.000 1.000 Excellent
1.000 0.000 1.000 1.000 1.000 1.000 1.000 1.000 Good
Wighted Avg. 1.000 0.000 1.000 1.000 1.000 1.000 1.000 1.000 Confusion Matrix
a b c d <-- classified as 5 0 0 0 | a = Satisfactory
0 1 0 0 | b = Poor 0 0 4 0 | c = Excellent
0 0 0 2 | d = Good
Fig 1.Cost/Benefit Analysis Curve
IV. RESULTS AND DISCUSSIONS
The normalized Table2 helps us to find the supervised value for the class were it found through statistical methodology. In the semantic of Table 2 each and mobile has got its own
attributes with significance. The customer satisfaction is the first and the foremost factor for this work. Their sentiments were taken into the account for the research recommender
system. Multilayer
[image:4.595.40.525.229.704.2]International Journal of Innovative Technology and Exploring Engineering (IJITEE) ISSN: 2278-3075, Volume-8 Issue-6, April 2019 iteration methods were exhibits with sigmoid value. For
every sigmoid value threshold has been found. In this small range of sample training set, 14 iteration have been made to get the results. The obtained results shows the correct predictions made and the outcome results are good for the incoming patterns. The well trained dataset and the confusion matrix also provides and proves the supervised learning is perfect. The test data or pattern taken from the same semantic of Table2 for the testing purpose. Our model builds within 17 seconds. The cost and benefits ratio was calculate and depicted as Fig1. The Root mean squared error, Mean absolute error, Relative absolute error and Root relative squared errors were identified for correct predictions.
V. CONCLUSION
In this research work top mobiles are gagged through the customer sentiments and their superstitious. Here this methodology of mining is meant for non mining persons. The Semantic collected from the Google sites and other repository and arranged to the good order for the predictions. The ordinal and nominal values were converted into cardinal values for real time predictions. Multilayer perceptron will classify the pattern in high rate of predicting the results in optimum level. Sigmoid value and the thresholds brings the iterations to converge the lot rather at the earliest. The confusion matrix remains the research no to deviate the process at any instance. Taking large sample of training set and the set data will provide greater accuracy to the work. Still huge and brilliant methodology are awaiting for the researchers to do the wonder in the months to come.
REFERENCES
1. Khanna, Bhavish, Sharon Moses, and M. Nirmala. "SoftMax based User Attitude Detection Algorithm for Sentimental Analysis." Procedia Computer Science 125 (2018): 313-320.
2. Yoo, SoYeop, JeIn Song, and OkRanJeong. "Social media contents based sentiment analysis and prediction system." Expert Systems with Applications 105 (2018): 102-111.
3. Atoum, Issa. "A novel framework for measuring software quality-in-use based on semantic similarity and sentiment analysis of software reviews." Journal of King Saud University-Computer and Information Sciences (2018).
4. Li, Xiaolin, Chaojiang Wu, and Feng Mai. "The effect of online reviews on product sales: A joint sentiment-topic analysis." Information & Management 56, no. 2 (2019): 172-184.
5. Pandey, Avinash Chandra, Dharmveer Singh Rajpoot, and MukeshSaraswat. "Twitter sentiment analysis using hybrid cuckoo search method." Information Processing & Management 53, no. 4 (2017): 764-779.
6. Majumder, Navonil, Devamanyu Hazarika, A. Gelbukh, Erik Cambria, and SoujanyaPoria. "Multimodal sentiment analysis using hierarchical fusion with context modeling." Knowledge-Based Systems 161 (2018): 124-133.
7. Keshavarz, Hamidreza, and Mohammad SanieeAbadeh. "ALGA: Adaptive lexicon learning using genetic algorithm for sentiment analysis of microblogs." Knowledge-Based Systems 122 (2017): 1-16.
8. Vij, Anneketh, and JyotikaPruthi. "An automated Psychometric Analyzer based on Sentiment Analysis and Emotion Recognition for healthcare."
Procedia Computer Science 132 (2018): 1184-1191.
9. Bhardwaj, Aditya, Yogendra Narayan, and Maitreyee Dutta. "Sentiment analysis for Indian stock market prediction using Sensex and nifty." Procedia Computer Science 70 (2015): 85-91.