Int. J. Electrochem. Sci., 11 (2016) 2119 - 2129
International Journal of
ELECTROCHEMICAL
SCIENCE
www.electrochemsci.org
Fabrication of an All Solid State (ASS) Polymeric Membrane
Sensor (PME) for Tramadol and Its Application
Mohammad Reza Ganjali1,2,*, Bagher Larijani3, Eslam Pourbasheer4
1
Center of Excellence in Electrochemistry, Faculty of Chemistry, University of Tehran, Tehran, Iran
2
Biosensor Research Center, Endocrinology & Metabolism Molecular-Cellular Sciences Institute, Tehran University of Medical Sciences, Tehran, Iran
3
Endocrinology & Metabolism Research Center, Endocrinology & Metabolism Clinical Sciences Institute, Tehran University of Medical Sciences, Tehran, Iran
4
Department of Chemistry, Payame Noor University (PNU), P.O. Box 19395-3697, Tehran, Iran
*
E-mail: [email protected]
Received: 9 November 2015 / Accepted: 19 December 2015 / Published: 1 February 2016
Tramadol is a 4-phenyl-piperidine analogue of codeine which is mainly used as an analgesic agent prescribed for moderate to severe pains. The compound is commonly available as a hydrochloride salt. Due to the widespread applications of tramadol, and the consequent need for its analysis in various samples, the current work focuses on the development of an all solid state polymeric membrane electrode (ASS-PME) for the facile and rapid analysis of tramadol hydrochloride in pharmaceutical formulations, using an ion-pair compound in the sensing element. The best results were observed with PME containing 8% w/w of TM-tetraphenyl borate ion-pair, 58% w/w of dibutyl sebacate as the solvent mediator, 31% w/w of PVC as the polymeric matrix, 3% w/w of an ionic liquid as the ionic additive. The all solid state (ASS) element which was later coated with the PME was a composite of graphite, multi walled carbon nanotubes (MWCNTs), and an epoxy resin. The composite was coated on a copper wire, as the internal contact. The tramadol selective ASS-PME showed a Nernstian response of 56.3±0.4 mV/decade in a broad concentration range (i.e. 1.0×10⁻⁷ to 1.0×10⁻³ M). The application device was validated and the results showed that the developed ASS-PME can be reliably used the analysis of Tramadol hydrochloride in pharmaceuticals. This was further tested through the measurement of the active ingredient of tramadol tablets, the results of which turned out to be accurate and precise.
Keywords: Tramadol, Sensor, All solid state, Potentiometry, Pharmaceutical formulation
1. INTRODUCTION
in biological samples is conventionally carried out through methods like high performance liquid chromatography (HPLC) [2-6], spectrophotometry [7,8] and advanced electrochemical method [9].
Although such instrumental techniques enjoy advantages of reasonable sensitivity and low detection limits, the application of potentiometric ion selective electrodes presents further advantages like simplicity, high analysis speeds, and wide applicable concentration ranges, in addition to inherent good selectivity and low detection limits of these inexpensive and portable devices. In consequence, many potentiometric sensors have been devised and used for the determination pharmaceutical analytes [10-14].
One important issue is that potentiometric ion-selective sensors have various configurations and are hence classified into different families [15-24], including PVC membrane electrodes (PMEs), coated wire electrodes (CWE), carbon paste electrodes (CPE), all solid state electrodes (ASS) and field effective transistors (FET).These electrodes can be divided into two major classes based on the nature of the phases present on the two sides of the sensing elements. In other words in case the sensing element is in contact with two identical phases (i.e. solutions) on both sides it These types of ISEs, based on the way which PVC membrane is placed on the transducer, it is considered a symmetrical device, while in cases like CWE, FET, and ASS where the inner surface of the sensing element is in contact with a solid element, while the outer surface comes in contact with liquid sample media the device is defined as being asymmetric. A symmetric electrodes (general PVC membrane electrodes, PNE) can easily remove during the long time treatments. Apart from improved mechanical stability, asymmetric devices excel the symmetric sensors in terms of the detection limit and a change of detection limits from about 10-5 to 10-7, which is typical from the symmetric devices, to about10-8 M or lower is observed.
In the light of the above mentioned issues all-solid-state polymeric membrane electrodes (ASS-PME) [25-29] are considered asymmetric electrodes [30-33], in which a conductive composite mainly composed of graphite and epoxy resin coated on a metal wire (e.g. a copper wire) acts as the internal contact to transduce the chemical signal, while outer layer of a tailored PVC membrane which is coated on this solid element introduces the required selectivity for analytical purposes. These devices provide low detection limits, and since the inner solution is not present in these configurations they do not need the optimization and replenishment of the inner filling solution in addition to better mechanical stability and simpler structures.
2. EXPERIMENTAL SECTION
2.1. Apparatus and measurements
The measurements were carried out in a cell with the following configuration; Cu wire | ASS layer | PVC membrane | sample solution || Ag-AgCl, KC1 (satd.)
Where the developed ASS-PME (shown as Cu wire | ASS layer | PVC membrane) acts as the indicator electrode, as opposed to a Ag/AgCl reference electrode (Azar-Elelectrode Co., Iran). The two electrodes were externally in contact with each other through a 250 pH/mV meter of ±0.1 mV precision. To conduct the measurements calibration curves were plotted using standard solutions.
2.2. Materials and Reagents
Analytical grade sodium tetraphenyl borate (NaTPB), potassium tetrakis (p-chlorophenyl) borate (KTPClPB), acetophenon (AP), dibutyl phthalate (DBP), nitrobenzene (NB), dibutyl sebacate (DBS), benzyl acetate (BA), 1-n-butyl-3-methylimidazolium tetrafluoroborate ([bmim]BF4),
tetrahydrofuran (THF) and graphite powder (1–2 μm) from Merck Co; high-molecular weight polyvinylchloride (PVC) from Fluka Co.; MWCNTs (10-40 nm diameters, 1-25 μm length, core diameter: 5-10 nm, SBET: 40-600 m2/g, Vtotal: 0.9 cm3/g, bulk density 0.1 g/cm3, true density 2.1
g/cm3 and with 95% purity) from the Research Institute of the Petroleum Industry, Iran; Macroplast Su 2227 from Henkel Co.; and Desmodur RFE from Bayer Ag; tramadol hydrochloride (TM-HCl) from Sigma-Aldrich; and pharmaceutical formulations from a local pharmacy (Tehran, Iran), were used for the construction of the electrode and the tests.
A 0.1 M solution of the water soluble TM.HCl in distilled water was prepared and the other solutions the concentrations of which ranged from 1×10⁻⁸ to 1×10⁻² M were prepared through the dilution of this stock solution and stored at 4°C.
The stock solution of the real samples were prepared by carefully weighing and transferring the equivalent of 5 tablets from the powder prepared through crushing twenty 20mg Tramadol tablets, into a 100-mL volumetric flask. Next some water was added to the flask and the content was completely shaken to dissolve the powder. Finally the flask was filled with a 0.1 M acetate buffer (pH=4). The analysis were performed after filtering the solution using a Millipore filter (0.45 mm).
2.3. Synthesis of TM-TPB and the Fabrication of the ASS-PME
To prepare the ion-pair to be used in the membrane formulation, two separate solutions of TM-HCl and sodium tetraphenyl borate (NaTPB) were prepared and mixed with each other. An alternative salt that can be used instead of NaTPB is potassium tetrakis (p-chlorophenyl) borate (KpClTPB). Such salts are suitable for the preparation of the ion pair due to the hydrophobic large anions existing in their structure. It is noteworthy that due to the same structural reason such salts are also used as a precipitating agents in inorganic or organometallic chemistry.
mixture was mixed with the product of dissolving 40mg of TM.HCl in 15 mL of distilled water and the resulting precipitate was filtered, repeatedly washed with distilled water, dried at room temperature, and properly stored for further use.
To prepare the ASS-PME the two elements (i.e. the solid contact and the PME) were separately prepared. Initially a conductive polymeric composite (CPC) composed of graphite powder, MWCNTs, an epoxy and a hardener were mixed in various amounts. Experimental results proved that a CPC containing 33% w/w of Macroplast Su 2227 (the epoxy resin), 12% w/w of Desmodur RFE (the hardener), 5% w/w of MWCNT and 50% w/w of graphite powder shows the best results. In general these components were add mixed in THF and then left to rest at ambient temperature for about 20-30 min. The oily mixture was next coated on a copper wire of 0.5 mm in diameter and 15 cm in length and left, by dipping the wire into the mixture for 10 times and then letting it dry for about 10 hours. Next the so-prepared ASS was polished and dipped in to the solution of the ingredients of the polymeric membrane to fabricate the ASS-PME.
The PVC membrane was prepared by mixing various amounts of TM-TPB, PVC, plasticizer and ([bmim]BF4 in tetrahydrofuran (THF) in a glass dish of 2 cm in diameter. The prepared mixtures
were next mildly heated to evaporate the THF content and form the oily mixture into which the ASS electrode was dipped as described earlier [30-36]. The ASS element was immersed into the polymeric membrane solution 3 times and then let to rest in air for 24 h. All of the prepared ASS -PMEs were finally conditioned in 10−3 M solutions of TM.HCl for reaching the equilibrium conditions required for analysis.
3. RESULTS AND DISCUSSION
3.1. Optimization of Polymeric Membrane Composition
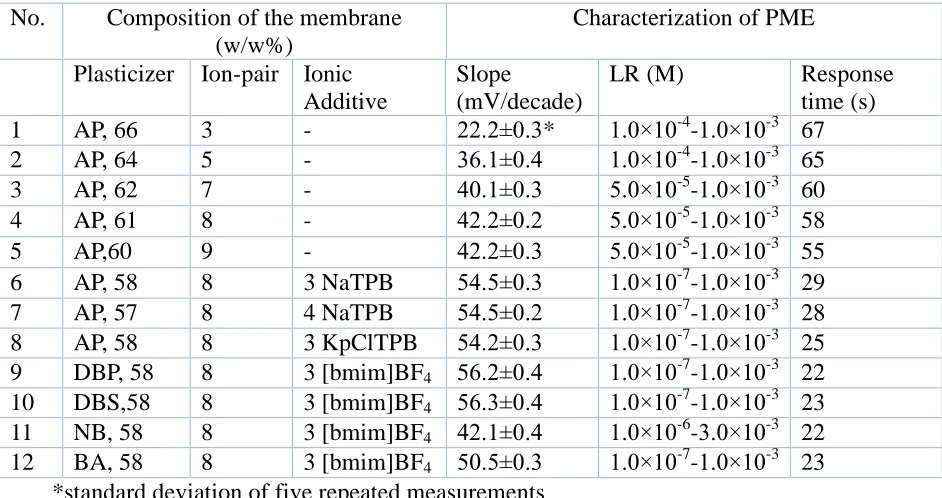
This can be regarded as the main step in the construction of any polymeric membrane senor, since the optimization of the nature and amount of the membrane ingredients forming the polymeric membrane gravely influences its function and selectivity [35-40]. The ingredients of a polymeric membrane include the sensing material (here, the TM-TPB ion-pair), the plasticizer, the polymeric matrix (here PVC) and the ionic additive (here, [bmim]BF4). Table 1 summarizes the different
compositions and results obtained in the case of each membrane composition.
The previous knowledge that the plasticizer/PVC ratios of 2 to 2.2 can lead to the optimal results helped simplify the optimization process [37-43] and for further simplification a fixed amount of 31%w/w of the polymeric matrix (i.e. PVC) was used in all compositions summarized in Table 1.
[image:5.596.63.534.148.397.2]
throughout the polymeric membrane [31-37].
Table 1. Compositions of the membranes used in preparation of CP sensor No. Composition of the membrane
(w/w%)
Characterization of PME Plasticizer Ion-pair Ionic
Additive
Slope
(mV/decade)
LR (M) Response
time (s)
1 AP, 66 3 - 22.2±0.3* 1.0×10-4-1.0×10⁻³ 67
2 AP, 64 5 - 36.1±0.4 1.0×10⁻⁴-1.0×10⁻³ 65
3 AP, 62 7 - 40.1±0.3 5.0×10⁻⁵-1.0×10⁻³ 60
4 AP, 61 8 - 42.2±0.2 5.0×10⁻⁵-1.0×10⁻³ 58
5 AP,60 9 - 42.2±0.3 5.0×10⁻⁵-1.0×10⁻³ 55
6 AP, 58 8 3 NaTPB 54.5±0.3 1.0×10⁻⁷-1.0×10⁻³ 29 7 AP, 57 8 4 NaTPB 54.5±0.2 1.0×10⁻⁷-1.0×10⁻³ 28 8 AP, 58 8 3 KpClTPB 54.2±0.3 1.0×10⁻⁷-1.0×10⁻³ 25 9 DBP, 58 8 3 [bmim]BF4 56.2±0.4 1.0×10⁻⁷-1.0×10⁻³ 22
10 DBS,58 8 3 [bmim]BF4 56.3±0.4 1.0×10⁻⁷-1.0×10⁻³ 23
11 NB, 58 8 3 [bmim]BF4 42.1±0.4 1.0×10⁻⁶-3.0×10⁻³ 22
12 BA, 58 8 3 [bmim]BF4 50.5±0.3 1.0×10⁻⁷-1.0×10⁻³ 23
*standard deviation of five repeated measurements
Among the different commonly used plasticizers like acetophenon (AP), dibutylsebacate (DBS), dibutylphthalate (DBP) nitrobenzene (NB) and benzylacetate (BA), all of which possess the aforementioned properties were tested. The major difference among these plasticizers is their various dielectric constants which increase from 4.5 for DBS, 5.7 for BA, and 6.4 in the case of DBP to 17.3 in the case of AP, and reach 35.7 for NB which is the most polar plasticizer tested in this work. The experimental results in Table 1, show that membrane no. 10, where DBS (DC:4.5) had the best performance, which is a bit less than to that observed in the case of DBP in terms of the Nernstian response. More and less polar plasticizers like AP and NB led to relatively poor membrane functions. This can be attributed to the hydrophobic nature of TM which is not easily extractable into very polar solvents like NB (with a response of 42.1±0.4 mV/decade) as compared to the less polar solvents among which AP showed the poorest response of 54.2±0.3 mV/decade, which although less than those of DBS and DBP is much better than that of NB. Among the less polar solvents, DBS showed slightly better responses in comparison to the next best DBP, which can be attributed to the optimal dielectric constant of this solvent.
additives (i.e. KpClTPB, and NaTPB) and was found to lead to better results as can be seen in Table 1 (no. 10). In conclusion and based on the results in Table 1, a membrane composition of 8% w/w of the ion-pair, 58% w/w of DBS, 31% w/w of PVC, and 3% w/w of [bmim]BF4 (no. 10), which showed the
best Nernstian slope of 56.3±0.4 mV per decade was chosen as the best composition and used for further evaluations.
3.2. Calibration curve
Solution with TM.HCl concentrations ranging from 1×10⁻⁸ to 1×10⁻² M were used for depicting the calibration curve of the developed ASS-PME. The Nernst equation (i.e. E vs. –log [TM]) was used as the basis for drawing the curve (Figure 2). The results showed that unlike most symmetric PME (with typical linearity ranges from 10-5 to 10-2 M[39-45]), and according to what was expected from the asymmetric instrument, the TM-ASS-PME has a linear response in the range of 1.0×10⁻⁷ to 1.0× 10⁻³ Mwith a slope of 56.3±0.4 mV per decade. The extrapolation of the linear section of the curve also revealed the lower detection limit (LDL) of the device to be as low as 6.0×10⁻⁸
M.
y = -56.367x + 472.5 R² = 0.997
30 80 130 180 230 280 330
1 2 3 4 5 6 7 8 9
E
(m
V)
-Log [TM]
TM-ASS-PME
Figure 2. The calibration curve of t h e T M - A S S - P M E from 1×10⁻⁸ to 1×10⁻² M. (The potential value for each point represents the average of four replicate readings.)
3.3. Response time and pH-Potential behavior
[image:6.596.163.427.369.584.2]
concentration difference in the range of 1.0×10⁻⁷ to 1.0×10⁻³ Mand recording the time required for reaching the equilibrium potential anticipated for the destination solution [43-48] and showed the average response time to be about 23 s.
50 70 90 110 130 150 170 190 210 230 250
0 1 2 3 4 5 6 7 8 9 10 11
E(
mV
)
pH
Figure 3. pH-potential behavior of the ASS-PME in a 1.0×10⁻⁵ M TM.HCl solution
The dependence of the response of a sensor on the pH of the test solution was also evaluated using 1.0×10⁻⁵ M TM.HCl solutions. During the experiments the pH of the test solutions was altered in the range of 1.0 to 10.0 through the addition of concentrated sodium hydroxide and hydrogen bromide. The high concentrations of the acid and base solutions helped avoid concentration changes due to the addition of the large volumes of a second solution to the test solution. Figure 3 clearly shows that the potential response of the devised ASS-PME is independent from pH in the range of 3.0 to 6.0. The changes at pH values above and below this range are attributed to the formation of neutral ion-pairs between the TM cations and OH- and decreased concentration of dissolved TM+ at higher pH, as well extraction of membrane components into the analyte solution at lower pH.
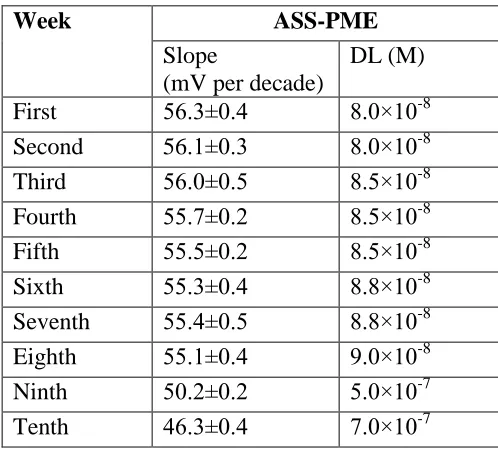
3.4. Life-time
The average time during which a potentiometric can be used without considerable changes in its potential response and linear range is defined as its life time. This parameter usually ranges between 4-10 weeks in the case of polymeric membrane electrodes [46-51]. To evaluate the life time of the devised sensor three electrodes were chosen and used for 1 hour/day during a period of 10 weeks. The results are summarized in Table 3. An overview on the results shows that after 8 weeks o f a p p l i c a t i o n , the slope of the calibration curves gradually decreases and the detection limits start to increase, and hence 8 weeks was considered as the lifetime of the sensors.
Table 3. Lifetime readings
Week ASS-PME
Slope
(mV per decade)
DL (M)
First 56.3±0.4 8.0×10⁻⁸
Second 56.1±0.3 8.0×10⁻⁸
Third 56.0±0.5 8.5×10⁻⁸
Fourth 55.7±0.2 8.5×10⁻⁸
Fifth 55.5±0.2 8.5×10⁻⁸
Sixth 55.3±0.4 8.8×10⁻⁸
Seventh 55.4±0.5 8.8×10⁻⁸
Eighth 55.1±0.4 9.0×10⁻⁸
Ninth 50.2±0.2 5.0×10⁻⁷
Tenth 46.3±0.4 7.0×10⁻⁷
3.5. Selectivity behavior of the ASS-MPEs
Given the importance of the selectivity, as the most prominent feature of an ion selective electrode, which can be defined as its tendency to respond to the presence of the target ion in the presence of other interfering species, this parameter was also evaluated and expressed in terms of selectivity coefficients.
Table 4. Selectivity coefficients obtained for CP sensors
Interfering species ASS-PME Log (KMPM)
Na+ -5.9
K+ -5.7
NH4+ -5.7
Ca2+ -5.9
Mg2+ -6.1
Cl- -6.2
NO3- -6.3
Lactose -6.0
Glucose -6.1
[image:8.596.192.404.496.677.2]
3.5. Evaluation of the analytical applicability
The ASS-PMEs were used in the analysis of TM in distilled water as well as the solution of pharmaceutical tablets, and the linear range, detection limit, selectivity, precision, accuracy, and ruggedness/robustness of the devices were evaluated for the purpose of validation.
The results of the analysis of TM concentration in 100 mg TM tablets through calibration curve is given in Table 5, which shows no significant in discrepancies among the results and the values declared on the labels, as well as the results of an HPLC standard method [52].
Table 5. Measurement of TM.HCl in pharmaceutical formulations by the proposed sensors and standard methods
Sample Labeled
amount (mg/tab.)
Found by the ASS-PME (mg/tab.) n=5*
Standard method n=5*
t-test
(p-value: 0.05; ttheoritical: 2.31)
Sample 1
(ALLAPIAN®-Amin, Iran)
100 107.12±0.51 106.71±0.21 texperimental= 1.66
Sample 2
(TEDAMOL®-Tehran Daru, Iran)
100 103.38±0.36 102.95±0.25 texperimental= 2.19
Sample 3
(TRAMADOL-PHARMA®, Pharma Chemistry, Iran)
100 97.13±0.40 96.75±0.22 texperimental= 1.86
* Averages of five repeated measurements
Evaluation of the repeatability of the results was also performed through repeatedly testing three standard synthetic samples and the RSD% of the results obtained was found to be 3.35%. Further the ruggedness of the test procedure based on the ASS-PME was evaluated through the comparison of the results of intra- and inter-day experiments by two analysts in the same laboratory and the RSD% was found to be up to 3.5%. Robustness was obtained while the important parameters (i.e. pH of the solution and the laboratory temperature) changed slightly. T M recovery% were good under most conditions, and show no significant change when the critical parameters were changed.
4. CONCLUSIONS
Concentration of tramadol was measured by a novel all solid state polymeric membrane electrode (ASS-PME). The PME used in the devices was composed of 8% w/w of TM-tetraphenyl borate, 58% w/w of dibutylsebacate, 31% w/w/ of poly(vinyl chloride), and 3% w/w/ of [bmim]BF4
and epoxy resin on a copper wire. The so-fabricated ASS-PME revealed a Nernstian slope of 56.3±0.4 mV/decade and possess a wide applicability range from 1.0×10⁻⁷ to 1.0×10⁻³ Mwith anLDL of 8.0× 10⁻⁸ M, a short response time of 23 s and its response was found to be independent from pH of the test solution on the range of 3.0 to 6.0. Evaluation were made on the validation of the method and it was found to be applicable the effective analysis of tramadol hydrochloride in pharmaceutical formulation.
ACKNOWLEDGEMENT
The financial support of this work by research council of University of Tehran is gratefully acknowledgments.
References
1. W. Leppert, Pharmacological reports 61 (2009) 978. 2. A. Küçüka, and Y. Kadıoğlu, Il Farmaco, 60 (2005) 163.
3. T. G. Halvorsen, S. Pedersen-Bjergaard, and K. E. Rasmussen, J. Chromatogr. A, 909 (2001) 87. 4. H. Juan, Z. Zhiling, and L. Huande, J. Chromatogr. B, 820 (2005) 33.
5. T. Belal, T. Awad, and C. R. Clark, J. Chromatogr. Sci., 47 (2009) 849. 6. J. J. B. Nevado, and A. M. C. Salcedo, Chromatographia, 553 (2002) 369.
7. R. Flores, J. J. B. Nevado, J. J. C. Salcedo, and M. P. C. Dias, J. Sep. Sci. 27 (2004) 33. 8. H. E. Abdellatef, J. Pharm. Biomed. Anal., 29 (2002) 835.
9. P. Norouzi, R. Dinarvand, M. R. Ganjali, A. S. E. Meibodi, Anal. Lett., 40 (2007) 2252.
10.M. R. Ganjali, T. Razavi, F. Faridbod, S. Riahi, and P. Norouzi, Curr. Pharm. Anal., 5 (2009) 28. 11.F. Faridbod, F. Mizani, M. R. Ganjali, and P. Norouzi, Int. J. Electrochem. Sci., 8 (2013) 10461. 12.M. R. Ganjali, B. Larijani, F. Faridbod and P. Norouzi, Int. J. Electrochem. Sci., 8 (2013) 10487. 13.F. Faridbod, M. R. Ganjali and P. Norouzi, Int. J. Electrochem. Sci., 8 (2013) 6107.
14.F. Faridbod, M. R. Ganjali, R. Dinarvand, S. Riahi, P. Norouzi, and M. B. A. Olia, J. Food. Drug Anal., 17 (2009) 264.
15.M. R. Ganjali, M. Qomi, A. Daftari, P. Norouzi, M. Salavati-Niasari, and M. Rabbani, Sens. Actuators B, 98 (2004) 92.
16.M. Shamsipur, S. Rouhani, H. Shaghi, M. R. Ganjali, and H. Eshghi, Anal. Chem., 71 (1999) 4938. 17.F. Faridbod, M. R. Ganjali, B. Larijani, P. Norouzi, S. Riahi, and F. S. Mirnaghi, Sensors, 7 (2007)
3119.
18.V. K. Gupta, A. K. Singh, and L. K. Kumawat, Electrochim. Acta, 95 (2013) 132.
19.A. K. Jain, V. K. Gupta, L. P. Singh, P. Srivastava, and J. R. Raisoni, Talanta, 65 (2005) 716. 20.H. A. Zamani, M. Nekoei, M. Mohammadhosseini, and M. R. Ganjali, Mater. Sci. Eng. C, 30
(2010) 480.
21.M. R. Ganjali, N. Motakef-Kazami, F. Faridbod, S. Khoee, and P. Norouzi, J. Hazard. Mater., 173 (2010) 415.
22.M. R. Ganjali, P. Norouzi, M. Adib, and A. Ahmadalinezhad, Anal. Lett., 39 (2006) 1075. 23.V. K. Gupta, A. K. Singh, M. Al Khayat, and B. Gupta, Anal. Chim. Acta, 590 (2007) 81.
24.M. R. Ganjali, P. Norouzi, A. Atrian, F. Faridbod, S. Meghdadi, and M. Giahi, Mater. Sci. Eng. C, 29 (2009) 205.
25.I. Isildak, Turk. J. Chem., 24 (2000) 389.
26.P. Kumar, D. Kim, M. H. Hyun, M. Won, and Y. Shim, Electroanalysis, 25 (2013) 1864. 27.I. Isildak, and A. Asan, Talanta, 48 (1999) 967.
28.B. Kemer, and M. Ozdemir, Turk. J. Chem., 32 (2008) 521.
Electrochem., 13 (2009) 123.
30.M. R. Ganjali, F. Faridbod, N. Davarkhah, S. J. Shahtaheri, and P. Norouzi, Int. J. Environ. Res., 9 (2015) 333.
31.F. Faridbod, N. Davarkhah, and S. Karamdoust, Int. J. Electrochem. Sci., 10 (2015) 8308.
32.M. R. Ganjali, I. Alahdadi, M. Aghazadeh, and E. Pourbasheer, Int. J. Electrochem. Sci., 10 (2015) 6913.
33.M. R. Ganjali, M. Rezapour, M. Pirali-Hamedani and H. Rashedi, Int. J. Electrochem. Sci., 10 (2015) 6924.
34.M. R. Ganjali, P. Norouzi, F. S. Mirnaghi, S. Riahi, and F. Faridbod, IEEE Sensors J., 7 (2007) 1138.
35.M. R. Ganjali, Z. Memari, F. Faridbod, and P. Norouzi, Int. J. Electrochem. Sci., 3 (2008) 1169. 36.M. R. Ganjali, A. Daftari, P. Nourozi, and M. Salavati-Niasari, Anal. Lett., 36 (2003) 1511.
37.H. A. Zamani, G. Rajabzadeh, M. R. Ganjali, and S. M. Khatami, Electroanalysis, 17 (2005) 2260. 38.M. R. Ganjali, M. Rezapour, M. R. Pourjavid, and S. Haghgoo, Anal. Sci., 20 (2004) 1007.
39.M. Shamsipur, M. Yousefi, M. Hosseini, and M. R. Ganjali, Anal. Lett., 34 (2001) 2249.
40.M. R. Ganjali, H. A. Zamani, P. Norouzi, M. Adib, and M. Accedy, Acta Chim. Slov., 52 (2005) 309.
41.H. A. Zamani, M. Rohani, A. Zangeneh-Asadabadi, M. S. Zabihi, M. R. Ganjali, and M. Salavati-Niasari, Mat. Sci. Eng. C, 30 (2010) 917.
42.M. R. Ganjali, H. A. Zamani, P. Norouzi, M. Adib, M. Rezapour, and M. Aceedy, Bull. Korean Chem. Soc., 26 (2005) 579.
43.H. A. Zamani, M. R. Ganjali, and M. Adib, Sensor Lett., 6 (2006) 345. 44.H. A. Zamani, G. Rajabzadeh, and M. R. Ganjali, Sensor Lett., 7 (2009) 114.
45.M. Javanbakht, M. R. Ganjali, P. Norouzi, A. R. Badiei, A. Hasheminasab, and M. Abdouss, Electroanalysis, 19 (2007) 1307.
46.S. K. Srivastava, V. K. Gupta, and S. Jain, Electroanalysis, 8 (1996) 938.
47.V. K. Gupta, A. K. Jain, Shiva Agarwal, and G. Maheshwari, Talanta, 71 (2007) 1964. 48.A. K. Singh, V. K. Gupta, and B. Gupta, Anal. Chim. Acta, 1 (2007) 171.
49.H. A. Zamani, M. R. Ganjali, P. Norouzi, and S. Meghdadi, Anal. Lett., 41 (2008) 902. 50.H. A. Zamani, M. R. Ganjali, P. Norouzi, and M. Adib, Sensor Lett., 5 (2007) 522. 51.H. A. Zamani, J. Abedini-Torghabeh, and M. R. Ganjali, Electroanalysis, 18 (2006) 888. 52.S. H. Gan and R. Ismail, J. Chromatogr. B, 759 (2001) 325.