NAR
THE TA
DEPA
RATRIPT
AMILNAD
In paM
PHA
ARTMEN
K. M
ME
TAN HY
Di
SDU Dr. M
CH
artial fulfillmenMASTER
ARMACEU
NT OF PHA
M. COLLE
ELUR RO
MADU
AP
DROCH
issertation
Submitted toM. G. R. ME
HENNAI
nt for the awardOF PHAR
IN
UTICAL
ARMACE
EGE OF PH
OAD, UTH
URAI – 62
PRIL-2012
HLORIDE
n
EDICAL U
CERTIFICATE
This is to certify that the dissertation entitled “DEVELOPMENT AND VALIDATION OF RP-HPLC METHOD FOR QUANTITATIVE
ANALYSIS OF NARATRIPTAN HYDROCHLORIDE TABLET” submitted by
Mr. P. MALLIKHARJUNA RAO (Reg. No.26101725) in partial fulfillment of
the degree of Master of Pharmacy in Pharmaceutical Analysis, at K. M.
COLLEGE OF PHARMACY, MADURAI-625107 under The Tamilnadu Dr.
M. G. R. Medical University, Chennai.
It is a bonafied work carried out by him under my guidance and supervision during the academic year 2011 - 2012. This dissertation partially or fully has not been submitted for any other degree or diploma of this university or any other universities.
GUIDE
Mr. M. S. PRAKASH., M. Pharm.,
Professor,
Dept. of Pharmaceutical Analysis, K. M. College of Pharmacy, Uthangudi,
Madurai- 625107.
HOD
Dr.S. MEENA., M. Pharm., Ph. D.,
Professor and Head, Dept. of Pharmaceutical Analysis,
K. M. College of Pharmacy, Uthangudi, Madurai- 625107. PRINCIPAL
Dr. S. JAYAPRAKASH.,M. Pharm., Ph. D.,
Professor and Head, Dept. of Pharmaceutics, K. M. College of Pharmacy, Uthangudi,
PHARMACEUTICAL ANALYSIS, K. M. C. P. Page 1
GENERAL INTRODUCTION
Introduction: Analytical chemistry
Analytical chemistry [1] is the science to analyze morphologies, compositions and
quantities of analytical targets. These analytical results have played critical roles from the understanding of basic science to a variety of practical applications, such as biomedical applications, environmental monitoring, quality control of industrial manufacturing and forensic science.
Modern analytical chemistry is dominated by instrumental analysis. There are so many different types of instruments today that it can seem like a confusing array of acronyms rather than a unified field of study. Analytical chemistry plays an increasingly important role in the pharmaceutical industry where, aside from QA, it is used in discovery of new drug candidates and in clinical applications where understanding the interactions between the drug and the patient are critical.
¾ Types
Traditionally, analytical chemistry has been split into two main types, qualitative and quantitative.
• Qualitative
Qualitative inorganic analysis seeks to establish the presence of a given element or inorganic compound in a sample or the functional group present in a organic compound
• Quantitative
Quantitative analysis seeks to establish the amount of a given element or compound in a sample.
PHARMACEUTICAL ANALYSIS, K. M. C. P. Page 2
Classification of analytical methods [2]:
Generally analytical methods are classified into:
(a) Chemical analysis
(b) Instrumental methods
(a) Chemical analysis:
These methods depend upon quantitative performance of a suitable chemical reaction and either measuring the amount of reagents needed to complete the reaction or ascertaining the amount of reaction product obtained e.g. titrimetric (acid base titration, oxidation- reduction titration , non-aqueous titration, complex formation), gravimetric and volumetric methods.
(b) Instrumental methods:
These methods are based up on the measurement of physical properties of a substance such as electrical, optical and absorption and to correlate them for determination of concentration of analyte. These properties are being explained for development of analytical methods such as spectrophotometry, HPLC, GLC and polarography etc. Now a days instrumental method of analysis are widely accepted over the classical methods. These methods are extremely sensitive providing precise and detailed information from small sample materials.
Depending upon the nature and type of material either single or in combination, an appropriate method of analysis is adopted. Instrumental methods are usually much faster than chemical methods and are applicable at concentration far too small to be amenable to determination by chemical methods and find wide application in industry.
Advantages of instrumental methods:
¾ Small sample can be used.
¾ High sensitivity is obtained.
¾ Measurements obtained are reliable.
PHARMACEUTICAL ANALYSIS, K. M. C. P. Page 3
¾ Even complex sample can be handled easily.
CHROMATOGRAPHY [3]
Introduction:
Chromatography (from Greek: khromatos- colour and graphos- write) is the
collective term for a family of laboratory techniques for the separation of mixtures. It involves passing a mixture dissolved in a "mobile phase" through a stationary phase, which separates the analyte to be measured from other molecules in the mixture and allows it to be isolated.
Chromatography may be preparative or analytical. Preparative chromatography is helpful to separate the components of a mixture for further use. Analytical chromatography normally uses smaller amounts of material and seeks to measure the relative proportions of analytes in a mixture.
Chromatography techniques [4]:
Recently, the IUPAC has defined chromatography as;
“A method used primarily for the separation of the components of a sample, in which the components are distributed between two phases, one of which is stationary while other moves. The stationary phase may be a solid or a liquid supported on a solid or a gel and may be packed in a column, spread as a layer or distributed as a film. The mobile phase may be gaseous or liquid.
Classification of chromatography techniques:
1) According to the nature of stationary and mobile phase
PHARMACEUTICAL ANALYSIS, K. M. C. P. Page 4
2) According to mechanisms of separation, chromatographic methods are divided in to
following general area
• Adsorption chromatography • Partition chromatography • Size exclusion chromatography • Ion exchange chromatography
In adsorption chromatography, the analytes interact with solid stationary surface and
are displaced with the eluent for active sites on surface.
Partition chromatography, results from a thermodynamic distribution between two
liquid (or liquid like) phase. On the basis of relative polarities of stationary and mobile phase. Partition chromatography can be divided in to normal phase and reverse-phase
chromatography.
In normal phase chromatography, the stationary bed is strongly polar in nature (e.g.,
silica gel) and the mobile phase is non polar (such as n-hexane or tetrahydrofuran)
Polar samples are thus retained on the polar surface of the column packing longer than less polar materials while in reversed-phase chromatography, the stationary bed is non
polar (hydrophobic) in nature, while the mobile phase is polar liquid, such as mixtures of water and methanol or acetonitrile. Here the more non polar the materials is, the longer it will be retained.
Size exclusion chromatography involves a solid stationary phase with controlled pore
size. Solutes are separated according to molecular size, with the large molecules unable to enter the pores elute first.
Ion–exchange chromatography, involves a solid stationary phase with anionic or
cationic groups on the surface to which solute molecules of opposite charges are attracted.
PHARMACEUTICAL ANALYSIS, K. M. C. P. Page 5
High performance liquid chromatography (HPLC) [5]:
The typical HPLC separation is based on the selective distribution of analytes between a liquid mobile phase and an immiscible stationary phase. The sample is first introduced by means of an injection port in to the mobile phase stream that is delivered by a high pressure pump. Next, the components of this sample mixture are separated on the column, a process monitored with a flow through detector as the isolated components emerge from the column.
The HPLC is classified in to two modes depending on the relative polarity of the two phases, normal and reverse-phase chromatography. These are two elution types in HPLC
they are isocratic and gradient. In isocratic elution, composition of solvents is pumped
through the column during complete analysis is unchanged. In gradient system, eluent
composition and strength is steadily changed during the run.
INSTRUMENTATION [6]
PHARMACEUTICAL ANALYSIS, K. M. C. P. Page 6
The individual components HPLC and their working functions are described below.
SOLVENT DELIVERY SYSTEM
The mobile phase is pumped under pressure from one or several reservoirs and flows through the column at a constant rate. With micro particulate packing, there is a high-pressure drop across a chromatography column. Eluting power of the mobile phase is determined by its overall polarity, the polarity of the stationary phase and the nature of the sample components. For normal phase separations, eluting power increases with increasing polarity of the solvent but for reversed phase separations, eluting power decreases with increasing solvent polarity. Optimum separating conditions can be achieved by making use of mixture of two solvents. Some other properties of the solvents, which need to be considered for a successful separation, are boiling point, viscosity, detector compatibility, flammability and toxicity.
The most important component of HPLC in solvent delivery system is the pump, because its performance directly effects the retention time, reproducibility and detector sensitivity. Among the several solvent delivery systems, (direct gas pressure, pneumatic intensifier, reciprocating etc.) reciprocating pump with twin or triple pistons is widely used, as this system gives less baseline noise, good flow rate reproducibility etc.
MOBILE PHASE
Mobile phase used for HPLC typically are mixtures of organic solvents and water or aqueous buffers. Table given below lists the physical properties of organic solvents commonly used for HPLC. Isocratic methods are preferable to gradient methods. Gradient methods will sometimes be required when the molecules being separated have vastly different partitioning properties. When a gradient elution method is used, care must be taken to ensure that all solvents are miscible.
The following points should also be considered when choosing a mobile phase:
1. It is essential to establish that the drug is stable in the mobile phase for at least the duration of the analysis.
PHARMACEUTICAL ANALYSIS, K. M. C. P. Page 7
3. The mobile phase should have a pH between 2.5 and pH 7.0 to maximize the lifetime of the column.
4. The cost and toxicity of the mobile phase can be reduced by using methanol instead of acetonitrile.
5. Chemicals such a trifluoroacetic acid, acetic acid or formic acid should be minimized and which may prevent detection of products without chromophores at 220 nm. Carboxylic acid modifiers can be frequently replaced by phosphoric acid, which does not absorb above 200 nm.
6. Volatile mobile phases are presented to facilitate collection of products and in LC-MS analysis. Volatile mobile phases include ammonium acetate, ammonium phosphate, formic acid, acetic acid and trifluoroacetic acid.
Ionizable compounds in some cases can present some problems when analyzed by reverse phase chromatography. Two modifications of the mobile phase can be useful in reverse phase HPLC for ionizable compounds. One is called ion suppression and other is ion pairing chromatography. In both techniques, a buffer is used to ensure that the pH of the solution is constant and usually at least 1.5 pH units from a pKa of the drug to ensure that one form of the drug predominates. In ion suppression chromatography, the pH of the aqueous portion of the mobile phase is adjusted to allow the neutral form of the drug to predominate. This ensures that the drug is persistent in only one form and results in improvement of the peak shape and consistency of retention times. In ion pairing chromatography, the pH of the mobile phase is adjusted so that the drug is completely ionized. If necessary to improve peak shape or lengthen retention time, an alkyl sulfonic acid salt or bulky anion such as trifluoroacetic acid is added to the ion pair to cationic drugs or a quaternary alkyl ammonium salt is added to ion-pair to anionic drugs. Ion pairing chromatography also allows the simultaneous analysis of both neutral and charged compounds
SOLVENT DEGASSING SYSTEM
PHARMACEUTICAL ANALYSIS, K. M. C. P. Page 8
include heating and stirring, vacuum degassing with an aspirator, filtration through 0.45 µ filter, vacuum degassing, helium purging, ultra sonification or purging or combination of these methods. HPLC systems are also provided an online degassing system, which continuously removes the dissolved gases from the mobile phase.
GRADIENT ELUTION DEVICES
HPLC columns may be run isocratically, i.e., with constant eluent or they may be run in the gradient elution mode in which the mobile phase composition varies during run. Gradient elution over comes the problem of dealing with a complex mixture of solutes.
COLUMNS
The heart of the system is the column. The choice of common packing material and mobile phases depends on the physical properties of the drug. Many different reverse phase columns will provide excellent specificity for any particular separation. It is therefore best to routinely attempt separations with a standard C8 or C18 column and determine if it provides good separations. If this column does not provide good separation or the mobile phase is unsatisfactory, alternate methods or columns should be explored. Reverse phase columns differ by the carbon chain length, degree of end capping and percent carbon loading. Diol, cyano and amino groups can also be used for reverse phase chromatography.
SAMPLE INTRODUCTION SYSTEM
Two means for analyte introduction on the column are injection into a flowing stream and a stop flow injection. These techniques can be used with a syringe or an injection valve. Automatic injector is a microprocessor-controlled version of the manual universal injector. Usually, up to 100 samples can be loaded in to the auto injector tray. The system parameters such as flow rates, gradient, run time, volume to be injected, etc. are chosen, stored in memory and sequentially executed on consecutive injections.
LIQUID CHROMATOGRAPHIC DETECTORS
PHARMACEUTICAL ANALYSIS, K. M. C. P. Page 9
a. Bulk property detectors: These detectors are based on differential measurement of a
property, which is common to both the sample and the mobile phase. Examples of such detectors are refractive index, conductivity and dielectric constant detectors.
b. Solute property detectors: Solute property detectors respond to a physical property of the
solute, which is not exhibited by the pure mobile phase. These detectors measure a property, which is specific to the sample, either with or without the removal of the mobile phase before the detection. Solute property detectors which do not require the removal of the mobile phase before detection include spectrophotometric (UV or UV-Visible) detector, fluorescence detectors, polarographic, electro-chemical and radio activity detectors, where as flame ionization detector and electron capture detector both require removal of the mobile phase before detection.
UV-Visible and fluorescent detectors are suitable for gradient elution, because many solvents used in HPLC do not absorb to any significant extent.
TEMPERATURE
Room temperature is the first choice. Elevated temperatures are sometimes used to reduce column pressure or enhance selectivity. Typically, temperatures in excess of 600C are not used.
RETENTION TIME
Due to a number of samples assayed in the course of preformulation study, it is advisable to have as short a retention time as possible. However, the retention time should be sufficiently long enough to ensure selectivity. When choosing the optimum mobile phase, considerations should be given to the retention time of degradation products, so that these compounds do not elute in the solvent front or remain in the column.
HPLC METHOD DEVELOPMENT [7]
PHARMACEUTICAL ANALYSIS, K. M. C. P. Page 10
mobile phase) is selected to obtain the first “scouting” chromatograms of the sample. In most cases, these are based on reversed-phase separations on a C18 column with UV detection.
The important factors, which are to be taken into account to obtain reliable quantitative analysis, are
1. Careful sampling and sample preparation.
2. Appropriate choice of the column.
3. Choice of the operating conditions to obtain the adequate resolution of the mixture.
4. Reliable performance of the recording and data handling systems.
5. Suitable integration/peak height measurement technique.
6. The mode of calculation best suited for the purpose.
7. Validation of the developed method.
SAMPLE PREPARATION
Samples comes in various forms
• Solutions ready for injection
• Solutions that require dilution, buffering, addition of an internal standard or other volumetric manipulation
• Solids must be dissolved or extracted
• Samples that require pretreatment to remove interferences and/or protect the column or equipment from damage.
Most samples for HPLC analysis require weighing and /or volumetric dilution before injection. Best results are often obtained when the composition of the sample solvent is close to that of the mobile phase since this minimizes baseline upset and other problems.
Some samples require a partial separation (pre-treatment) prior to HPLC, because of the need to remove interferences, concentrate sample analytes or eliminate “column killers”.
PHARMACEUTICAL ANALYSIS, K. M. C. P. Page 11
The regular samples are typical mixtures of small molecules (<2000Da) that can be separated by normal starting conditions.
CHOICE OF THE COLUMN [8]
Selection of the column is the first and the most important step in method development. The appropriate choice of separation column indicates three different approaches.
¾ Selection of separation.
¾ The particle size and nature of the column packing.
¾ The physical parameters of the column i.e. the length and the diameter.
Some of the important parameters considered while selecting chromatographic columns are
¾ Length and diameter of the column
¾ Packing material
¾ Shape of the particles
¾ Size of the particles
¾ % of Carbon loading
¾ Pore volume
¾ Surface area
¾ End capping
In this case, the column selected had a particle size of 5 µm and an internal diameter of 4.6 mm. The column is selected depending on the nature of the solute and the information about the analyte. Reversed phase mode of chromatography facilities a wide range of columns covering wide range of polarities by cross linking silanol groups with alkyl chains like like dimethyl silane (C2), butylsilane (C4), octylsilane(C8), octadecylsilane (C18),base deactivated silane (C18), phenyl, cyanoproply (CN), nitro, amino etc. Silica based columns with different cross linkings in the increasing order of Polarity are as follows:
PHARMACEUTICAL ANALYSIS, K. M. C. P. Page 12
C18 < C8 < C6 < Phenyl < Amino < Cyano<nitrile < Silica
C18 was choosen for this study since it is most retentive one. The sample manipulation becomes easier with this type of column.
Generally longer column as provide better separation due to higher theoretical plate numbers. As the particle size decreases the surface area available for coating increases. Columns with 5 µm particle size give the best compromise of efficiency, reproducibility and reliability. In this case, the column selected had a particle size of 5 µm and an internal diameter of 4.6 mm peak shape is equally important in method development. Columns that provide symmetrical peaks are always preferred while peaks with poor asymmetry can result in,
• In accurate plate number and resolution measurement • Imprecise quantitation
• Degraded and undetected minor bands in the peak tail • Poor retention reproducibility
A useful and practical measurement of peak shape is peak asymmetry factor and peak tailing factor. Peak asymmetry is measured at 10 % of full peak height and peak tailing factor at 5 %. Reproducibility of retention times and capacity factor is important for developing a rugged and repeatable method.
A column which gives separation of all the impurities and degradants from each other and from analyte peak and which is rugged for variation in mobile phase shall be selected.
SELECTION OF COLUMN TEMPERATURE
Chromatographic separations are carried out at ambient temperature. The increase in column temperature generally will result in reduction of asymmetry and peak retention. The column temperature between 30°c – 80°c is shall be adopted if necessary. If a column temperature above 80°c is required, packing material which can with stand to that temperature was preferable.
SELECTION OF SOLVENT DELIVERY SYSTEM
Chromatographic separation with isocratic elution is always preferable. However, gradient elution is powerful tool in achieving separation between closely eluting compounds or compounds with highly differing polarities.
PHARMACEUTICAL ANALYSIS, K. M. C. P. Page 13
two different ways, low pressure and high pressure gradient systems. Low pressure gradient can be adopted when not more than 80% of organic phase is to be pumped or vice-versa. While optimizing gradient elution especially low viscous solvents like acetonitrile and phosphate buffer, it is recommended to mix about 10% aqueous portion preferably the same buffer used in mobile phase to avoid pumping problems.
The gradient programme which is rugged for organic phase up to 10% variation and up to 0.2 ml variation in flow rate was selected.
SELECTION OF MOBILE PHASE
The primary objective in selection and optimization of mobile phase is to achieve optimum separation of all impurities and degradants from each other and from analyte peak.
In liquid chromatography, the solute retention is governed by the solute distribution factor, which reflects the different interactions of the solute-stationary phase, solute-mobile phase, and mobile phase-stationary phase. For a given stationary phase, the nature and the composition of which has to be judiciously selected in order to get appropriate and required solute retention. The mobile phase has to be adapted in terms of elution strength (solute retention) and solvent selectivity (solute separation). Solvent polarity is the key word in chromatographic separations since a polar mobile phase will give rise to low solute retention in normal phase and high solute retention in reverse phase LC. The selectivity will be particularly altered if the buffer pH is close to the pKa of the analytes. The following are the parameters, which shall be taken into consideration while selecting and optimizing the mobile phase.
• Buffer and its strength
• pH of the buffer or pH of the mobile phase
• Mobile phase composition
pH of the buffer:
PHARMACEUTICAL ANALYSIS, K. M. C. P. Page 14
It is important to maintain the pH of the mobile phase in the range of 2.0 to 8.0 as most columns does not withstand to the pH which are outside this range. This is due to the fact that the siloxane linkage area cleaved below pH 2.0 while pH valued above 8.0 silica may dissolve.
D. MOBILE PHASE COMPOSITION
Most chromatographic separations can be achieved by choosing the optimum mobile phase composition. This is due to the fact that fairly large amount of selectivity can be achieved by choosing the qualitative and quantitative composition of aqueous and organic portions. Most widely used solvents in reverse phase chromatography are methanol and acetonitrile. Experiments should be conducted with mobile phases having buffers with different pH and different organic phases to check for the best separations of analyte peak. A mobile phase which gives separation of analyte peak and which is rugged for variation of both aqueous and organic phase by at least ± 0.2% of the selected mobile phase composition is used.
SELECTION OF FLOW RATE
Generally flow rate shall not be more than 2.0 ml/min. the flow rate shall be selected based on the following data.
• Retention time
• Column back pressure
• Resolution between the peaks
• Peak symmetries
The flow rate which gives least retention times, good peak symmetries, least back pressures and better separation will be selected.
SELECTION OF DETECTOR
The detector was chosen depending upon some characteristic property of the analyte like UV absorbance, florescence, conductance, oxidation, reduction etc. The characteristics that are to be fulfilled by a detector to be used in HPLC determination are,
PHARMACEUTICAL ANALYSIS, K. M. C. P. Page 15
• Negligible baseline noise to facilitate lower detection • Large linear dynamic range
• Low dead volume
• Ease in calibration and standardization • Inexpensive to purchase and operate
Pharmaceutical ingredients do not absorb UV light equally, so that selection of detection wavelength is important. An understanding of the UV light absorptive properties of the organic impurities and the active pharmaceutical ingredient is very helpful. Generally LC equipped with PDA detector was the first choice. UV source like mercury vapour lamp is most widely used because majority of the compounds of pharmaceutical interest absorb at 250 – 270 nm and this lamp has an intense line spectrum at this region.
For the greatest sensitivity λmax should be used. Ultra violet wavelengths below 200nm should be avoided because detector noise increases in this region. Higher wavelengths give greater selectivity.
OPTIMIZATION OF HPLC METHOD
During the optimization stage, the initial sets of conditions that have evolved from the first stages of development are improved or maximized in terms of resolution and peak shape, plate counts, asymmetry, capacity factor, elution time, detection limits, limit of quantitation and overall ability to quantify the specific analyte of interest.
Optimization of a method can follow either of two general approaches:
• Manual
• Computer driven
The manual approach involves varying one experimental variable at a time, while holding all other constant and recording changes in response. The variables might include flow rate, mobile or stationary phase composition, temperature, detection wavelength and PH. This univariate approach to system is slow, time consuming and potentially expensive. However, it may provide a much better understanding of the principles and theory involved and of interactions of the variables.
PHARMACEUTICAL ANALYSIS, K. M. C. P. Page 16
can be applied to many applications. In addition, they are capable of significantly reducing the time, energy and cost of all instrumental method development.
PERFORMANCE CALCULATIONS:
Carrying out system suitability experiment does the performance calculations. System suitability experiments can be defined as tests to ensure that the method can generate results of acceptable accuracy and precision. The requirements for system suitability are usually developed after method development and validations have been completed.
The criteria selected will be based on the actual performance of the method as determined during its validation. For example, if sample retention times form part of the system suitability criteria, their variation SD can be determined during validation.
System suitability might then require that retention times fall within a ±3 SD range during routine performance of the method.
The RSD of peak height or area of five injections of a standard solution is normally accepted as one of the standard criteria. For assay method of a major component, the RSD should typically be less than 1% for these five respective injections.
The plate number and/ or tailing factor are used if the run contains only one peak. For chromatographic separations with more than one peak, such as an internal standard assay or an impurity method expected to contain many peaks, some measure of separations such as RS is recommended. Reproducibility of tR or k value for a specific compound also defines system performance.
A. COLUMN EFFICIENCY& PLATE NUMBER
The number of theoretical plates or plate number is a measure of column efficiency.
An efficient column produces sharp peaks and can separate many sample components in a relatively short time. Theoretical plates (N) are defined as the square of the ratio of the retention time divided by the standard deviation of the peak (σ).
PHARMACEUTICAL ANALYSIS, K. M. C. P. Page 17
Another way to express efficiency of column is by calculating height equivalents of theoretical plates (HETP).
h = L/n
Where h = HETP; L = Length of the column; n = number of theoretical plates.
Lower the HETP, higher is the efficiency of the column, i.e., higher the theoretical plates more efficient the column.
B. RESOLUTION
The goal of most HPLC analyses is the separation of one or more analytes in the sample from all other components present. Resolution (Rs) is a measure of the degree of separation of two adjacent analytes. Rs is defined as the difference in retention times of the two peaks divided by the average peak width. The resolution of two adjacent peaks can be calculated by using the formula
Where t1 and t2 are retention times of the adjacent peaks and
W0.5,1 and W0.5,2 are the width of the peaks at half height.
RS = 2.0 or greater is a desirable target for method development.
¾ The retention factor k is given by the equation
k= (tR – t0 ) / t0
Where tR is the band retention time and t0 is the column dead time.
¾ The peak symmetry can be represented in terms of peak asymmetry factor and peak tailing factor which can be calculated by using the following formulae
PHARMACEUTICAL ANALYSIS, K. M. C. P. Page 18
Where ‘B’ is the distance at 50% peak height between leading edge to the perpendicular drawn from the peak maxima and ‘A’ is the width of the peak at half the peak height.
According to USP (2000) Peak-tailing factor can be calculated by using the formula
T = W0.05/2 f
Where W0.05 is the width of the peak at 5% height and f is the distance from the peak maximum to the leading edge of the peak, the distance being measured at a point 50% of the peak height from the base line.
ANALYTICAL METHOD VALIDATION [9, 10,11]
Method validation can be defined as per ICH “Establishing documented evidence,
which provides a high degree of assurance that a specific activity will consistently produce a desired result or product meeting its predetermined specifications and quality characteristics”.
Method validation is an integral part of the method development; it is the process by which a method is tested by the developer or user for reliability, accuracy and precision of its intended purpose and demonstrating that analytical procedures are suitable for their intended use that they support the identity, quality, purity, and potency of the drug substances and drug products. Data thus generated become part of the method validation package submitted to Center for Drug Evaluation and Research (CDER). Simply, method validation is the process of proving that an analytical method is acceptable for its intended purpose.
Data that are generated for acceptance, release, stability or pharmacokinetic will only be trustworthy if the methods used to generate the data are reliable. The process of validation and method design also should be clearly in the development cycle before important data are generated. Validation should be on going in the form of re-validation with method changes.
PHARMACEUTICAL ANALYSIS, K. M. C. P. Page 19
All the variables of the method should be considered, including sampling procedure, sample preparation, chromatographic separation, and detection and data evaluation. For chromatographic methods used in analytical applications there is more consistency in validation practice. The Q (2) R1 of ICH guidelines for validation for analytical procedures includes the following parameters.
Method validation:
This process consists of establishments of the performance characteristics and the limitation of the method.
Method performance parameters are determined using equipment that is
1. Within specification 2. Working correctly 3. Adequately calibrated
Method validation is required when:
• A new method is being developed. • Revision of the established method.
• When established method are used in different laboratories and by different analysts etc.
• Comparison of methods.
• When quality control indicates method changes.
Performance characteristics examined when carrying out method validation are:
1. Accuracy/precision
2. Repeatability/Reproducibility 3. Linearity /Range
4. Limit of detection (LOD)/Limit of quantification 5. Selectivity/Specificity
PHARMACEUTICAL ANALYSIS, K. M. C. P. Page 20
A) Accuracy:
The accuracy of an analytical procedure express the closeness of agreement between
the value, which is accepted either as a conventional true value or an accepted reference value and the value found.
Determination of accuracy:
The accuracy may be determined by application of analytical method to an analyte of
known purity (example: reference standard) and also by comparing the results of the method with those obtained using an alternate procedure that has been already validated.
Accuracy is calculated as the percentage of recovery by the assay of the known added amount of the analyte in the sample or the difference between the mean and accepted true value together with confidence intervals.
The ICH guidelines recommended to take minimum of 3 concentration levels covering the specified range and 3 replicate of each concentration are analysed (totally 3×3=9 determination).
B) Precision:
The precision of an analytical procedure express the closeness of agreement between a series of measurements obtained from multiple sampling of the same homogenous sample under the prescribed conditions. Precision of analytical procedure is usually expressed the variance, standard deviation or co-efficient of variation of a series of measurements.
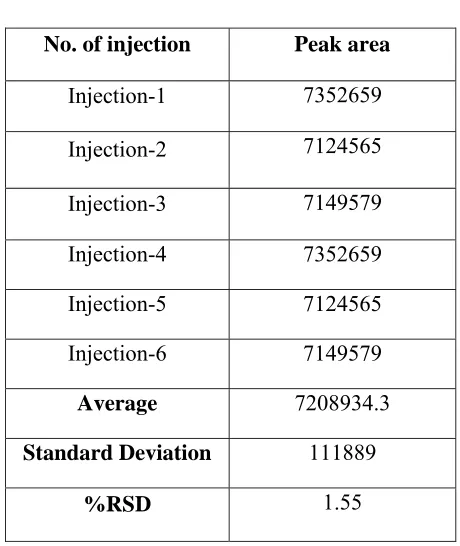
System precision:
A system precision was evaluated by measuring the peak response of naratriptan for six replicate injection of the standard solution prepared as per the proposed method.
Method precision:
The method precision was determined by preparing the sample of a single batch of
PHARMACEUTICAL ANALYSIS, K. M. C. P. Page 21
Determination of precision:
The procedure is applied repeatedly to separate identical sample drawn from the
homogeneous batch of material and measured by the scatter of individual results from the mean and expressed as the standard deviation or as the co-efficient of variation (relative standard deviation).
C) Specificity:
ICH document divides specificity in to two categories.
• Identification tests • Assay / impurity tests
Specificity is the ability to assess unequivocally the analyte in the presence of components, which may be expected to be present. Typically these might include impurities, degradeants, matrix, etc. lack of specificity of an individual analytical procedure may be compensated by other supporting analytical procedures.
Identification test:
It is demonstrated by the ability to discriminate between compounds of closely related
structures or by comparison to known reference materials. Use of positive and negative control is recommended.
Assay impurity test:
It is demonstrated by resolution of the two closest eluting compounds. If impurities are
available it has to be shown that the assay is unaffected by the presence of spiked material.If impurities are not available the test results are compared to a second well characterized method.
Determination of specificity:
When chromatographic procedures are used representative chromatograms should be
PHARMACEUTICAL ANALYSIS, K. M. C. P. Page 22
D) Selectivity:
It is a procedure to detect qualitatively the analyte in the presence of compounds that may be expected to be present in the sample matrix or the ability of a separative method to resolve different compounds. It is the measure of the relative method location or two peaks.
Determination of selectivity:
Selectivity is determined by comparing the test results obtained on the analyte with and without addition of potentially interfering material. When such components are either unidentified or un available a measure of selectivity can be obtained by determining the recovery of a standard addition of pure analyte to a material containing a constant level of the other compounds.
E) Sensitivity:
Sensitivity is the capacity of the test procedure to record small variation in
concentration. It is the slope of the calibration curve.
F) Limit of detection:
The limit of detections is the lowest concentration of the analyte in a sample that can be
detected but not necessarily determined in quantitatively using a specific method under the required experiment conditions such a limit is expressed in terms of a concentration of analyte (example: µg/ml in the sample)
Measurement based on
• Signal to noise ratio
• Visual evaluation (relevent chromatogram acceptable) • The standard deviation of the response and the slope.
LOD= .
Where
σ = The standard deviation of the response
PHARMACEUTICAL ANALYSIS, K. M. C. P. Page 23
G) Limit of quantification:
The LOQ is the lowest concentration of analyte in a sample, which can quantitatively
determined that might be measured with an acceptable level of accuracy and precision under the stated operational conditions of the method. LOQ can very with the type of method employed and nature of the sample. Based on the standard deviation of the response and the quantitation limit may expressed as
LOQ =
Where
σ = The standard deviation of the response
S = The slope of the calibration curve
Measurement:
For instrumental and non- instrumental methods the quantitation limit is generally determination by the analysis of the samples with known concentration of the analyte and by establishing the minimum level at which the analyte can be determined with acceptable accuracy and precision.
In case of instrumental methods that exhibit back ground noise the ICH document describes to compare measured signals from samples with known concentration of analyte with those of blank samples. A typically acceptable signal to noise ratio is 10:1.
H) Linearity and range:
Linearity is the ability of the method to obtain test results that are directly proportional
to the analyte concentration within a given range.
Range:
Range of analytical procedure is the interval between the upper and lower
PHARMACEUTICAL ANALYSIS, K. M. C. P. Page 24
Measurement:
A range of standards should be prepared containing at least 5 different concentrations
of analyte, which are approximately evenly spaced and span 50 -150 % of the label claim.
At least 6 replicates per concentration to be studied. Plot a graph of concentration (on x- axis) Vs mean response (on y- axis). Calculate the regression equation, y- intercept and correlation co-efficient. Plot another graph of concentration (on x-axis) Vs response ratio (replicate response divided by concentration,(on y-axis).
The range of the method is validated by verifying that the analytical method provides acceptable precision, accuracy and linearity when applied to samples containing analyte at the extreme of the range as well as within the rage.
I) Ruggedness:
Ruggedness is the degree of reproducibility of test results obtained by the analysis of
the same samples under a variety of test conditions such as different laboratories, analyst, instruments, reagent lots, elapsed assay times, temperature, days etc.
It can be expressed as lack influence of the operation and environmental variable on the test results of the analytical method.
Determination:
By analysis of aliquots from homogenous lot in different laboratories by different
analyst using different operational and environmental condition that may differ but are still within specified parameter.
J) Robustness:
It is measure of capacity of an assay to remain unaffected by small but deliberate
variation in method parameters and provide an indication of its reliability in normal usage degradation and variation in chromatography columns, mobile phase and inadequate method development are common causes of lack of robustness.
Determination of robustness:
Method characteristics are assessed when one or more operating is varied by following
PHARMACEUTICAL ANALYSIS, K. M. C. P. Page 25
• Influence of variation of pH in a mobile phase • Influence of variation in mobile phase
• Influence of variation in nm
• Different columns (different lots and suppliers) • Temperature
• Flow rate
System suitability specification and tests:
It is essential for the assurance of quality performance of chromatographic system. The
accuracy and the precision of HPLC data collected, which begins with a well behaved chromatographic system. The system suitability parameter and tests are the parameters that help in achieving this purpose. Suitability parameters are
1. Capacity factor
2. Precision / injection repeatability 3. Relative retention
4. Resolution 5. Tailing factor
6. Theoretical plate number
System suitability is the checking of a system to ensure system performance before or
PHARMACEUTICAL ANALYSIS, K. M. C. P. Page 26
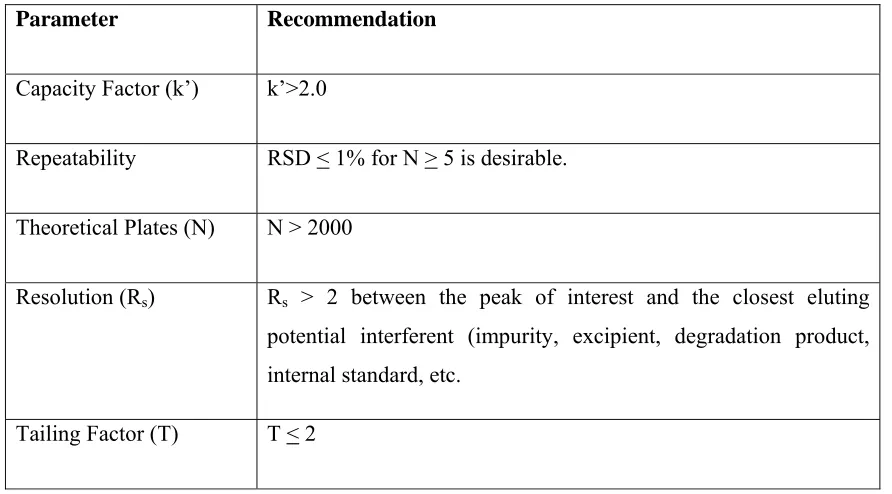
Table-1
System Suitability Parameters and Recommendations
Parameter Recommendation
Capacity Factor (k’) k’>2.0
Repeatability RSD < 1% for N > 5 is desirable.
Theoretical Plates (N) N > 2000
Resolution (Rs) Rs > 2 between the peak of interest and the closest eluting potential interferent (impurity, excipient, degradation product, internal standard, etc.
PHARMACEUTICAL ANALYSIS, K. M. C. P. Page 27
DRUG PROFILE
Naratriptan Hcl
Chemical properties [12]:
IUPAC name: N-methyl-3-(1-methyl-4-piperidinyl)-1H-indole-5-ethanesulfonamide mono
hydrochloride.
Empirical Formula: C17H25N3O2S•HCl
Molecular weight: 371.93
Structure:
Appearance: white to pale yellow powder
Solubility: Freely soluble in water, soluble in methanol and organic solvents
Category [13a]: Anti-migraine
Mechanism of action [13b]: Naratriptan binds with high affinity to 5-HT1D and
5-HT1B receptors. The therapeutic activity of naratriptan in migraine is generally attributed to
its agonist activity at 5-HT1D/1B receptors.
Pharmacokinetics [13b]:
PHARMACEUTICAL ANALYSIS, K. M. C. P. Page 28
After administration of 1- or 2.5-mg tablets, the Cmax is somewhat (about 50%) higher in
women than in men. During a migraine attack, absorption was slower, with a Tmax of 3 to 4
hours. Food does not affect the pharmacokinetics of naratriptan. Naratriptan displays linear kinetics over the therapeutic dose range.
Naratriptan is predominantly eliminated in urine, with 50% of the dose recovered unchanged and 30% as metabolites in urine. In vitro, naratriptan is metabolized by a wide range of cytochrome P450 isoenzymes into a number of inactive metabolites.
The mean elimination half-life of naratriptan is 6 hours. The systemic clearance of naratriptan is 6.6 ml/min/kg. The renal clearance (220 ml/min) exceeds glomerular filtration rate, indicating active tubular secretion. Repeated administration of naratriptan tablets does not result in drug accumulation.
Contraindication [12]:
• Hypersensitivity to drug or its components • Hemiplegic or basilar headaches
• Severe renal, cardiovascular or hepatic impairment
• History of cerebrovascular or peripheral vascular conditions • Ischemic bowel disease
• Uncontrolled hypertension
• Use of ergot-type drugs (such as dihydroergotamine) and other 5-HT1 agonists within 24
hours
• MAO inhibitor use within past 14 days
Dose [13a]: 1 or 2.5 mg as single dose; may be repeated in 4 hours.
Drug interactions [13a]:
• Drug-drug: Ergot-type compounds (dihydroergotamine, methysergide): prolonged
vasospastic reaction
• Hormonal contraceptives: increased naratriptan blood level and effects
• MAO inhibitors: increased systemic exposure to naratriptan, increased risk of adverse reactions
PHARMACEUTICAL ANALYSIS, K. M. C. P. Page 29
• Sibutramine: serotonin syndrome
• Drug-herbs: S-adenosylmethionine (SAM-e), St. John's wort: increased risk of adverse serotonergic effects
• Drug-behaviours: Cigarette smoking: increased naratriptan metabolism
Adverse effects [13a]:
• CNS: dizziness, drowsiness, malaise, fatigue, paresthesia
• CV: coronary artery vasospasm, myocardial infarction, ventricular fibrillation or tachycardia
• GI: nausea, vomiting
PHARMACEUTICAL ANALYSIS, K. M. C. P. Page 30
REVIEW OF LITERATURE
Sneha. B. et. al[14] ., reported a simple, precise, rapid, and reproducible RP -HPLC method
and validated for the determination of naratriptan Hydrochloride in pharmaceutical dosage form. Separation was achieved under optimized chromatographic condition on a kromasil C18 (ODS) column (250 X 4.6 mm i.d., particle size 5μ). The mobile phase consisted of methanolic phosphate buffer at pH 3.2 and acetonitrile in the ratio of 60: 40 v/v. An isocratic elution at a flow rate of 0.8 ml/ min at ambient temperature was used. The detection was carried out at 223 nm. The retention time of naratriptan was found to be at 3.1 min. The calibration curve was linear in the concentration range of 10–60 μg/ ml.
Madhavi. B. et. al[15] ., reported a simple, sensitive, precise and specific reverse phase high
performance liquid chromatographic method and validated for the determination of naratriptan hydrochloride in tablet dosage forms. The HPLC separation was carried out by reverse phase chromatography on purospher star C18column (150×4.6mm),5µm particle size. A mobile phase consisted of 0.01M triethylamine buffer pH 3.0: methanol (80:20%, v/v). Buffer: acetonitrile mixture in the ratio (70:30% v/v) was used as diluent (in isocratic mode at a flow rate of 1.5ml/min). The detection was monitored at 225 nm. The calibration curve for naratriptan hydrochloride was linear from 10 to 80µg/ml. The proposed method had adequate sensitivity, reproducibility and specificity for the determination of naratriptan hydrochloride in tablet dosage forms.
Kuldeep Patel. et. al [16]., reported a novel stability-indicating ultra-performance liquid
chromatographic assay method and validated for naratriptan and its degradant products. An isocratic UPLC method was developed to separate the drug from the degradation products, using an acquity UPLC BEH C18 (50 mm x 2.1 mm) column and mixture of water: acetonitrile (pH3.4) (60:40) as mobile phase. The flow rate was kept 0.3 ml/ min and the detection was carried out at 224 nm.
Kumara Swamy. G. et. al[17]., reported a simple efficient, precise and accurate
spectroscopic method and validated for quantitative estimation of naratriptan hydrochloride in bulk and pharmaceutical dosage form. Naratriptan solution was scanned in the UV range
PHARMACEUTICAL ANALYSIS, K. M. C. P. Page 31
Balasekhara Reddy Challa. et. al [18]., reported a specific liquid chromatography-tandem
mass spectrometry (LC-MS/MS) method for the quantification of naratriptan (NTP) in human plasma using naratriptan -d3 (NPD3) as an internal standard. Chromatographic separation was performed on a Zorbax SB-C18, 75×4.6 mm, 3.5 µm column with an isocratic mobile phase composed of 0.1% formic acid: acetonitrile (50:50 v/v) , at a flow rate of 0.6 ml/min.NTP and NPD3 were detected with proton adducts at m/z 336.5 and 339.4 in selected reaction monitoring (SRM) positive mode, respectively. The liquid-liquid extraction method was used to extract the NTP and NPD3.
Manish Yadav. et. al[19]., reported a simple, sensitive, selective and rapid high performance
liquid chromatography-tandem mass spectrometry (LC-ESI-MS/MS) method and validated for the quantification of naratriptan, using sumatriptan as internal standard (IS). The method concerned liquid–liquid extraction of naratriptan and IS in methyl-tert-butyl ether and dichloromethane mixture from 100 µl human plasma. The chromatographic separation was achieved on ACE C18 (50mm X 2.1mm, 5µm) analytical column under isocratic conditions, using 0.1% acetic acid and acetonitrile (15:85 v/v) at a flow rate of 0.4 ml/min. The parent product ion transitions for naratriptan (m/z 336.10-98.06) and IS (m/z 296.09-251.06) were monitored on a triple quadrupole mass spectrometer, operating in the multiple reaction monitoring (MRM) and positive ion mode. The linearity of the method for naratriptan was ascertained in the range of 103-20690 pg/ml with the analysis time of 1.5 min
Velasco-Aguirre. C. et. al[20]., reported that naratriptan exhibited an anodic response in
aqueous media over a broad pH range (pH 2–12), as determined by differential pulse voltammetry and cyclic voltammetry using glassy carbon electrodes. This response was irreversible in nature, diffusion-controlled and probably caused by the oxidation of the naratriptan indole moiety. The differential pulse voltammetry technique was performed in 0.1 mol/min Britton–Robinson buffer (pH 3), for the quantification of naratriptan in formulation.
Duléry. BD. et. al [21]., reported a liquid chromatographic-electrospray-mass spectrometric
PHARMACEUTICAL ANALYSIS, K. M. C. P. Page 32
2
Murthy.T.E.G.K. et. al[22]., reported a simple, sensitive, selective, accurate, precise,
economical, robust and rapid UV spectrophotometric method and validated for quantification of naratriptan. The influence of three different solvents on estimation of naratriptan from bulk and pharmaceutical dosage forms was studied. The solutions of naratriptan were prepared with the water and the solvent blends containing water: acetonitrile (1:1) and water: methanol (1:1). The solutions were scanned within the ranges of 200 nm to 400nm. Naratriptan exhibited λmax at 283.5 nm in case water. However the λmax was slightly shifted to 285 nm in case of acetonitrile: water and 284.5 in methanol: water. The method obeyed Beer-Lamberts law within the range of 10 to 50 µg/ml concentration.
Vishwanathan. K. et. al [23]., developed a rapid, sensitive and selective method for the
determination of antimigraine drugs from human serum to study pharmacokinetics of these drugs administered concurrently. Solid phase extraction (SPE) using Oasis HLB was used to extract the drugs (sumatriptan, naratriptan, zolmitriptan and rizatriptan) and the internal standard bufotenine from serum. A method based on liquid chromatography/tandem mass spectrometry (LC/MS/MS) was developed and validated to simultaneously quantitate these antimigraine drugs from human serum. The precursor and major product ions of the analytes were monitored on a triple quadrupole mass spectrometer with positive ion electrospray ionization (ESI) in the multiple reaction monitoring (MRM) mode.
Ramesh. C. et. al [24]., reported a three simple sensitive and reproducible visible
PHARMACEUTICAL ANALYSIS, K. M. C. P. Page 33
AIM AND PLAN OF THE STUDY
AIM AND SCOPE:
Naratriptan Hcl is a new drug, used in the treatment of migraine headaches. From the literature survey, it was found that there are very few RP-HPLC methods available for the quantification of naratriptan Hcl in tablet formulation. Early workers have also reported the determination of the drug by hyphenated techniques such as LC-MS and also by UV spectrophotometry.
Hence the aim of present work is to develop simple and validated RP-HPLC method by isocratic mode for the quantification of naratriptan Hcl in tablet formulation.
PLAN OF WORK:
The plan of present work is as follows: Method Development
¾ Selection of wavelength
¾ Selection of initial separation conditions
¾ Selection of mobile phase (pH, peak modifier, solvent strength and flow rate)
¾ Nature of the stationary phase
¾ Selection of separation method
Validation of the developed method
The developed method was validated by using the various validation parameters such as,
¾ Accuracy
¾ Precision
¾ Linearity, limit of detection (LOD) and limit of quantitation (LOQ)
¾ Selectivity / Specificity
¾ Robustness / ruggedness
PHARMACEUTICAL ANALYSIS, K. M. C. P. Page 34
METHODOLOGY
1) MATERIALS AND INSTRUMENTS USED:
a) Chemicals and Solvents used:
S.No Name Grade
1. Water Millipore
2. Acetonitrile Merck (HPLC Grade)
3. Potassium di hydrogen phosphate
AR grade
4. Orthophosphoric acid AR grade
b) Apparatus/ Instruments used:
S.No Name Model
1 HPLC
Pump Waters E 2695
Uv visible detector Waters 2489
Column C18
[250mmX 4.6mm,5µ]
Phen-s
2 Electronic balance Mettle Toledo
3 pH meter Elico
4 Sonicator Sonorex dig 10 p
5 Membrane filter AXIVA,SRP 15,
PHARMACEUTICAL ANALYSIS, K. M. C. P. Page 35
2) ANALYTICAL METHOD DEVELOPMENT AND OPTIMIZATION OF
CHROMATOGRAPHIC CONDITION
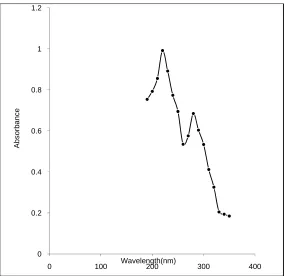
I. Determination of wave length:
A standard solution of the drug was prepared in water as follows in the following manner. A bout100 mg of naratriptan hydrochloride (Pure drug) was weighed accurately and dissolved in 100 ml of distilled water. From this 1ml was taken and made up to the final volume with water 10 ml in a volumetric flask so as to obtain the conc. of 100 µg/ml.
The resulting solution was scanned in the range of 200 nm to 400 nm in a UV-Vis spectrophotometer. The spectrum exhibited λmax at 224 nm and 280 nm. As the absorption was high at 224 nm, this wavelength was selected for the chromatographic method development. The data for the UV absorption spectrum was shown in table no.2 and the spectrum was shown in fig.1.
Table -2
Data for UV absorption spectrum
S. No. Wavelength in nm Absorbance
1. 200 0.765
2. 205 0.842
3. 210 0.856
4. 215 0.934
5. 224 1.020
6. 230 0.756
7 250 0.695
8 260 0.535
PHARMACEUTICAL ANALYSIS, K. M. C. P. Page 36
10 280 0.685
11 290 0.604
12 300 0.534
13 310 0.412
14 320 0.326
15 330 0.205
16 340 0.194
[image:38.612.169.456.415.691.2]17 350 0.185
Fig 1: UV spectrum of naratriptan Hcl
0 0.2 0.4 0.6 0.8 1 1.2
0 100 200 300 400
Abso
rb
ance
PHARMACEUTICAL ANALYSIS, K. M. C. P. Page 37
II. Optimization of chromatographic parameters:
a. selection of mode of separation.
As the drug was polar in nature, RP-HPLC method was preferred.
b. Selection and standardization of mobile phase and column:
The method development of naratriptan Hcl required adequate resolution of the drug peak in the chromatogram. To obtain a resolved peak, several solvent systems and different columns were tried and finally spursil C18 column with Acetonitrile and phosphate buffer (30:70) as mobile phase were selected for the analysis.
III. Preparation of Mobile Phase:
Preparation of buffer:
About 1.368 gm of potassium di hydrogen phosphate was accurately weighed and transferred in to a 1 lit beaker. The salt was dissolved in water and diluted to 1 lit with water. The pH was adjusted to 7.2 with ortho phosphoric acid
Preparation of mobile phase:
A mixture of acetonitrile and buffer solution (30:70) was prepared, mixed
well and filtered through 0.45 µ membrane filter and degassed.
IV. Selection of flow rate:
Different flow rates were tried in the method development for the drug. The
peak shapes of drug showed fronting and tailing with the flow rate 0.6ml and 0.8ml/min respectively. Finally the flow rate with 1.0 ml per minute was selected for the analysis.
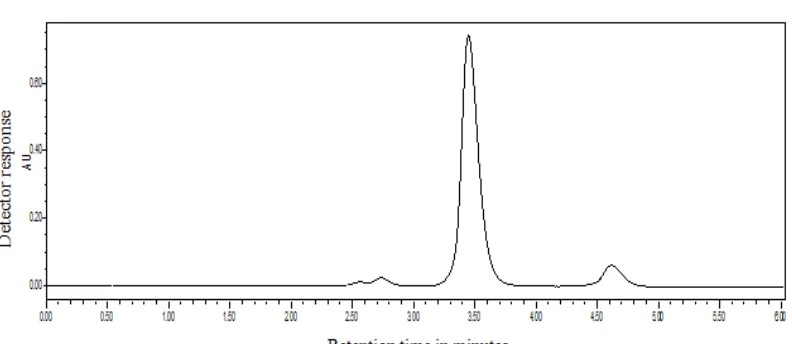
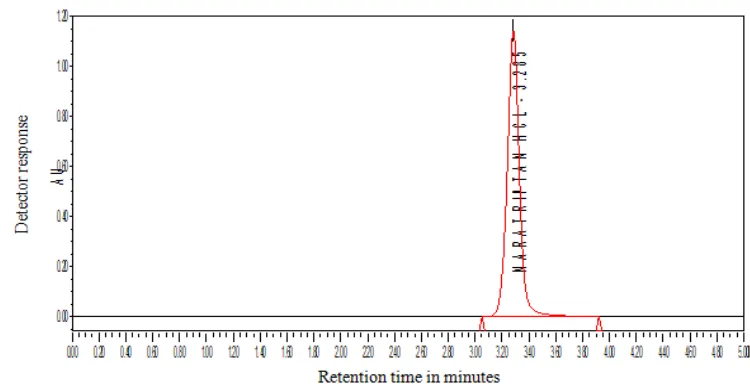
V. Determination of Retention time:
Standard stock solution of naratriptan Hcl:
PHARMACEUTICAL ANALYSIS, K. M. C. P. Page 38
Preparation of standard solution of naratriptan Hcl:
Further 5 ml of the above stock solution was pipetted into a 10 ml volumetric flask, diluted up to the mark with water. The solution was mixed well and filtered through 0.45 µ membrane filter.
10 µl of the solution was injected in to the chromatographic system and the chromatogram was recorded. The retention time of naratriptan Hcl was found to be at 3.285 min. The chromatogram was shown in fig. 6
The experiment was repeated under different set of condition (trial 1 to trial 4)
and shown as follows.
Trail 1:
Chromatographic conditions
Stationary phase : Spursil C18, 5 micron particle size, 250mm × 4.6mm
Mobile phase : Acetonitrile: methanol: Phosphate buffer (60:25:15)
Detection : 224 nm
Flow rate : 0.6 ml/min
Run time : 5.8 min
Sample size : 10 μl
Needle wash : Water HPLC grade
PHARMACEUTICAL ANALYSIS, K. M. C. P. Page 39
Chromatogram for trail condition-1
Fig: 2
Observation: Peak shape was not good and asymmetry was more than the limit.
Trail-2
Chromatographic conditions
Stationary phase : Spursil C18, 5 micron particle size, 250mm × 4.6mm
Mobile phase : Acetonitrile: Phosphate buffer (55:45)
Detection : 224 nm
Flow rate : 0.8 ml/min
Run time : 6 min
Sample size : 10 μl
Needle wash : Water HPLC grade
PHARMACEUTICAL ANALYSIS, K. M. C. P. Page 40
[image:42.612.134.530.91.263.2]Chromatogram for trail condition-2
Fig: 3
Observation: Peak shape was not good, theoretical plates were too less and asymmetry
was more than the limit.
Trail-3
Chromatographic conditions
Stationary phase : Spursil C18, 5 micron particle size, 250mm × 4.6mm
Mobile phase : Acetonitrile: Phosphate buffer (50:50)
Detection : 224 nm
Flow rate : 1 ml/min
Run time : 5 min
Sample size : 10 μl
Needle wash : Water HPLC grade
PHARMACEUTICAL ANALYSIS, K. M. C. P. Page 41
Chromatogram for trail condition-3
Fig: 4
Observation: Peak shape was not good; asymmetry was more than the limit.
Trail-4
Chromatographic conditions
Stationary phase : Spursil C18, 5 micron particle size, 250mm × 4.6mm
Mobile phase : Acetonitrile: Phosphate buffer (40:60)
Detection : 224 nm
Flow rate : 1 ml/min
Run time : 5.4 min
Sample size : 10 μl
Needle wash : Water HPLC grade
[image:43.612.122.502.86.323.2]PHARMACEUTICAL ANALYSIS, K. M. C. P. Page 42
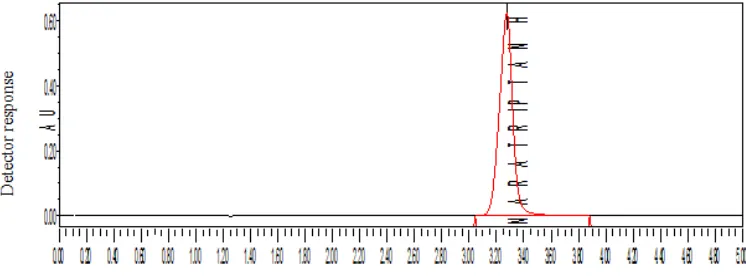
Chromatogram for trail condition-4
Fig-5
Observation: Peak shape was good, theoretical plates were too less and asymmetry
was more than the limit.
OPTIMIZED METHOD
FIXED CHROMATOGRAPHIC CONDITION
Stationary phase : Spursil C18, 5 micron particle size, 250mm × 4.6mm
Mobile phase : Acetonitrile: Phosphate buffer (30:70)
Flow rate : 1.0 ml/ min
Wavelength : 224 nm
Injection volume : 10 μl
Needle wash : Water HPLC grade
Column temperature : Ambient
[image:44.612.115.506.125.290.2]PHARMACEUTICAL ANALYSIS, K. M. C. P. Page 43
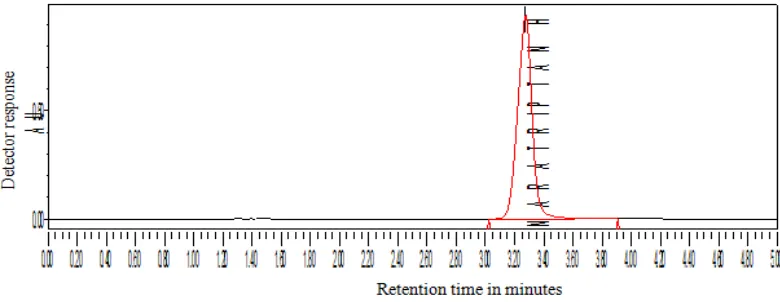
Chromatogram for fixed Chromatographic Condition
Fig6:
Observation: Peak shape was good, theoretical plates were adequate and asymmetry
was within the limit.
QUANTITATIVE DETERMINATION OF THE DRUG BY USING THE
DEVELOPED METHOD
Sample : Naratriptan Hcl tablet
Label claim: 1 mg
Preparation of blank: Millipore water was used as blank.
Standard solution of naratriptan Hcl:
About 10 mg of naratriptan Hcl working standard was accurately weighed and
transferred in to 50 ml volumetric flask, added about 25 ml of water and sonicated to dissolve it completely and made up the volume up to the mark with the same solvent (Stock solution 200 µg/ml )
Further 5 ml of the above stock solution was pipetted into a 10ml
volumetric flask, diluted up to the mark with water, mixed well and filtered through 0.45µm filter. (The final concentration of resulting solution was 100 µg/ml).
Sample solution of naratriptan Hcl:
20 naratriptan Hcl tablets were weighed and calculated the average weight. The
PHARMACEUTICAL ANALYSIS, K. M. C. P. Page 44
in to 50 ml volumetric flask added, about 25 ml of water and sonicated to dissolve it completely and made up the volume up to the mark with diluent, mixed well and filtered through 0.45µm filter.
Further 5 ml of the above stock solution was pipetted into a 10 ml volumetric flask. The volume was made up with the diluent, mixed well and filtered through 0.45µm filter. (The final concentration of resulting solution was 100 µg/ml).
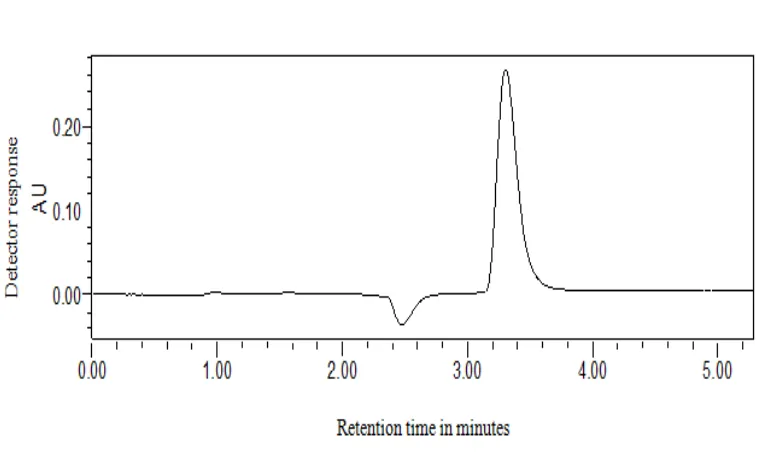
Procedure:
10 µl of the solution of each of blank, standard and sample solution were injected separately in to the chromatographic system. The chromatograms were recorded, shown in fig.7-9 and reported in table.3.
Amount of drug present in the tablet was calculated using the following formula:
Content of the drug in a tablet of average weight
=
×
×
×
Average weight of tablet
Percentage content =
×
100
PHARMACEUTICAL ANALYSIS, K. M. C. P. Page 45
Chromatogram of Blank
Fig.7
Chromatogram of Standard preparation
Fig.8
PHARMACEUTICAL ANALYSIS, K. M. C. P. Page 46
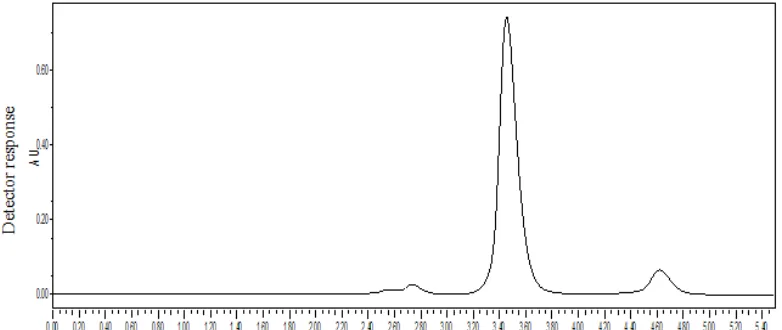
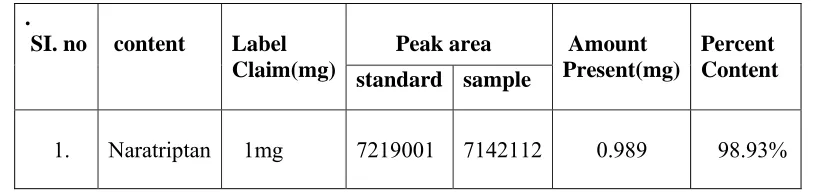
Chromatogram of assay preparation
Fig.9
[image:48.612.148.495.127.265.2]
Table-3
Data for assay
.
SI. no content Label
Claim(mg)
Peak area Amount
Present(mg)
Percent Content
standard sample
1.
Naratriptan 1mg 7219001 7142112 0.989 98.93%
Acceptance criteria: 97.0- 103% w/v.
[image:48.612.112.520.460.557.2]
PHARMACEUTICAL ANALYSIS, K. M. C. P. Page 47
VALIDATION
Validation of analytical method for assay of naratriptan Hcl:
Validation of analytical method is a process to establish that the performance characteristics of the developed method meet the requirement of the intended analytical application.
Design of experiment:
Typical analytical parameters used in assay validation were,
• Accuracy
• Precision
• Linearity and range
• Limit of Detection(LOD)
• Limit of Quantitation(LOQ)
• Specificity
• Robustness
• Ruggedness
• System suitability studies
‐ Theoretical plate count
‐ Relative standard deviation
PHARMACEUTICAL ANALYSIS, K. M. C. P. Page 48
1. ACCURACY
The accuracy of an analytical method is the closeness of the test result obtained by that method to the true value.
Accuracy is measured as the percentage of the analytes recovered by the assay. Spiked samples were prepared in triplicate at three intervals a range of 50-150% of the target concentration and injected in to the HPLC system.
Acceptance criteria : percentage recovery should be with in
97-103% w/v
Preparation of working mixture solution:
Naratriptan working standard equivalent to 50%, 100%, 150% were weighed
accurately and transferred in to three different 50 ml volumetric flask. 200 mg of placebo was weighed and transferred to each flask, dissolved with small volume of diluent and made up the volume. 5 ml of this solution was diluted to 10 ml with water. The solution was filtered through 0.45 µ membrane filter.
10 µl of each of this solution were injected and chromatograms were recorded as shown in fig. 10-12. The recovery study data for naratriptan was shown in table 4.
PHARMACEUTICAL ANALYSIS, K. M. C. P. Page 49
Chromatogram for accuracy at 50%
Fig.10
Chromatogram for accuracy at 100 %
Fig.11
PHARMACEUTICAL ANALYSIS, K. M. C. P. Page 50
Chromatogram for accuracy at 150%
Fig.12
Data for accuracy studies
Table-4
SI.
No. Recovery
Area obtained
Average area
Amount added in
mg
Amount recovered
in mg
% Recovery
1 50%
3474789
3506014 5.010 4.897 97.94%
3558456
3484798
2 100%
7134565
7202001 10.021 9.956 99.56%
7125469
7345969
3 150%
10089721
10693349 15.022 14.783 98.55% 11092674
PHARMACEUTICAL ANALYSIS, K. M. C. P. Page 51
2. PRECISION
Precision of an analytical method is the degree of agreement among individual test result when the procedure is applied repeatedly to multiple sampling of a homogenous sample. Precision of analytical method is usually expressed as the standard deviation or relative standard deviation.
Determination:
The precision of the ana