Vol. 2, No. 4 (2012): 84-90 Research Article
Open Access
HPLC Method development and Validation for the assay of
Ceftriaxone sodium injection
Narottam Pal
1*, A. Srinivasa Rao
2and Mohd Abdul Hadi
31
Assistant Professor, Department of Pharmaceutical Analysis, Bhaskar Pharmacy College (JB Group of Educational Institutions), Yenkapally (V), Moinabad (M), R.R.District, Hyderabad-500075, Andhra Pradesh, India
2
Professor and Principal, Bhaskar Pharmacy College (JB Group of Educational Institutions), Yenkapally (V), Moinabad (M), R.R.District, Hyderabad-500075, Andhra Pradesh, India
3
Assistant Professor, Department of Pharmaceutics, Bhaskar Pharmacy College (JB Group of Educational Institutions), Yenkapally (V), Moinabad (M), R.R.District, Hyderabad-500075, Andhra Pradesh, India
* Corresponding author, email: [email protected]
ABSTRACT
Ceftriaxone sodium is a third-generation cephalosporin antibiotic. Like other third-generation cephalosporins, it has broad spectrum activity against Gram positive and Gram-negative bacteria. In most cases, it is considered to be equivalent to cefotaximein in terms of safety and efficacy. In the present study an HPLC method was developed and validated for the assay of ceftriaxone sodium injection. The chromatographic system was equipped with Xterra C18 (4.6 x 150mm, 5 m, Make:Waters) column and detector set at 242 nm, in conjunction with a mobile phase of Disodium hydrogen phosphate buffer and Acetonitrile in the ratio of 65:35 (pH 4.3, adjusted with orthophosphoric acid) at a flow rate of 1.0ml/min and the injection volume set at 20 µl with 9 minutes of runtime. The described method was linear over a concentration range of 10.0-100.0 µg/ml for the assay of ceftriaxone sodium with a with good linearity response of 0.999. The retention time of ceftriaxone sodium was 2.6 min ± 0.02. The results of analysis were validated. The results of the study showed that the proposed HPLC method was simple, rapid, precise and accurate, which is useful for the routine determination of ceftriaxone sodium in injections.
Keywords: Ceftriaxone sodium, cephalosporins, HPLC, Acetonitrile
INTRODUCTION
Ceftriaxone (see Figure. 1) is (6R,7R) - 3 [(acetyl - oxy) methyl] - 7 - [[(2Z)-(2-amino-4 thiazolyl)(methoxyamino)-acetyl] amino]-8-oxo-5-thia-1-azabicyclo[4.2.0]oct-2-ene-2-carboxylic acid [1]. Ceftriaxone is a cephalosporin beta-lactam antibiotic used in the treatment of bacterial infections caused by susceptible, usually gram positive microorganisms. The bactericidal activity of ceftriaxone results from the inhibition of the cell wall synthesis and is mediated by ceftriaxone binding to penicillin-binding proteins. It inhibits the mucopeptide synthesis in the bacterial cell wall. The betalactam moiety of ceftriaxone binds to carboxypeptidase, endopeptidase, and transpeptidase in the bacterial cytoplasmic membrane. These enzymes are involved in cell wall synthesis and cell division. By binding to these enzymes, ceftriaxone results in the formation of defective cell walls and cell death [2].
Figure 1. Chemical structure of ceftriaxone sodium Beta-lactam antibiotics undergo rapid ring opening due to hydrolysis, which results in a lower antimicrobial activity [3, 4], therefore it is very important for the determination of ceftriaxone in pharmaceutical samples in order to ensure their stability. Ceftriaxone is commercially available as the disodium salt, ceftriaxone for injection must be reconstituted with sterile water for injection or parenteral solutions at the time of using, and this solution
Received: 20 October 2012 Revised: 16 November 2012 Online: 16 November 2012
usually is administered by intravenous infusion or intramuscular injection. Since doses depend on the age of the patient and the disease, and ceftriaxone is the drug of choice for anti-infective therapy in the majority of paediatrics children hospitals, generally only a portion of the constituted solution is used[5].
There are several methods to estimate ceftriaxone, including high performance liquid chromatography (HPLC), high performance thin layer chromatography, capillary electrophoresis2, and spectrophotometry[6]. The present work describes a high performance liquid chromatographic method for the assay of ceftriaxone sodium injection, which can be used for the quality control of this formulation. The benefit of this method is that by doing one column analysis one can save time and resources. This study achieved satisfactory results in terms of selectivity, linearity, precision, and accuracy under simple chromatographic conditions.
MATERIALS AND METHODS
Chemicals and reagents
Ceftriaxome sodium was obtained as a gift sample from Teena Biolabs Pvt Ltd, Hyderabad. Disodium hydrogen phosphate was purchased from Genis enterprises, Hyderabad. Acetonitrile HPLC Grade was purchased from Rankem, India. All other chemicals were of analytical reagent grade unless specified.
Chromatographic conditions
Chromatographic separation was performed on a Xterra C18 (4.6 x 150mm, 5 ms Make:Waters, software:Empower) with UV- detection of 242 nm at
ambient temperature. The injection volume was 20μl with a flow rate of 1.0 ml/min per minute and a run time of 5 minutes.
Mobile phase and solutions
The mobile phase consisting of a binary mixture of acetonitrile and buffer adjusted to pH 3.5 with orthophosphoric acid in a ratio of 65:35. Degassed by ultrasonic water bath and filtered through 0.45μ
membrane filter.
Standard and Sample Solution Preparation
Accurately weighed and transferred 24.8 mg of Ceftriaxone sodium powder working standard into a 100 mL volumetric flask, added about 70 mL of diluents(mobile phase) and sonicated to dissolve it completely and made volume up to the mark with the same solvent (Stock solution). Further pipetted 2 ml of the above stock solution out into a 10ml volumetric flask and diluted up to the mark with diluent. Mixed well and filtered through 0.45µm filter. Similar procedure was also carried out for sample preparation.
Calibration
Five different concentrations (10, 25, 50, 75 and 100
μg/ml) of Ceftriaxone sodium solutions were prepared for
linearity studies. The responses were measured as peak areas and plotted against concentration.
Estimation of Ceftriaxone sodium from injectable
formulation [7]
Inject 20 L of the standard, sample into the chromatographic system and measure the area for the Ceftriaxone peak and calculate the %Assay by using the formulae.
Assay % = AT WS DT P Avg. Wt --- x ---x --- x ---x--- X 100 AS DS WT 100 Label Claim
where:
AT = Peak Area of Ceftriaxone sodium obtained with test preparation
AS = Peak Area of Ceftriaxone sodium obtained with standard preparation
WS = Weight of working standard taken in mg WT = Weight of sample taken in mg
DS = Dilution of Standard solution DT = Dilution of sample solution
P = Percentage purity of working standard
System Suitability
Tailing factor for the peak due to Ceftriaxone in Standard solution should not be more than 1.5. Theoretical plates for the Ceftriaxone peak in Standard solution should not less than 2500.
Validation Parameters[7,8]
Precision
Preparation of stock solution:
Accurately weighed and transferred 24.8mg of Ceftriaxone working standard into a 100 mL volumetric flask, added about 70 mL of mobile phase and sonicated to dissolve it completely and made volume up to the mark with the same solvent (Stock solution).
Preparation of 50 µg/ml solution:
Further pipetted 2 ml of the above stock solution out into a 10ml volumetric flask and diluted up to the mark with diluent. Mixed well and filtered through 0.45µm filter.
Intermediate Precision/Ruggedness
To evaluate the intermediate precision (also known as Ruggedness) of the method, Precision was performed on different day by using different make column of same dimensions.
Accuracy
Preparation of Standard stock solution:
completely and made volume up to the mark with the same solvent (Stock solution).
For preparation of 50% solution (With respect to target Assay concentration):
Accurately weighed and transferred 15.2mg of Ceftriaxone API sample into a 100 mL volumetric flask, added about 70 mL of diluent and sonicated to dissolve it completely and made volume up to the mark with the same solvent. (Stock solution). Further pipetted 2 ml of the above stock solution out into a 10ml volumetric flask and diluted up to the mark with diluent. Mixed well and filtered through 0.45µm filter.
For preparation of 100% solution (With respect to target Assay concentration):
Accurately weigh and transfer 26.1 mg of Ceftriaxone API sample into a 100 mL volumetric flask add about 70 mL of Diluent and sonicate to dissolve it completely and make volume up to the mark with the same solvent.(Stock solution). Further pipette 2 ml of the above stock solution into a 10ml volumetric flask and dilute up to the mark with diluent. Mix well and filter through 0.45µm filter.
For preparation of 150% solution (With respect to target Assay concentration)
Accurately weigh and transfer 44.5 mg of Ceftriaxone API sample into a 100 mL volumetric flask add about 70 mL of Diluent and sonicate to dissolve it completely and make volume up to the mark with the same solvent. (Stock solution). Further pipette 2 ml of the above stock solution into a 10ml volumetric flask and dilute up to the mark with diluent. Mix well and filter through 0.45µm filter.
Procedure
Inject the standard solution, Accuracy 50%, Accuracy -100% and Accuracy -150% solutions. Calculate the Amount found and Amount added for Ceftriaxone and calculate the individual recovery and mean recovery values.
Acceptance Criteria
The % recovery for each level should be between 98.0 to 102.0%.
Linearity
From stock solution the following preparations were made-
Preparation of Level – I (10 µg/ml):
1 ml of stock solution has taken in 25 ml of volumetric flask dilute up to the mark with diluent.
Preparation of Level – II (25 µg/ml):
1ml of stock solution taken in 10 ml of volumetric flask dilute up to the mark with diluent.
Preparation of Level – III (50 µg/ml):
2ml of stock solution taken in 10 ml of volumetric flask dilute up to the mark with diluent.
Preparation of Level – IV (75 µg/ml):
3ml of stock solution taken in 10 ml of volumetric flask dilute up to the mark with diluent.
Preparation of Level – V (100 µg/ml):
4ml of stock solution taken in 10 ml of volumetric flask dilute up to the mark with diluent.
Procedure
Inject each level into the chromatographic system and measure the peak area.Plot a graph of peak area versus concentration (on X-axis concentration and on Y-axis Peak area) and calculate the correlation coefficient.
Limit of detection
Preparation of 10µg/ml solution:
Accurately weigh and transfer 10 mg of Ceftriaxone API sample into a 100 mL volumetric flask add about 70 mL of Diluent and sonicate to dissolve it completely and make volume up to the mark with the same solvent (Stock solution). Pipette 1 ml of stock solution into a 10 ml of volumetric flask dilute up to the mark with diluent.
Preparation of 0.2% solution At Specification level (0.02µg/ml solution):
Pipette 1mL of 10µg/ml solution into a 10 ml of volumetric flask and dilute up to the mark with diluent. Further pipette 0.2mL of above diluted solution into a 10 ml of volumetric flask and dilute up to the mark with diluent.
Limit of quantification
Preparation of solution was same as in case of Limit of detection
Robustness
As part of the Robustness, deliberate change in the Flow rate, Mobile Phase composition was made to evaluate the impact on the method.
a) The flow rate was varied at 0.7 ml/min to 0.9 ml/min. Standard solution 25 µg/ml was prepared and analysed using the varied flow rates along with method flow rate. b).The Organic composition in the Mobile phase was varied from 30% to 40%. Standard solution 50 µg/ml was prepared and analysed using the varied Mobile phase composition along with the actual mobile phase composition in the method.
RESULTS AND DISCUSSION
System Suitability Results
1) Tailing factor obtained from the standard injection is 1.24
2) Theoretical Plates obtained from the standard injection is 5116
Table 1. Results for estimation of Ceftriaxone sodium
S. No. Sample Name Peak Name RT AREA HEIGHT
(μV)
USP Plate
Count
USP Tailing
1 Ceftriaxone
standard
Ceftriaxone 2.851 857515 140934 5116.77 1.24
2 Ceftriaxone sample Ceftriaxone 2.886 876284 141501 5018.52 1.25
Figure 2. Spectras of ceftriaxone sodium injection of standard and sample
Precision: The values of the relative standard deviation of fivereplicate injections of the standard solutions lie well within the limits (% RSD ≤ 0.26), indicating the injection repeatability of the method (Table 2 and Figure 3).
Table 2. Precision -Percentage RSD value
S. No. INJ PEAK RT AREA HEIGHT
1 1 Ceftriaxone 2.861 920466 129848 2 2 Ceftriaxone 2.862 916699 129017 3 3 Ceftriaxone 2.864 916166 129288 4 4 Ceftriaxone 2.864 915895 129078 5 5 Ceftriaxone 2.863 913892 128287
Mean 916624
SD 2396.2
%RSD 0.26
Figure 3. Precision spectras of ceftriaxone sodium
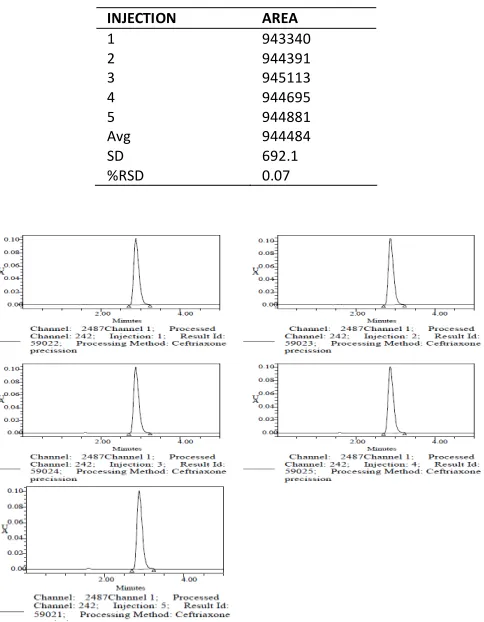
Intermediate Precision/Ruggedness
The values of the relative standard deviation of five replicate injections of the standard solutions lie well
within the limits (% RSD ≤ 0.07), indicating the injection repeatability of the method (Table 3 and Figure 4).
Table 3. Intermediate Precision -Percentage RSD value
INJECTION AREA
1 943340
2 944391
3 945113
4 944695
5 944881
Avg 944484
SD 692.1
%RSD 0.07
Figure 4. Intermediate precision spectras
Table 4. Accuracy for 50% solution -Percentage RSD value
S. No. INJ PEAK NAME RT AREA HEIGHT
1 1 Ceftriaxone 2.867 536615 71985 2 2 Ceftriaxone 2.867 536680 71803 3 3 Ceftriaxone 2.867 537012 70916
Mean 536769
SD 213.0
%RSD 0.04
Table 5. Accuracy for 100% solution -Percentage RSD value
S. No. INJ PEAK RT AREA HEIGHT
1 1 Ceftriaxone 2.866 912211 121925 2 2 Ceftriaxone 2.866 913331 122198 3 3 Ceftriaxone 2.866 914670 122067
MEAN 913404
SD 1231.3
%RSD 0.13
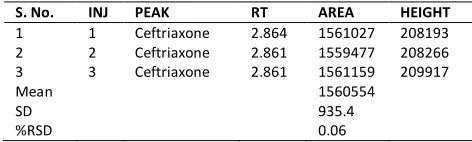
Table 6. Accuracy for 150% solution -Percentage RSD value
S. No. INJ PEAK RT AREA HEIGHT
1 1 Ceftriaxone 2.864 1561027 208193 2 2 Ceftriaxone 2.861 1559477 208266 3 3 Ceftriaxone 2.861 1561159 209917
Mean 1560554
SD 935.4
%RSD 0.06
Acceptance Criteria for accuracy: The % Recovery for each level should be between 98.0 to 102.0%. From the experimental value the recovery was found to be within the limit (Table 6).
Table 7. Percentage Recovery
% CONC
Mean Area
Amount Added
(mg)
Amount Found
(mg)
% Recovery
Mean Recovery
50 536769 15.2 15.36 101.05 100 913404 26.1 26.15 100.2
150 1560554 44.5 44.68 100.4 100.4
Figure 5. Accuracy spectras for 50% solution
Figure 6. Accuracy spectras for 100% solution
Figure 7. Accuracy spectras for 150% solution
Linearity: Correlation coefficient should be not less than 0.999. From the experimental value the correlation coefficient was found to be the same (Table 8 and Figure 8).
Table 8. Linearity-Correlation coefficient value
S. No. LINEARITY
LEVEL CONC (µg/ml) Area
1 I 10 224318
2 II 25 547842
3 III 50 963015
4 IV 75 1472470
5 V 100 1822719
6 VI 125 2161225
Figure 8. Linearity spectras of ceftriaxone sodium at various concentrations
Limit of detection: S/N Ratio value should be 3 for LOD. Calculation of S/N Ratio:
Average Baseline Noise obtained from Blank: 24 µV Signal Obtained from LOD solution (0.2% of target assay concentration): 69 µV
S/N = 69/24 = 2.87.
From the experimental value the S/N ratio was found to be within limit i.e. 2.87 (Figure 9).
Figure 9. Spectra for limit of detection
Limit of quantification: S/N Ratio value should be 10 for LOQ solution
Calculation of S/N Ratio:
Average Baseline Noise obtained from Blank: 24 µV Signal Obtained from LOD solution (0.8% of target assay concentration): 253µV
S/N = 253/24 = 10.54
From the experimental value the S/N ratio was found to be within limit i.e. 10.54 (Figure 10).
Figure 10. Spectra for limit of quantification
Robustness: When flow rate was varied at 0.7 ml/min to 0.9 ml/min it was found that the variation in flow rate do not affect the method significantly. Hence it indicates that
the method is robust even by change in the flow rate ±10% (Table 9 and Figure 11).
Table 9. Robustness-Flow rate Variation values
S. No. FLOW RATE
(ml/min)
USP PLATE COUNT
TAILING
1 0.7 5132 1.24
2 0.8 5116 1.24
3 0.9 4610 1.21
Figure 11. Spectras for robustness with variable flow rates
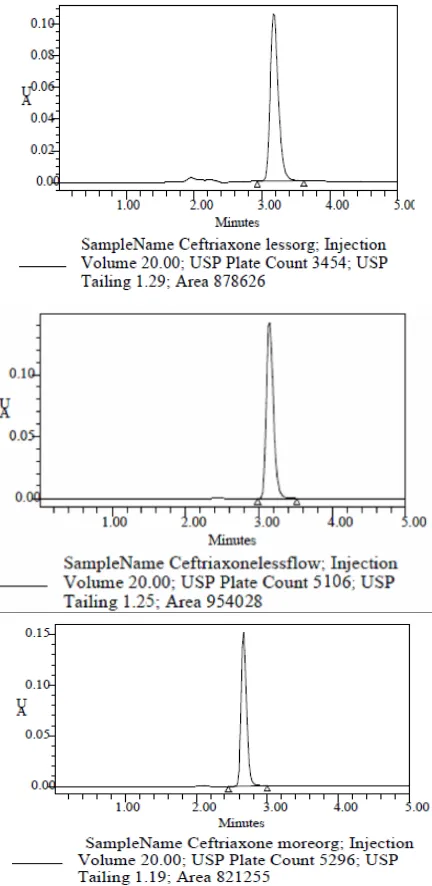
When organic composition in the Mobile phase was varied from 30% to 40% it was found that in the mobile phase the variation in less organic composition or variation in more organic composition do not affect the method significantly. Hence it indicates that the method is robust even by change in the 10% more organic content in Mobile phase(Table 10 and Figure 12).
Table 10. Robustness-Flow rate variation values
S. No. CHANGE IN
ORGANIC PART USP PLATE
COUNT
TAILING
1 30 part 3454 1.29
2 35 part 5106 1.25
Figure 12. Spectras for robustness with less or more organic solvents
CONCLUSION
More rapid, precise, specific, sensitive, economic, reproducible, isocratic reverse phase HPLC method was developed and validated for quantitative determination of Ceftriaxone sodium injection. The calibration curve was constructed at six concentration levels and the method was found to be linear. The correlation coefficient was found to be ≥0.9999. Thus, the proposed analytical
method was simple and represents specific procedure for assay of Ceftriaxone injection and this HPLC method successfully applicable for regular analysis of Ceftriaxone sodium in quality control laboratories.
ACKNOWLEDGEMENTS
Authors thank to Teena Biolabs Pvt Ltd, Hyderabad for providing gift sample of ceftriaxome sodium. The authors are also thankful to Mrs N. Meenaskhi, Commercial Manager and Mr. Vishnu Bardhan Reddy incharge QC of Teena Biolabs Pvt. Ltd. for their valuable suggestions in
analytical part of this research work. The authors are also thankful to Mr. Joginpally Bhaskar Rao Garu, Chairman and A Srinivasa Rao, Principal, Bhaskar Pharmacy College, Moinabad, R.R.District for providing the research lab facilities to carry out this research work.
REFERENCES
1. Budavari S (2001) The Merck Index, 13th edn, Merck & Co., Whitehouse station, NJ.
2. Abu Tariq, Masoom Raza Siddiqui, et. Al. (2010). Development and validation of high performance liquid chromatographic method for the simultaneous determination of ceftriaxone and vancomycin in pharmaceutical formulations and biological samples. ScienceAsia 36: 297–304.
3. W. Lund. The Pharmaceutical Codex (1994), 12th ed. the Pharmaceutical Press, London, pp. 277-283.
4. S. Yoshioka, V. Stella (2000). Stability of Drugs and Dosage Forms. Kluwer Academic Plenum Publishers, New York, pp. 11-12.
5. G. K. Me Evoy. AHFS Drug Information. American Society of Health-System Pharmacists, Bethesda, 2006; pp. 154-170. 6. Rodrigues A Jr, Vila MMDC, Tubino M (2008). Green
spectrophotometric method for the quantitative analysis of vancomycin in pharmaceuticals and comparison with HPLC. Anal Lett 41, 822–36.
7. Practical HPLC Method Development; Second Edition, Lloyd.R.Snyder, Joseph.J.Kirkland, Joseph.L.Glajch, A Wiley Interscience Publication.
8. http://www.ich.gov.in
© 2012; AIZEON Publishers