R E S E A R C H A R T I C L E
Open Access
Parallel deep transcriptome and proteome
analysis of zebrafish larvae
Magnus Palmblad
1*, Christiaan V Henkel
2, Ron P Dirks
2, Annemarie H Meijer
3, André M Deelder
1and Herman P Spaink
3Abstract
Background:Sensitivity and throughput of transcriptomic and proteomic technologies have advanced
tremendously in recent years. With the use of deep sequencing of RNA samples (RNA-seq) and mass spectrometry technology for protein identification and quantitation, it is now feasible to compare gene and protein expression on a massive scale and for any organism for which genomic data is available. Although these technologies are currently applied to many research questions in various model systems ranging from cell cultures to the entire organism level, there are few comparative studies of these technologies in the same system, let alone on the same samples. Here we present a comparison between gene and protein expression in embryos of zebrafish, which is an upcoming model in disease studies.
Results:We compared Agilent custom made expression microarrays with Illumina deep sequencing for RNA
analysis, showing as expected a high degree of correlation of expression of a common set of 18,230 genes. Gene expression was also found to correlate with the abundance of 963 distinct proteins, with several categories of genes as exceptions. These exceptions include ribosomal proteins, histones and vitellogenins, for which biological and technical explanations are discussed.
Conclusions:By comparing state of the art transcriptomic and proteomic technologies on samples derived from
the same group of organisms we have for the first time benchmarked the differences in these technologies with regard to sensitivity and bias towards detection of particular gene categories in zebrafish. Our datasets submitted to public repositories are a good starting point for researchers interested in disease progression in zebrafish at a stage of development highly suited for high throughput screening technologies.
Background
In recent years there have been tremendous advances in transcriptome and proteome technologies. For transcrip-tome analysis the use of deep sequencing of RNA sam-ples (RNA-seq) has shown to be an excellent method to obtain unbiased datasets that correlate well with micro-array analyses [1]. As to the depth of sequences that can be analyzed it is clear that transcriptome sequencing is currently hardly limited by sequencing hardware, whereas this is still not the case for proteomic studies; however, also in the latter case there are rapid advances in mass spectrometry methods for high-throughput
analyses [2-4]. Although these technologies are cur-rently applied to many research questions in various model systems ranging from cell cultures to entire or-ganism level, there are few comparative studies of these technologies in the same system. Therefore, there is still little quantitative information on how various transcrip-tome and proteomic technologies compare as to their sensitivities towards rarely expressed genes and the dy-namic range of detection of genes expressed at various levels. In this study we chose the zebrafish model [5] to compare state of the art transcriptome and proteome analyses. We have used samples derived from the same batches of larvae to compare deep sequencing of mRNA with a fast mass spectrometrical ion trap technology.
* Correspondence:[email protected] 1
Center for Proteomics and Metabolomics, Leiden University Medical Center, P.O. Box 9600, Zone L04-Q, 2300 RC, Leiden, The Netherlands
Full list of author information is available at the end of the article
Methods
Zebrafish larvae
Zebrafish were handled in compliance with local animal welfare regulations and maintained according to standard protocols (http://zfin.org). The breeding of adult fish was approved by the local animal welfare committee (DEC) of the University of Leiden, The Netherlands. All protocols adhered to the international guidelines specified by the EU Animal Protection Directive 86/609/EEC. Ten parent zeb-rafish couples were kept separately from one another for mating the following week. Embryos were grown at 28°C in egg water (60μg/ml Instant ocean sea salt, Sera Marin). The egg water was refreshed every day. At 5 DPI, approxi-mately 200 embryos per condition were collected and snap-frozen in liquid nitrogen. The frozen embryos were ground to homogeneity with a pipet tip and split into two portions that were stored at−80°C. One part was used for RNA sample preparation and the other part for protein sample preparation.
RNA isolation
Embryos were homogenized in 1 ml of TRIzol reagent (Invitrogen), and total RNA was extracted according to the manufacturer’s instructions. RNA samples were treated with DNaseI (Ambion) to remove residual genomic DNA. RNA integrity was analysed on an Electrophoresis Bio-Analyzer (Agilent Technologies). The average RIN value of the RNA samples was 9.7 with a minimum of 9.5.
Microarrays
For microarrays analysis 500 ng total RNA was com-bined with Spike A and amplified according to the Agilent Two-Color Microarray-Based Gene Expression Analysis guide version 5.5 (G4140-90050, Agilent tech-nologies). In order to exclude dye bias we have labelled all used sample either with Cy3 or Cy5 label. Amino-allyl modified nucleotides were incorporated during the aRNA synthesis (2.5 mM rGAC (GE Healthcare), 0.75 mM rUTP (GE Healthcare), 0.75 mM AA-rUTP (TriLink Biotechnologies). Synthesized aRNA was puri-fied with the E.Z.N.A. MicroElute RNA Clean Up Kit (Omega Bio-Tek). The quality was inspected on the BioAnalyzer (Agilent Technologies) with the Agilent RNA 6000 kit (5067–1511, Agilent Technologies). 5 μg of aRNA was dried down and dissolved in 50 mM car-bonate buffer pH 8.5. Individual vials of Cy3/Cy5 from the mono-reactive dye packs (GE Healthcare) were dis-solved in 200 μl DMSO. To each sample, 10 μl of the appropriate CyDye dissolved in DMSO was added and the mixture was incubated for 1 h. Reactions were quenched with the addition of 5 μl 4 M hydroxylamine (Sigma-Aldrich). The labeled aRNA was purified with the E.Z.N.A. MicroElute RNA Clean Up Kit. Yields of
aRNA and CyDye incorporation were measured on the NanoDrop ND-1000 (Thermo Scientific).
Each hybridization mixture was made up from 825 ng Cy3 and 825 ng Cy5 material. Hybridization mixtures were made as described in the Agilent Two-Color Microarray-Based Gene Expression Analysis guide version 5.5 (G4140-90050, Agilent technologies). The samples were loaded onto 4x180k D. rerio micro-arrays (Design ID:028233, Agilent Technologies) and hybridized for 17 hours at 65°C. Afterwards the slides were washed and scanned (20 bit, 3μm resolution) in an ozone-free room with the Agilent G2505C scanner as described in the Agilent Two-Color Microarray-Based Gene Expression Analysis guide version 5.5 (G4140-90050, Agilent tech-nologies). Data was extracted with Feature Extraction (v10.7.3.1, Agilent Technologies) with the GE2_107_Sep09 protocol for two-color Agilent micro-arrays.
Micro-array data was processed using Rosetta Resolver 7.2 (Rosetta Biosoftware). The raw micro-array data have been deposited in the NCBI GEO database as part of a larger experiment directed at studying disease progres-sion accepted as project GSE44226. Gene expresprogres-sion values were obtained from the control sample channels (two Cy3, two Cy5) using the limma package for R/Bio-conductor [6]. Raw data were background-corrected, after which the channels containing infection sample were replaced by the control sample from the same array, resulting in two identical data sets per array. These data were loess and quantile normalized within and between arrays, respectively [7].
Transcriptome sequencing
sequencing data sets have also been deposited in the NCBI GEO database as a reference series GSE44352. The Perl and R scripts used in the data analysis are avail-able on http://ms-utils.org/zebrafish.
Proteomics
Zebrafish larvae were ground with a pestle in liquid ni-trogen in 1.5 mL Eppendorf tubes and vortexed for 30 seconds in a lysis buffer consisting of 9 parts 20 mM Tris–HCl, pH 8.5, 20 mM NaCl and 1 part protease in-hibitor cocktail (P 8340, Sigma-Aldrich). The samples were placed on a shaking table for 20 minutes at room temperature before spinning down cellular debris at 16,100 ×g for 10 minutes at 4°C. The supernatant was transferred to a fresh tube and the supernatants as well as the remaining pellets frozen in −35°C. Five μL NuPAGE® LSD Sample Buffer (Invitrogen) was added to 20μL, 20 μg protein, as measured by the bicinchoninic acid (BCA) protein assay (ThermoScientific), and loaded in each lane on a 10-lane 4-12% NuPAGE® Bis-Tris gel. The assembled Invitrogen XCell SureLock™ Mini-Cell was filled with SDS-MOPS Running Buffer and the sep-aration run for 1 hour at 200 V. The gel was released from its casing and immersed in NuPAGE® SureStain Colloidal Blue (55 mL deionized water, 20 mL methanol, 20 mL“Stain A”and 5 mL“Stain B”) and left on a shaker overnight at room temperature. The staining solution was decanted and the gels were washed with deionized water before being scanned in an OptiGo UV imager (Isogen Life Science, De Meern, the Netherlands).
The gel lanes were cut into 48 identical slices fractions using a custom-made OneTouch Mount and Lane Picker (The Gel Company, San Francisco, CA). The gel slices were then removed with a Acu-Min® stainless steel Preci-sion Probe with a 35° Single Bend Tip (#6) (Moody Tools Inc., Warwick, RI) and each slice placed into one well in a 96-well polypropylene PCR plate (Greiner Bio-One, Frickenhausen Germany). Using 50 and 250 μL Rainin 8-channel multi-pipettors, each gel slice was washed for
5 minutes at room temperature with 100 μL 25 mM
ammonium bicarbonate (ABC), followed by a wash with 100 μL 30% acetonitrile in 25 mM ABC for 10 minutes and a final wash of 100 μL 80% acetonitrile in 25 mM ABC for 10 minutes, discarding the solution between each wash. Cystines were reduced by addition of 75μL 10 mM DTT in 25 mM ABC and the plate incubated at 56°C for 20 minutes. After discarding the DTT solution, cysteines were alkylated by addition of 75μL 55 mM iodoacetamide in 25 mM ABC with incubation at room temperature in darkness for 20 minutes. The gel pieces were washed again as above and the supernatant discarded. The proteins were digested in-gel by addition of 15μL 5 ng/μL porcine tryp-sin (Promega, Madison, WI) and incubation for 6 hours at 37°C, after which the digestion was quenched with the
addition of 1μL 5% trifluoroacetic acid (TFA). The solu-tion was removed, followed by a second extracsolu-tion with 20μL 0.1% TFA for 1 h and the solution pooled with the first extraction. The plate was stored at −35°C until ana-lysis by LC-MS/MS.
All SDS-PAGE fractions were analyzed by LC-MS/MS using a splitless NanoLC-Ultra 2D plus (Eksigent, Dublin, CA) for parallel ultra-high pressure liquid chromatography (UHPLC) with an additional loading pump for fast sam-ple loading and desalting. The UHPLC system was config-ured with 300 μm-i.d. 5-mm PepMap C18 trap columns (Thermo Scientific, Sunnyvale, CA), 15-cm 300 μm-i.d. ChromXP C18 columns supplied by Eksigent and running 90-minute linear gradients from 4 to 33% acetonitrile in 0.05% formic acid. The UHPLC system was coupled on-line to an HCTultra PTM Discovery System ion trap (Bruker Daltonics, Bremen, Germany). After each MS scan, up to ten abundant multiply charged species in m/z 300–1300 were automatically selected for MS/MS but excluded for one minute after being selected twice. The UHPLC system was controlled using the HyStar3.4 with a plug-in from Eksigent and the HCTultra ion trap by esquireControl 6.2, all from Bruker.
Peptides and proteins were identified using Mascot 2.4 running on an 8-CPU in-house server and theDanio rerio UniProt database (20130814) and validated using Peptide-Prophet and ProteinPeptide-Prophet in the Trans-Proteomic Pipeline [8]. In the Mascot search, a peptide mass meas-urement tolerance of [−0.5, 2.5] Da was used with MS/MS mass measurement tolerance [−0.5, 0.5] Da and allowing one missed cleavage. Carbamidylation of cysteine was included as the only fixed modication and oxidation of methionine as the only variable modification. Protein names from UniProt were matched against the microarray transcript (gene) names, expanding each protein group to individual proteins to match as many genes as possible, bearing in mind that not all of these proteins or protein isoforms are independently quantified.
Results and discussion
Data collection
datasets have been submitted to the NCBI GEO data-base (accession number GSE44226). For protein analysis, proteins were separated on PAGE. From the SDS-PAGE and LC-MS/MS, 1,694 proteins could be identi-fied with a ProteinProphet minimum probability of 0.95
and a global false-discovery rate of 1%. Over half (1,224) of these proteins were supported by more than one unique peptide identification. The number of spectra matching peptides from a particular protein was used as a simple metric of the abundance of that protein, a
LC-MS
RNA-seq
Microarray
32312 genes 26152 protein-coding genes
51569 transcripts 40311 proteins 14343 GO-annotated genes
Total: 24522 detected genes
Raw data
Mapped
Genes
Cross-referencing
Detected
genes
Reference
1694 proteins 19093
genes/transcripts 23608 genes
20796 spectra 11327815 reads 69061 probes Uniprot/
TrEMBL
ENSEMBL genes/transcripts Zv9 genome
614667 spectra 15871062 reads 175974 probes
Microarray
RNA-seq
33
7008 164
963
17267
847 16
LC-MS
[image:4.595.58.538.164.665.2]Microarray
RNA-seq
procedure known as spectral counting [12]. In the ac-cepted protein identifications, this number ranged from 1 to 7,444, with 627 proteins identified by 10 or more spec-tra. The raw data and Mascot results files are available in PRIDE [13] XML (accession number PXD000145).
Data analysis
In Figure 1 we show a schematic overview of the analysis pipeline, and numbers of genes/proteins detected by each technology. With each technology, raw data are mapped to a suitable reference. In case of LC-MS/MS, the raw data correspond to 20,796 confidently identified spectra (FDR = 1%) mapped to 1,694 zebrafish proteins. With RNA-seq, 11.3 million out of 15.9 million reads aligned to 25,255 distinct loci on the Zv9 genome. How-ever, for 1,647 genes, the alignments did not overlap with annotated exons (many of these are non-protein coding genes), leaving 23,608 genes with quantified ex-pression. Finally, using a microarray, 69,061 probes of 175,974 were annotated with a known Ensembl gene or transcript. As multiple probes can assay expression for the same gene locus, the number of annotated genes for which an expression measure was obtained is reduced to 19,212. 119 of these are non-protein coding, leaving 19,093 genes for comparison with other technology.
Only in the quantification of RNA-seq, direct use is made of Ensembl information. To make comparisons across technologies possible, the protein and array anno-tations need to be translated to Ensembl genes. This was done using current Ensembl annotations downloaded through Biomart.
The Venn diagram in the bottom part of Figure 1 shows the overlaps amongst the genes detected by the different technologies. In total, 24,522 genes were de-tected by at least one technology. 963 were dede-tected by all three technologies. The protein identifiers associated with 91 LC-MS/MS spectra were not included in the current Ensembl annotations.
Comparison of analysis technologies
Of each category shown in 7 colours in the Venn dia-gram of Figure 1 we have compared the detection levels in the boxplots in Figure 2. The total overlap of the an-notated genes detected using all three technologies is shown in white. In general, these genes detected using
RNA-seq
mRNA abundance
(log2 RPKM) 10 5 0 -5 LC-MS RNA-seq microarray
n = 963 genes
LC-MS RNA-seq
n = 164 genes
RNA-seq microarray
n = 17267 genes
RNA-seq
n = 7008 genes
Microarray
LC-MS RNA-seq microarray n = 963 genes
LC-MS microarray n = 16 genes
RNA-seq microarray n = 17267 genes
microarray
n = 847 genes
microarray (no gene id) n = 7431 probes
microarray (non-coding)
n = 119 genes
mRNA abundance
(log2 mean probe signal)
18 8 6 4 16 14 12 10 LC-MS protein abundance
(log2 total independent spectra)
10 8 6 4 2 0 LC-MS RNA-seq microarray
n = 963 genes
LC-MS RNA-seq
n = 164 genes
LC-MS microarray
n = 16 genes
LC-MS
n = 33 genes
LC-MS (no gene id)
n = 90 spectra
[image:5.595.57.292.86.690.2]12 14
all technologies (Figure 2, first columns) have higher protein/mRNA abundance than genes detected using only a single technology (Figure 2, columns 4-6). For LC-MS/MS and microarray, the last one and two col-umns, respectively, summarize signals that cannot be linked to Ensembl gene IDs. In the used custom micro-array a majority of these probes were designed for exons that were either dubious or possibly linked to differential splicing. Future reannotation of the zebrafish genome will undoubtedly lead to removal of many of these probes from the design and therefore these were not an-alyzed further. It is of interest to note that the non-common overlap between the proteomics data is larger with the RNA-seq data (164 annotations in yellow) than with microarrays (16 annotations in pink), even though the expression levels are in the same range. This result emphasizes the advantage of an unbiased deep sequen-cing approach over a biased microarray approach in transcriptome analyses. We mostly focused on the overlapping set of 963 genes detected by all three
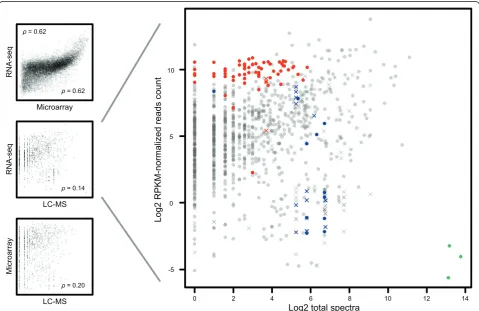
[image:6.595.58.538.352.663.2]technologies. As shown in Figure 3, microarrays and RNA-seq levels exhibit relatively high correspondence (Spearman’s correlation coefficient 0.62), but with a no-ticeable bias at high signal strengths. Correlation be-tween the transcriptomic technologies and proteomics is less obvious, e.g. 0.14 for the RNA-seqvsMS. However, when we zoom in on the mRNA abundance assayed by mRNA-seq versus protein abundance in Figure 3B we can see that many genes that do not correlate in expres-sion levels belong to three well known gene categories: ribosomal (red, GO cellular component ribosome), his-tones (blue, based on gene descriptions) and vitellogen-ins (green, based on gene descriptions). Based on the predicted functions of these groups of genes we can ex-plain why there are such distinct differences at the tran-scription and proteome levels. Most obviously, the vitellogenins are maternally expressed proteins of which the genes are transcribed in the female liver and not in the embryos [14]. The vitellogenins are transported from the liver to the gonad and deposited in the eggs. Since
the proteins are expected to be very stable in the embryo, a much higher level of the protein than the mRNAs is expected at 5 days post fertilization. The much higher level of ribosomal protein transcripts than protein levels can be explained because several of these also have a function as untranslated RNAs. Histones mRNAs are generally not polyadenylated, and therefore will be underrepresented in the RNA-seq data, because polyadenylated mRNA was captured using poly-dT primers prior to random-primed cDNA synthesis. In addition, histones are DNA-binding proteins with many positively charged amino acids, ionizing and fragmenting well in positive-mode electrospray-tandem mass spec-trometry. Leaving out mappings to multiple genes in-creases the Spearman’s correlation between RNA-seq and MS data to 0.26, and by additionally leaving out the three identified and explained special cases it increases to 0.30.
Conclusions
By comparing state of the art transcriptomic and proteomic technologies on samples derived from the same group of zebrafish embryos, we have for the first time benchmarked the differences in these tech-nologies with regard to sensitivity and bias towards detection of particular gene categories in zebrafish. Our pipeline approach can be used by other groups to get a rapid insight into results obtained from dif-ferent technology platforms. The results show that comparison of levels of RNA deep sequencing and proteomics have surprisingly high correlation if one considers the extreme differences between regulatory mechanisms at the level of transcription and transla-tion. For such comparisons it does not seem neces-sary to include microarray analysis, which by its biased character was contributing little to the overall comparison. We can therefore conclude that the RNA sequencing and LC-MS/MS protein technologies used are extremely robust and can be used for more de-tailed analysis of the difference between the transcrip-tome and proteome levels. By focusing on the outliers in correlation plots, we can pinpoint translational and posttranslational regulatory mechanisms that underlie the observed differences for further study. The data-sets that we have submitted to the public databases are a good starting point for other researchers that are interested in disease progression in zebrafish at a stage of development that is highly suited for read out using high throughput optical and genomics tech-nologies [9,11,15]. We are currently using this ap-proach to expand our datasets to a much deeper level at the proteomic level and to also include various zebrafish models for disease, including infectious dis-ease and cancer.
Competing interests
The authors declare that they have no competing interests.
Authors' contributions
HPS and MP initiated the study. RPD prepared all samples. MP and AD performed the proteomics analyses and CVH compared the proteome and transcriptome data. HPS, AHM and AD provided materials and resources for this study. All authors contributed to writing the manuscripts, read and approved the final manuscript.
Acknowledgements
Support was obtained from the EU project ZF-Health (FP7-Health-2009-242048; AHM and HPS) and NWO VIDI grant 917.11.398 (MP). We thank Wouter Veneman (IBL, Leiden University) for advice on RNA-seq data submission and Hans Dalebout for technical assistance.
The mass spectrometry proteomics data have been deposited to the ProteomeXchange Consortium (http://proteomecentral.proteomexchange. org) via the PRIDE partner repository [13] with the dataset identifier PXD000145 and DOI 10.6019/PXD000145.
The RNA-Seq and microarray data has been deposited in Gene Expression Omnibus (GEO, http://www.ncbi.nlm.nih.gov/geo/) with the dataset identifiers GSE44352 and GSE44226 respectively.
Author details
1Center for Proteomics and Metabolomics, Leiden University Medical Center,
P.O. Box 9600, Zone L04-Q, 2300 RC, Leiden, The Netherlands.2ZF-screens B. V., J.H. Oortweg 19, 2333 CH, Leiden, The Netherlands.3Institute of Biology,
Leiden University, Einsteinweg 55, 2333 CC, Leiden, The Netherlands.
Received: 28 February 2013 Accepted: 15 October 2013 Published: 24 October 2013
References
1. Kogenaru S, Qing Y, Guo Y, Wang N:RNA-seq and microarray complement each other in transcriptome profiling.BMC Genomics2012, 13:629.
2. Parker CE, Pearson TW, Anderson NL, Borchers CH:Mass-spectrometry-based clinical proteomics–a review and prospective.Analyst2010,
135(8):1830–1838.
3. Palmblad M, van der Burgt YEM, Mostovenko E, Dalebout H, Deelder AM: A novel mass spectrometry cluster for high-throughput quantitative proteomics.J Am Soc Mass Spectrom2010,21(6):1002–1011.
4. Weisser H, Nahnsen S, Grossmann J, Nilse L, Quandt A, Brauer H, Sturm M, Kenar E, Kohlbacher O, Aebersold R,et al:An automated pipeline for high-throughput label-free quantitative proteomics.J Proteome Res2013, 12(4):1628–1644.
5. Ali S, Champagne DL, Spaink HP, Richardson MK:Zebrafish embryos and larvae: a new generation of disease models and drug screens.Birth Defects Res C Embryo Today2011,93(2):115–133.
6. Smyth GK:Limma: linear models for microarray data. InBioinformatics and Computational Biology Solutions using R and Bioconductor.Edited by Gentleman R, Carey V, Dudoit S, Irizarry R, Huber W. New York: Springer; 2005:397–420.
7. Smyth GK, Yang YH, Speed T:Statistical issues in cDNA microarray data analysis.Methods Mol Biol2003,224:111–136.
8. Keller A, Eng J, Zhang N, Li XJ, Aebersold R:A uniform proteomics MS/MS analysis platform utilizing open XML file formats.Mol Syst Biol2005, 1:0017.
9. Carvalho R, de Sonneville J, Stockhammer OW, Savage ND, Veneman WJ, Ottenhoff TH, Dirks RP, Meijer AH, Spaink HP:A high-throughput screen for tuberculosis progression.PLoS One2011,6(2):e16779.
10. Veneman WJ, Stockhammer OW, de Boer L, Zaat SA, Meijer AH, Spaink HP: A zebrafish high throughput screening system used for Staphylococcus epidermidis infection marker discovery.BMC Genomics2013,14(1):255. 11. Ghotra VP, He S, de Bont H, van der Ent W, Spaink HP, van de Water B,
Snaar-Jagalska BE, Danen EH:Automated whole animal bio-imaging assay for human cancer dissemination.PLoS One2012,7(2):e31281.
13. Vizcaino JA, Cote RG, Csordas A, Dianes JA, Fabregat A, Foster JM, Griss J, Alpi E, Birim M, Contell J,et al:The PRoteomics IDEntifications (PRIDE) database and associated tools: status in 2013.Nucleic Acids Res2013, 41(Database issue):1063–1069.
14. Wang H, Tan JT, Emelyanov A, Korzh V, Gong Z:Hepatic and extrahepatic expression of vitellogenin genes in the zebrafish, Danio rerio.Gene2005, 356:91–100.
15. Rotman J, van Gils W, Butler D, Spaink HP, Meijer AH:Rapid screening of innate immune gene expression in zebrafish using reverse transcription - multiplex ligation-dependent probe amplification.BMC Res Notes2011,4:196.
doi:10.1186/1756-0500-6-428
Cite this article as:Palmbladet al.:Parallel deep transcriptome and proteome analysis of zebrafish larvae.BMC Research Notes20136:428.
Submit your next manuscript to BioMed Central and take full advantage of:
• Convenient online submission
• Thorough peer review
• No space constraints or color figure charges
• Immediate publication on acceptance
• Inclusion in PubMed, CAS, Scopus and Google Scholar
• Research which is freely available for redistribution