"DEVELOPMENT OF ANALYTICAL METHODS FOR THE
SIMULTANEOUS ESTIMATION OF OLMESARTAN
MEDOXOMIL AND HYDROCHLOROTHIAZIDE FROM
THEIR PHARMACEUTICAL DOSAGE FORMS"
Dissertation submitted to
The Tamil Nadu Dr. M.G.R. Medical University, Chennai
In partial fulfillment for the award of degree of
MASTER OF PHARMACY
(
Pharmaceutical Analysis)
MARCH - 2008
COLLEGE OF PHARMACY
Certificate
This is to certify that the dissertation entitled “DEVELOPMENT
OF VALIDATED ANALYTICAL METHODS FOR THE ESTIMATION
OF TOLTERODINE TARTARATE FROM TABLET DOSAGE FORM”
was carried out by Miss. BINSEY.C.BABU in the Department of
Pharmaceutical Analysis, College of pharmacy, Sri Ramakrishna
Institute of Paramedical Sciences, Coimbatore which is affiliated to The
Tamil Nadu Dr. M.G.R Medical University, Chennai, under my direct
supervision and guidance to my fullest satisfaction.
Mrs. A. Suganthi, M.Pharm.,
Assistant Professor, Department of Pharmaceutical Analysis,
College of Pharmacy, SRIPMS, Coimbatore-641 044
Place : Coimbatore
Certificate
This is to certify that the dissertation entitled “DEVELOPMENT
OF VALIDATED ANALYTICAL METHODS FOR THE ESTIMATION
OF TOLTERODINE TARTARATE FROM TABLET DOSAGE FORM”
was carried out by Miss. BINSEY.C.BABU in the Department of
Pharmaceutical Analysis, College of pharmacy , Sri Ramakrishna
Institute of Paramedical Sciences, Coimbatore which is affiliated to The
Tamil Nadu Dr. M.G.R Medical University, Chennai, under the
guidance of Mrs.A.Suganthi, M.Pharm., Asst. Professor - Department
of Pharmaceutical Analysis, College of Pharmacy, Sri Ramakrishna
Institute of Paramedical Sciences, Coimbatore
Dr. T.K Ravi, M. Pharm., Ph.D., FAGE
Principal,
Head, Department of Pharmaceutical Analysis,
College of Pharmacy, S.R.I.P.M.S,
Coimbatore- 641 044
Place : Coimbatore
ACKNOWLEDGEMENT
My dissertation entitled
“Development of Validated Analytical
Methods for the Estimation of Tolterodine tartarate in Bulk and Tablet
Dosage Form”
would not have been possible without the grace of the
Almighty God who gave me strength and wisdom to complete this project.
I am extremely grateful to my to my most esteemed guide
Mrs.A.Suganthi, M.Pharm.,
Asst Professor, Department of Pharmaceutical
Analysis for her guidance and encouragement throughout the course of my
project work.
I extol my deep gratitude to
Dr.T.K.Ravi, M.Pharm., Ph.D.,
FAGE,
Principal, College of Pharmacy, SRIPMS, Coimbatore for his
inspiring guidance and encouragement during the tenure of my work.
I owe my special thanks to
Mrs.M.Gandhimathi
,M.Pharm.,PGDMM,
Asst Professor, Department of Pharmaceutical
Analysis for her suggestions and guidance during the course of this
analytical work.
I express my sincere thanks to
Mr .Susheel John
Varghese,M.Pharm.,
Lecturer, Department of Pharmaceutical Analysis for
his help and co-operation during the tenure of my work.
I take this opportunity to thank all my teachers who lit the light
of knowledge and wisdom in my life.
I am thankful to
Mrs.Kalaivani
and
Mrs.Geetha
for their kind
co-operation during this project work.
I owe my sincere thanks to the library staffs of SRIPMS for
providing library facilities during the course of my work.
My respectful regards to our beloved Managing Trustee
Sevaratna Dr. R.Venkatesalu Naidu
for providing me the adequate
facilities in this institution to carry out this dissertation work.
My sincere thanks to
M/s. Saraswathy Computers
for their
help in bringing this manuscript out in a neatly typed manner.
I also owe my heartfelt thanks to my prayer group members
Mintu, Simi, Meppil, Merlin, Gigi, Nancy, Sini, Aishwarya, Rekachechi,
Bency
for their prayer support.
I am ever grateful to my best friend
Ajan
for advising and
supporting me at all times.
Above all I dedicate myself before the constant love and
encouragement given to me by my
Beloved Parents, sister Blesy and
brother Sam,
who have been the backbone of all my achievements and
deserve the credit of success in whatever I do.
CONTENTS
S.No Topics
Page
No.
I
Introduction
1 - 7
II Literature
Review
8
III
Aim and Plan of Work
9
IV Drug
Profile
10
V
Materials and Instruments used
11-12
VI
Introduction To Ultra-Violet Spectroscopy
13-19
VII
Introduction To Difference Spectroscopy
20-23
Method Development and Validation for the Estimation
of Tolterodine tartarate from Tablet Dosage Form by
Difference Spectroscopy.
24-33
VIII
Introduction To Visible Spectroscopy
34-38
Development of Validated Visible Spectrophotometric
Method for the Estimation of Tolterodine tartarate from
Tablet Dosage Form.
39-55
IX
Introduction To HPTLC
56-59
Method Development and Validation for the Estimation
of Tolterodine tartarate from the Tablet dosage form by
HPTLC.
60-78
X
Introduction To HPLC
79-85
Method Development and Validation for the Estimation
of Tolterodine tarta
rate from the Tablet dosage form by
RP-HPLC.
86-106
Abbreviations
ABBREVIATIONS
UV - Ultra violet
VIS - Visible
HPTLC - High performance thin layer
chromatography
HPLC - High performance liquid chromatography RP-HPLC - Reverse phase high performance liquid
chromatography
λmax - Maximum absorbance
nm - Nanometer
Rf - Retardation factor
HCl - Hydrochloric acid
F.C. Reagent - Folin ciocalteau Reagent
MBTH Reagent - Methyl benzothiazolinone hydrazone hydrochloride Reagent
Conc. - Concentrated
µg - Microgram
ng - Nanogram
M - Molar
mM - Millimolar
ml - Millilitre
µl - Microlitre
S.D - Standard deviation
R.S.D - Relative standard deviation
Introduction
INTRODUCTION
1-3The ability to provide timely, accurate and reliable data is central to
the role of analytical chemists and is especially true in the discovery,
development and manufacture of pharmaceuticals. Current good
manufacturing procedure (cGMP) recommends that every pharmaceutical
company have a quality control unit to approve or reject all procedures or
specifications that affect the identity, strength, quality and purity of every
drug product based on test for drug characteristics such as potency and
dissolution.
Some of the key components in quality control which have a great
impact on the quality control of the final product are:
1. Scale up
2. Raw material inspection
3. In process inspection
4. Product testing
5. Stability testing
Analytical Techniques
The following analytical techniques have been employed for
estimation of different components in formulation.
1. Titrimetric and Gravimetric method.
Introduction
4. Mass spectroscopy
5. Chromatographic methods which includes;
¾ Paper Chromatography
¾ on-exchange chromatography.
¾ High Performance Thin Layer Chromatography(HPTLC)
¾ High Performance Liquid Chromatography(HPLC).
¾ Gas Chromatography (GC).
5. Hybrid Techniques
Combination of the above chromatographic techniques produce
‘hybrid’ or ‘hyphenated’ techniques. Several examples are in popular use
today and new hybrid techniques are under development. For example
¾ GC-MS
¾ LC-MS
¾ HPLC/ ESI-MS
¾ LC-DAD
¾ CE-MS
¾ CE-UV
ANALYTICAL METHOD VALIDATION
Analytical data are used to screen potential drug candidates, aid in
development of drug synthesis, support formulation studies, monitor the
stability of bulk pharmaceuticals and formulated products, and test final
Introduction
development and validation has a direct impact on the quality of these
data.
Analytical Method Development is required for:
¾ Herbal Products
¾ New process and reactions
¾ New molecules
¾ Active Ingredients(Macro analysis)
¾ Residues(Micro analysis)
¾ Impurity Profiling
¾ Component of interest in different matrices.
Analytical Methodology provides to an analyst:
¾ The required data for a given analytical problem.
¾ The required sensitivity.
¾ The required accuracy.
¾ The required range of analysis.
¾ The required precision.
Method Validation is the process of proving that an analytical method is
acceptable for its intended purpose. Method Validation is a continuous
process. The goal is to ensure confidence in the analytical data throughout
product development. The steps involved in method development and
method validation are:
Introduction
Method development plan definition
↓
Background information gathering
↓
Laboratory method development
↓
Generation of Test Procedure
↓
Method Validation Protocol definition
↓
Laboratory Method Validation
↓
Validated test method generation
↓
Validation Report
A well developed method should be easy to validate. A method
should be developed with the goal to rapidly test preclinical samples,
formulation prototypes, and commercial samples. For validation, the
developed method is subjected to the following studies.
1. Specificity
It is the ability of the method to accurately measure the analyte
response in the presence of all potential sample components. The
response of the analyte in test mixtures containing the analyte and all
Introduction
intermediates, excipients, degradation products, process impurities etc.) is
compared with the response of a solution containing only the analyte.
2. Linearity
A linearity study verifies that the sample solutions are in a
concentration range where the analyte response is linearly proportional to
concentration. Acceptability of linearity data is often judged by examining
the correlation coefficient and y-intercept of the linear regression line for
the response versus concentration plot.
3. Range
The range of an analytical method is the concentration over which
acceptable accuracy, linearity, and precision are obtained. In practice, the
range is determined using data from the linearity and accuracy studies.
4. Accuracy
The accuracy of a method is the closeness of the measured value
to the true value for the sample. Accuracy is usually determined in four
ways:
♦ It can be assessed by analyzing a sample of known concentration
and comparing the measured value to the true value.
♦ The second approach is to compare test results from the new
method with the results from an existing alternate method that is
Introduction
♦ The third approach, which is the most widely used recovery study,
is performed by spiking analyte in blank matrices. For assay
methods, spiked samples are prepared in triplicate at three levels
over a range of 50-150% of the target concentration.
♦ The fourth approach is the technique of Standard additions, which
can also be used to determine recovery of spiked analyte.
5. Precision
The precision of an analytical method is the amount of scatter in the
results obtained from multiple analyses of a homogenous sample. It is
determined at three levels.
Repeatability
It is obtained when analysis is carried out in one laboratory by one
operator using one piece of equipment over relatively short time span for
at least 5 or 6 determinations of three different matrices at 2 or 3 different
concentrations.
Reproducibility:
It represents the precision obtained between laboratories. The
objective is to verify that the method will provide the same results in
different laboratories. It is determined by analyzing aliquots from
homogenous lots in different laboratories with different analysts with the
Introduction
6. Limit of Detection (LOD)
The detection limit is the lowest analyte concentration that produces
a response detectable above the noise level of the system, typically, three
times the noise level. S/N = 3/1
7. Limit of Quantitation (LOQ)
The quantitation limit is the lowest level of analyte that can be
accurately and precisely measured. It is calculated as the analyte
concentration that gives S/N = 10/1.
8. Robustness
The robustness of a method is its ability to remain unaffected by
small changes in parameters such as % organic content and pH of mobile
Literature Review
LITERATURE REVIEW
4-71. Shinde, D.B., et al have reported Spectrophotometric methods for
the estimation of Tolterodine tartarate in Bulk and Tablet
formulation.
2. Kumar, Y.R., et al have reported a validated chiral HPLC method
for the enantiomeric separation of Tolterodine tartarate.
3. Vinay, S., et al have reported Stability-indicating HPLC
determination of Tolterodine tartarate in pharmaceutical dosage
form.
4. Perfetto, E.M., et al has reported on Treatment of Overactive
Bladder- A Model Comparing Extended – Release Formulations of
Aim and plan of work
AIM AND PLAN OF WORK
Literature studies revealed that no method has been reported
using Difference Spectroscopy, MBTH Reagent, HPTLC and RP-HPLC
for the estimation of Tolterodine tartarate in the single dosage form.
Hence, the aim and plan of study of this work is as given below:
¾ Method Development and Validation for the Estimation of
Tolterodine tartarate from the Tablet dosage form by Difference
Spectroscopy.
¾ Development of Validated Visible Spectrophotometric Method
for the Estimation of Tolterodine tartarate from the Tablet
dosage form.
¾ Method Development and Validation for the Estimation of
Tolterodine tartarate from the Tablet dosage form by HPTLC.
¾ Method Development and Validation for the Estimation of
Drug Profile
DRUG PROFILE
8-10TOLTERODINE TARTARATE
Structure :
Molecular weight : 475.57
Molecular formula : C22H31NO. C4H6O6
IUPAC Name : 2-[(1R)-3-[Bis (1-methyl ethyl) amino]-1-
phenyl propyl]-4-methyl phenol
Description : Tolterodine tartarate occurs as a white crystalline
powder.
Solubility : Soluble in water, methanol.
pKa : 9.9
Indications : Used in the treatment of patients with Overactive
bladder with symptoms of urge incontinence,
urinary frequency. It is a competitive muscarinic
receptor antagonist which mediates urinary
bladder contraction. It increases residual urine
volume and decreases detrussor muscle
pressure.
Storage : At 25ºc
Formulation : Roliten(Tolterodine tartarate 2mg), Ranbaxy Laboratories Limited, India.
OH H
N
CH3 CH3
CH3
CH3
Materials and Instruments Used
MATERIALS AND INSTRUMENTS USED
DRUG SAMPLE
Tolterodine tartarate was obtained as a gift sample from Ranbaxy
Laboratories Limited, India.
Chemicals and solvents
¾ Methanol AR grade, HPLC grade (Qualigens Fine Chemicals,
Mumbai.)
¾ Water HPLC grade (Merck Private Limited.)
¾ MBTH, A.R. (HiMedia Laboratories Pvt.Ltd.)
¾ Cerric ammonium Sulphate (Loba Chemie)
¾ Hydrochloric Acid LR grade (sd fine chem limited, Mumbai.)
¾ Sulphuric Acid (Qualigens Fine Chemicals, Mumbai.)
¾ Sodium Hydroxide LR grade (sd fine chem limited, Mumbai.)
¾ Triethylamine AR grade (sd fine chem limited, Mumbai.)
¾ Glacial acetic acid (sd fine chem, Mumbai.)
¾ Chloroform (Qualigens Fine Chemicals, Mumbai.)
INSTRUMENTS USED
¾ Jasco V- 530 UV/VIS Spectrophotometer
¾ Camag HPTLC System ( with Linomat 5 as application device,
Materials and Instruments Used
¾ Shimadzu HPLC Class LC-10 AT VP system(Photodiode array
detector)
¾ Pall Gelman Sciences, Vacuum pump
¾ Elico Pvt. Limited, India, pH meter – LI 127
Introduction To Ultraviolet Absorption
Spectrophotometry
INTRODUCTION TO ULTRAVIOLET
ABSORPTION SPECTROPHOTOMETRY
11-12Ultraviolet Spectrophotometry is one of the most frequently
employed techniques in pharmaceutical analysis. It involves the
measurement of the amount of ultraviolet (190-380 nm) or 200-400 nm
radiation or 2000-4000 Ǻ radiation absorbed by a substance in solution.
The wavelengths in the ultraviolet region are usually expressed in
angstrom (Ǻ) units or more commonly in millimicron or nanometer;
occasionally absorption is reported in wave numbers.
Absorption of light in ultraviolet region of the electromagnetic
spectrum occurs when the energy of light matches that required to induce
in the molecule an electronic transition and its associated vibrational and
rotational transitions.
A compound or drug possess conjugated double bond, absorbs UV
radiation at a specific wavelength and this character of drug is specific for
a fixed solvent system. The drugs are quantitatively analyzed by ultraviolet
analytical method which is governed by Beer Lambert’s law, which is
represented as
A = abc
where , a = absorptivity
Introduction To Ultraviolet Absorption
Spectrophotometry
QUANTITATIVE SPECTROPHOTOMETRIC ASSAY OF MEDICINAL
SUBSTANCES
1. Use of a calibration graph
Statistical treatment of the calibration data, facilitated by micro
computers or pre programmable calculators, provides a more elegant and
accurate determination of the relationship between absorbance and
concentration than manually constructed graphs. If the absorbance values
and concentrations bear a linear relationship, the regression line y = α +
βx may be estimated by the method ofleast squares.
α =
( )
(
)
( )(
)
( )
2 2 2∑
∑
∑
∑
∑
∑
− − x x N xy x x yβ =
( )( )
∑
∑
∑
∑
∑
− − 2 2 ) ( x x N y x xy NWhere, x = concentration
y = absorbance
N = number of pairs of values
2. Single - point standardization method
The single -point procedure involves the measurement of the
absorbance of a sample solution and of a standard solution of the
reference substance. The standard and sample solutions are prepared in a
Introduction To Ultraviolet Absorption
Spectrophotometry
be close to that of the sample solution. The concentration of the substance
in the sample is calculated from the proportional relationship that exists
between absorbance and concentration.
c
test= A
testx c
stdA
stdWhere c test and c std are the concentrations in the sample and
standard solutions respectively, and A test A std are the absorbances of the
sample and standard solutions respectively. Since sample and standard
solutions are measured under identical conditions, this procedure is the
preferred method of assay of substances that obey Beer's Law and for
which a reference standard of adequate purity is available
ASSAY OF SUBSTANCES IN MULTICOMPONENT SAMPLES
The various spectroscopic techniques used for multi-component
analysis are as follows
# Simultaneous equation method (Vierodt’s method)
# Absorbance ratio method
# Geometric correction method
# Absorption factor method (absorption correction method)
# Orthogonal polynomial method
# Difference spectrophotometry
Introduction To Ultraviolet Absorption
Spectrophotometry
Simultaneous equation method
If a sample contains two absorbing drugs (X and Y) each of which
absorbs at the λmax of the other, it may be possible to determine both
drugs by the technique of simultaneous equation (Vierodt’s method).
The information required is
a) The absorptivities of X at λ1 and λ2 , ax1 and ax2, respectively.
b) The absorptivities of Y at λ1 and λ2 , ay1 and ay2, respectively.
c) The absorbances of the diluted sample at λ1 and λ2 , A1 and A2,
respectively.
Let Cx and Cy be the concentration of X and Y respectively in the
diluted sample.
Two equations are constructed based upon the fact that at λ1 and
λ2, the absorbance of the mixture is the sum of the individual absorbance
of X and Y.
At λ1 A1 = ax1bcx + ay1bcy
At λ2 A2 = ax2bcx + ay2bcy
Cx =
2 1 1 2 2 1 1 2 y x y x y y a a a a a A a A − −
Cy =
2 1 1 2 1 2 1 1 y x y x x x a a a a a A a A − −
Using the above equations, concentration of individual component
Introduction To Ultraviolet Absorption
Spectrophotometry
Absorbance ratio method
The absorbance ratio method is a modification of the simultaneous
equation procedure. It depends on the property that, for a substance which
obeys Beer law at all wavelengths, the ratio of absorbances at any two
wavelengths is a constant value independent of concentration or path
length. Two different dilutions of the same substance which gives the
same absorbance ratio is referred to as Q value.
In the quantitative assay of two components in admixture by the
absorbance ratio method, absorbance are measured at two wavelengths,
one being the λmax of one of the components and the other being a
wavelength of equal absorptivity of the two components, i.e. an
iso-absorptive point.
Geometric correction method:
This method reduces or eliminates the background irrelevant
absorption that may be present in samples of biological origin. This is
applied if the irrelevant absorption is linear at the three wavelengths
selected.
Consider an absorption spectrum comprising the spectrum of an
analyte and that of the background absorption. If the wavelengths λ1, λ2
and λ3 are selected so that the background absorbances B1, B2 and B3 are
linear, then the corrected absorbance, D of the drug may be calculated
Introduction To Ultraviolet Absorption
Spectrophotometry
and λ3. Vitamin A is assayed by this method.
D = y (A2-A3)+z(A2-A1)
(y+z) (1-r)
Orthogonal polynomial method:
This technique is another mathematical correction procedure which
involves more complex calculations than the three-point correction
procedure. The basis of the method is that an absorption spectrum may be
represented in terms of orthogonal functions as follows:
A (λ) = p0P0 (λ) + p1P1 (λ) + p2P2 (λ)…. PnPn (λ)
where A denotes the absorbance at wavelength λ belonging to a set of
n+1 equally spaced wavelengths at which the orthogonal
polynomials,P0(λ), P1(λ), P2(λ)….Pn(λ) are each defined. These
polynomials represent a series of fundamental shapes.
The coefficients are proportional to the concentration of the
absorbing analyte, and a modified Beer-Lambert’s equation may be
constructed.
pj = αjbc
pj = the coefficient of the polynomial
αj = proportionality constant analogous to absorptivity.
The accuracy of the orthogonal functions procedure depends on the
correct choice of the polynomial order and set of the wavelengths. The set
Introduction To Ultraviolet Absorption
Spectrophotometry
the mean wavelength of the set (λm). The wavelength interval and λm are
best obtained from a convoluted absorption curve. This is a plot of the
coefficient (pj) for a specified order of polynomial, a specified number of
wavelengthsand a specified wavelength interval against the λm of the set
of wavelengths.
Derivative spectrophotometry
Derivative spectrophotometry involves the conversion of a normal
spectrum to its first, second or higher derivative spectrum. The
transformations that occur in the derivative spectra are understood by
reference to a Gaussian band, which represents an ideal absorption band.
The first derivative (D1) spectrum is a plot of the rate of change of
absorbance with wavelength against wavelength or a plot of dA/dλ. The
second derivative (D2) spectrum is a plot of the curvature of the D°
spectrum against wavelength or a plot of d2/dλ2 vs λ.
These spectral transformations confer two principal advantages on
derivative spectrophotometry.
a) Derivative spectrum shows better resolution of overlapping bands
than the fundamental spectrum and may permit the accurate
determination of the λmax of the individual bands.
b) Derivative spectrophotometry discriminates in favour of substances
Introduction To Difference Spectroscopy
INTRODUCTION TO DIFFERENCE
SPECTROSCOPY
11-15Difference Spectroscopy, provides a sensitive method for
detecting small changes in the environment of a chromophore, or it can
be used to demonstrate ionization of a chromophore leading to the
identification and quantification of various components in a mixture. In
difference spectroscopy, absorption spectra of two samples of slightly
different composition or physical state are compared.
In difference spectroscopy, a double-beam instrument is used to
measure the difference in absorbance between the two samples.
Instead of a blank solution, one of the two solutions is placed in the
path of the reference beam of the spectrophotometer. The other
solution is placed in the usual position in the path of the sample beam.
The instrument measures the difference in absorbance between the
two samples. Difference spectrophotometry is particularly useful for
measuring small differences between two, nearly identical solutions.
Difference spectra are particularly useful for determining qualitative
differences between two solutions.
The selectivity and accuracy of spectrophotometric analysis of
samples containing absorbing interferents may be markedly improved
by the technique of difference spectrophotometry. The essential feature
Introduction To Difference Spectroscopy
the difference absorbance (∆A) between two equimolar solutions of the
analyte in different chemical forms which exhibit different spectral
characteristics.
The criteria for applying difference spectrophotometry to the
assay of a substance in the presence of other absorbing substances
are that:
¾ Reproducible changes may be induced in the spectrum of the
analyte by the addition of one or more reagents.
¾ The absorbance of the interfering substances is not altered by
the reagents.
The simplest and most commonly employed technique for
altering the spectral properties of the analyte is the adjustment of the
pH by means of aqueous solutions of acid, alkali or buffers. The
ultraviolet-visible absorption spectra of many substances containing
ionisable functional groups, e.g., phenols, aromatic carboxylic acids
and amines are dependent on the pH of the solution. The difference
absorption spectrum is generated automatically using a double beam
recording spectrophotometer.
The measured value in a quantitative difference
spectrophotometric assay is the ∆A at any suitable wavelength
measured to the baseline.
Introduction To Difference Spectroscopy
where, Aalk and Aacid are the individual absorbances at
wavelength in different medium.
If Aalk and Aacid are proportional to the concentration of the
analyte and pathlength, the ∆A obeys Beer-Lambert law and a modified
equation may be derived.
∆A = ∆abc
where, ∆a = difference absorptivity of the substance at the wavelength
of measurement.
If one or more other absorbing substances are present in the
sample which at the analytical wavelength has identical absorbance
(Ax) in the alkaline and acidic solutions, its interference in the
spectrophotometric measurement is eliminated.
∆A = (Aalk + Ax) - (Aacid - Ax)
= Aalk - Aacid
The selectivity of the ∆A procedure depends on the correct
choice of the pH values to induce the spectral change of the analyte
without altering the absorbance of the interfering components of the
sample. The use of alkali and analyte to induce the ∆A of the analyte is
convenient and satisfactory when the irrelevant absorption arises from
pH-insensitive substances.
The selection of two buffers, one at a pH two units greater than,
Introduction To Difference Spectroscopy
that the analyte is 99% in the ionized state and that the ∆A is most
maximal.
A substance whose spectrum is unaffected by changes of pH
may be determined by a difference spectrophotometric procedure if it
can be quantitatively converted by means of a suitable reagent to a
chemical species that has different spectral properties to its unreacted
parent substance.
The ∆A between equimolar solutions of the unreacted substance
and its derivative is free of interference if the irrelevant absorption is
unaffected by the reagent
Applications
1. Difference spectroscopy is utilized in toxicology laboratories for
analysis of dangerous drugs.
2. It is used to study the conformation of globular proteins in
solution.
3. The difference spectrum gives the information which has been
obtained using solvent perturbation, pH difference, temperature
Experimental section
METHOD DEVELOPMENT AND VALIDATION FOR THE ESTIMATION OF TOLTERODINE TARTARATE FROM TABLET
DOSAGE FORM BY DIFFERENCE SPECTROSCOPY
METHOD DEVELOPMENT
1. Selection of Solvent and Wavelength
From the literature studies, solubility studies, it was found that
Tolterodine tartarate was soluble in water and the drug showed good
stability in this solvent. The drug was dissolved in water and the
absorbance and spectral pattern was noted. Tolterodine tartarate showed
a λmax of 282 nm in water. The absorption spectrum is shown in Fig. 1.
Fig.1 : Absorption spectrum of Tolterodine tartarate in water
2. Preparation of stock solution
10 mg of Tolterodine tartarate was weighed and transferred
into a 100 ml standard flask, dissolved in water and made upto
Experimental section
3. Difference Spectroscopy
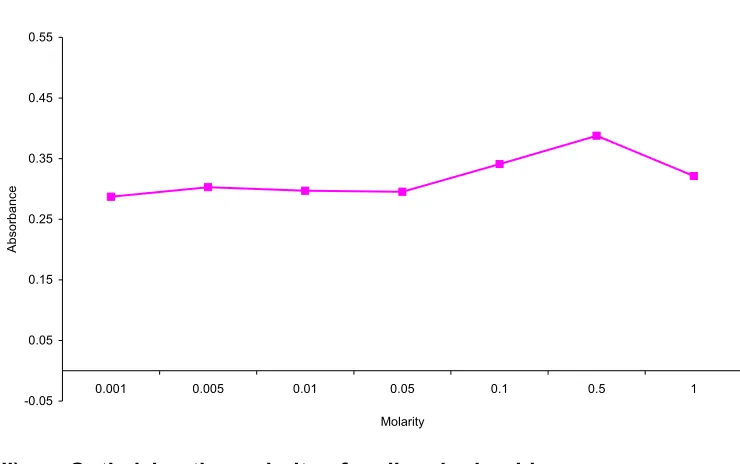
i) Optimizing the molarity of hydrochloric acid
Stock solution of 5.0 ml was pipetted into a series of 10 ml standard
flasks .To this, different molarities of hydrochloric acid such as 1M, 0.5M,
0.1M, 0.05M, 0.01M, 0.005M, 0.001M were added and made upto volume
with the same to produce solutions of concentration 50 µg/ml. The
absorbance and spectral pattern were noted and the absorbance was
found to be the highest for 0.5M HCl. (Table :1 and Fig. 2)
Table 1: Fixing the Molarity of Hydrochloric acid
Concentration
(µg/ml) Molarity Absorbance
0.001M 0.2870
0.005M 0.3029
0.01M 0.2971
0.05M 0.2954
0.1M 0.3410
0.5M* 0.3877
50
1M 0.3213
Experimental section
Fig. 2 : Optimizing the molarity of hydrochloric acid
-0.05 0.05 0.15 0.25 0.35 0.45 0.55
0.001 0.005 0.01 0.05 0.1 0.5 1
Molarity
Ab
so
rb
a
nce
ii) Optimizing the molarity of sodium hydroxide
Stock solution of 5.0 ml was pipetted into a series of 10 ml standard
flasks. To this, different molarities of Sodium hydroxide such as 1M, 0.5M,
0.1M, 0.05M, 0.01M, 0.005M, 0.001M were added and made upto volume
with the same to produce solutions of concentration 50 µg/ml. The
absorbance and spectral pattern were noted and the absorbance was
Experimental section
Table 2 : Fixing the Molarity of Sodium hydroxide
Concentration
(µg/ml) Molarity Absorbance
0.001M 0.0848
0.005M 0.3400
0.01M 0.4038
0.05M 0.4532
0.1M 0.4704
0.5M* 0.4795
50
1M 0.4780
* Selected parameter
Fig. 3 : Optimizing the molarity of sodium hydroxide
-0.05 0.05 0.15 0.25 0.35 0.45 0.55
0.001 0.005 0.01 0.05 0.1 0.5 1
Molarity
A
b
so
rb
anc
[image:34.612.132.524.427.729.2]Experimental section
iii) Obtaining the Difference Spectra
The difference spectra of equimolar solutions (0.5 M) of Tolterodine
tartarate, an urogenital antispasmodic agent, in both HCl and NaOH were
[image:35.612.127.520.240.443.2]taken and are shown in Fig. 4.
Fig. 4 : Difference spectra
The use of this concentration to induce the ∆A of the analyte was
convenient and satisfactory. Hence, this molarity was chosen for the
proposed study.
iv) Preparation of Calibration Graph
Aliquots of stock solution (100 µg/ml) of the drug ranging from 1 to 9
ml were transferred to two sets of a series of 10 ml volumetric flasks. One
set of the stock solution was diluted with 0.5M HCl to volume and the
second set was diluted with 0.5M NaOH to volume. Difference spectrum
Experimental section
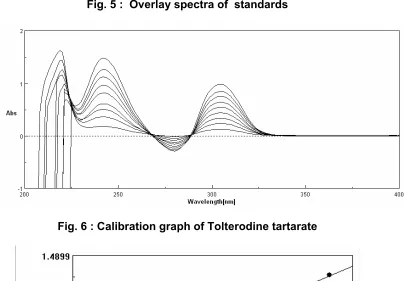
solution in the reference and sample cell respectively. The overlay spectra
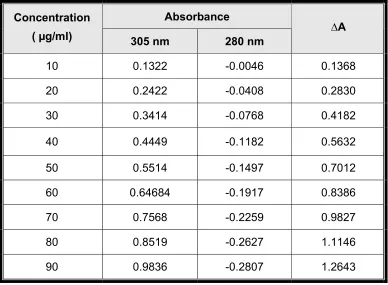
of standards are shown in Fig. 5. Difference of absorbance at two different
wavelengths - 280 nm and 305 nm was calculated. (Table : 3). The
difference in absorbance (∆A) was plotted versus concentration (10-90
µg/ml), calibration curve was constructed, and the slope, intercept and
[image:36.612.121.509.302.587.2]regression equation was calculated. (Fig. 6)
Table 3 : Difference in absorbance values of Tolterodine tartarate
Absorbance Concentration
( µg/ml) 305 nm 280 nm ∆A
10 0.1322 -0.0046 0.1368
20 0.2422 -0.0408 0.2830
30 0.3414 -0.0768 0.4182
40 0.4449 -0.1182 0.5632
50 0.5514 -0.1497 0.7012
60 0.64684 -0.1917 0.8386
70 0.7568 -0.2259 0.9827
80 0.8519 -0.2627 1.1146
Experimental section
Fig. 5 : Overlay spectra of standards
Fig. 6 : Calibration graph of Tolterodine tartarate
iv) Estimation of Formulation
Twenty tablets (Roliten 2mg, Ranbaxy Laboratories Limited., India)
were weighed and the average weight was determined. The powder
equivalent to 10 mg was transferred to a 100 ml standard flask and
extracted with distilled water by shaking for one hour. The solution was
Experimental section
alkaline solutions of concentrations 30, 40, 50 µg/ml were prepared. The
difference spectras of the appropriately diluted acidic and alkaline
solutions were recorded. The amount of Tolterodine tartarate present in
the sample solution was computed from the calibration graph. (Table : 4).
Table 4 : Analysis of Formulation
Amount (mg/tablet) Formulation
Labeled Found
% Label claim* ± S.D.
Roliten 2 1.97 98.3 ± 0.69
* Mean of six determinations
METHOD VALIDATION
i) Specificity
The developed method was found to be highly specific as there
were no interferences with the excipients in the formulation.
ii) Linearity and range
The developed method showed good linear relationship in the
concentration range 10-90 µg/ml and the slope, intercept and correlation
coefficient was found to be 0.0140, -0.0004 and 0.9999 respectively. Molar
absorptivity and Sandell’s sensitivity was found to be 5392.01 l/mole/cm
Experimental section
iii) Accuracy
The accuracy of the method was determined through recovery
studies. To 10 mg equivalent of Tolterodine tartarate, the standard drug of
Tolterodine tartarate was added at 100% level. The recovery procedure
was repeated 6 times and the %recovery and %RSD was calculated
(Table : 5) using the formula:
% recovery = b-a/ c × 100
Where, a = amount of drug found before addition of standard drug.
b = amount of drug found after addition of standard drug.
c = amount of standard drug added.
Table : 5 Recovery Studies
Drug % Recovery* %RSD
Tolterodine
tartarate 102.13 0.94
Experimental section
Results and Discussion
A simple, precise and rapid difference spectroscopic method was
developed for the estimation of Tolterodine tartarate from its tablet dosage
form. This method was based on the technique of altering the spectral
properties of the analyte by adjusting the pH by means of 0.5M HCl and
0.5M NaOH. There were no interferences found with the excipients in the
formulation. The content of Tolterodine tartarate was found to be 1.97
mg/tab. The %recovery was found to be 102.13% ± 0.94 at 100% level
which indicated the accuracy and reliability of the method. Hence, the
developed method can be used for the routine analysis of Tolterodine
Introduction To Visible Spectroscopy
INTRODUCTION TO VISIBLE
SPECTROSCOPY
3,11-17Visible Spectrophotometry is one of the most frequently used
techniques in pharmaceutical analysis. It involves the measurement of
visible (380-800 nm) radiation by a substance in solution. The variation of
colour of a system with change in the concentration of the same
components forms the basis of colorimetric analysis. The colour is usually
due to the formation of a coloured complex by addition of the appropriate
reagent. The intensity of the colour may then be compared with that
obtained by treating a known amount of the substances in the same
manner. Colorimetry is concerned with the determination of the
concentration of a substance by the measurement of relative absorbance
of light with respect to a known concentration of the substances.
Chromophore
A chromophore is a group responsible for light absorption by a
molecule. Originally, the term chromophore was applied to the system
responsible for imparting colour to the compound. Most chromophore
therefore contains only one or more multiple bonds. For example, in azo
dyes, the aryl conjugated azo group (Ar-N=N-Ar) is clearly the principle
chromophore and in nitro compounds, the yellow colour is carried out by
Introduction To Visible Spectroscopy
The term has been retained within an extended interpretation to
simply any functional group that absorbs electromagnetic radiation,
whether or not a ‘colour’ is thereby produced. Thus, the carbonyl group is
a chromophore.
Auxochrome
An auxochrome was an earlier defined term for a group that could
enhance the colour imparting properties of a chromophore without being
itself a chromophore. Example: OR, -NH2, - NR2 etc.
When a substance does not possess suitable chromogenic
properties, it may be made to react with an absorbing species reagent and
converted to an absorbing species. Reagents like Gibbs reagent, Ehrlich’s
reagent, Folin-ciocalteu’s reagent, etc., can be used to convert the
substance to a chromogen.
Absorption spectrophotometry in the ultra violet and visible region is
considered to be one of the physical methods used for the quantitative
analysis and structural elucidation. In developing these new colorimetric
methods, the systematic investigations were performed in the following
manner.
I. Spectral characteristics of the coloured species
Absorption spectra against a solvent blank in the visible and near
Introduction To Visible Spectroscopy
determined. The proportions are chosen in such a way so that the
absorbing species between the limits of the drug in large excess and the
reagent are identified, for maximum sensitivity and greatest precision. The
wavelength region at which the two solutions shows the largest difference
in the absorbance is chosen for use in the determination, and the
subtractive absorption spectrum of the coloured species against a reagent
blank is obtained experimentally.
II. Effect of pH
The pH is more closely controlled and varied using fixed
concentration of the reagent and the drug to be determined (in the
presence of known excess of reagent). The absorbance of each solution is
measured against the reagent blank at the same pH; after following
definite time interval for complete colour development, over a relatively
narrow band of wavelength (5-10 nm) near to the wavelength of maximum
absorbance of coloured species as determined from the original
absorption spectra.
III. Effect of Reagent Concentration
The basis of most spectrophotometric methods is usually
1. A complex formation reaction
2. An oxidation-reduction process or
Introduction To Visible Spectroscopy
In each of the reaction, the absorbance of the coloured species is
measured and thus the sensitivity of the method is effected by the reagent
(or catalyst) concentration, and therefore it is important to establish the
concentration of the reagent, revised at several concentrations of the
species to be determined.
IV. Order of Addition, Rate of Colour Formation and Stability
The order in which the reagents are mixed often has a marked
effect on the colour reaction and the rate of colour development. The
absorbance produced at the optimum wavelength, pH and reagent
concentration of the species to be determined are compared for different
orders of mixing and colour development times. The plot of absorbance
versus development times with the optimum order of addition reveals that
the absorbance reaches a constant reproducible maximum value after a
relatively short development time, and then remains constant for a
considerably longer period. The stability of the colour produced is studied
further over periods of time greater than those investigated during the
colour development experiments.
V. Effect of Temperature
Many of the reactions employed, on the basis of spectrophotometric
determination are temperature dependent. The manner in which the
Introduction To Visible Spectroscopy
investigated over the range of temperature likely to be encountered in the
laboratory.
VI. Nature of Coloured Species
This method most frequently employed to investigate the reagent
and drug ratio in a coloured species which forms the basis of a new
method is determined through absorbance measurements in solution via
the mole ratio, slope ratio and continuous variation procedures. If these
methods are not suitable the nature of coloured species is predicted
through the information as given in literature.
Efforts are made to extract the coloured species from the aqueous
to organic solvents media using common polar and non-polar
water-immiscible solvents with a view to get coloured species of better
absorbance and stability reducing the interference of other associating
constituents. Solvents extraction is proposed only when there are any
positive additives.
VII. Calibration curve and optimum concentration range
A calibration curve for the determination of the drug is constructed
by measurement of the absorbance developed by known concentrations of
the constituents under optimum conditions against reagent blank. A
Experimental Section
DEVELOPMENT OF VALIDATED VISIBLE SPECTROPHOTOMETRIC METHOD FOR THE ESTIMATION OF TOLTERODINE TARTARATE
FROM TABLET DOSAGE FORM
1. Principle
Tolterodine tartarate contains a phenolic hydroxyl group which
contributed in giving a purple colored chromogen in the presence of MBTH
and cerric ammonium sulphate. This reaction is based on the oxidative
coupling of Tolterodine tartarate in the presence of Ce(IV). On oxidation
with Ce(IV), 3–methyl–2–benzothiazolinone hydrazone hydrochloride
(MBTH) loses two electrons and one proton to give an electrophilic
intermediate, which has been considered to be the active coupling
species. When this intermediate reacts with one of the nucleophilic sites of
Tolterodine tartarate by an electrophilic attack, it yields a purple colored
complex. The chromogen formed has an absorption maximum of 552 nm.
Experimental Section
Fig. 7 : UV Spectrum of Tolterodine tartarate
Experimental Section
2. Development of the Colorimetric method
a) Optimization of colorimetric parameters
¾ Fixing the molarity of hydrochloric acid for the stock solution
10 mg of Tolterodine tartarate was added into a series of 10 ml
standard flasks and was made upto volume with different molarities of
hydrochloric acid such as 0.01M, 0.1M, 0.5M, 1M HCl to get
concentrations of 1000µg/ml. The drug did not dissolve in 0.5M and 1M
HCl. The drug showed highest absorbance and good spectral pattern in
0.1M HCl. So, 0.1M HCl was selected for the preparation of the standard
stock solution (Fig. 9).
Fig.9 : Fixing the molarity of hydrochloric acid
¾ Fixing the molarity of sulphuric acid for the preparation of
cerric ammonium sulphate
0.003M Cerric ammonium sulphate was prepared by weighing
Experimental Section
Sulphuric acid such as 0.001M, 0.01M, 0.1M, 0.5M, 1M, 1.5M. Standard
Stock Solution of 0.6 ml was added into a series of 10 ml standard flasks.
To these, 2 ml of 0.2% MBTH solution and 4 ml of cerric ammonium
sulphate dissolved in different molarities of Sulphuric acid were added.
The solutions were kept aside for 30 minutes to favor complex formation
and made upto volume with distilled water. The absorbances of these
solutions were read against reagent blank (Table : 6). The solution showed
highest absorbance and good spectral pattern with 0.003M cerric
ammonium sulphate dissolved in 0.01M Sulphuric acid (Fig. 10).
Table 6 : Fixing the molarity of Sulphuric acid
Molarity of Sulphuric acid Absorbance
0.001M 0.4560
0.01M* 0.6382
0.1M 0.4505
0.5M 0.4027
1M 0.4051
1.5M 0.3279
Experimental Section
Fig.10 : Fixing the Molarity of Sulphuric acid
0 0.1 0.2 0.3 0.4 0.5 0.6 0.7 0.8 0.9
0.001 0.01 0.1 0.5 1 1.5
Molarity
Absorbance
¾ Fixing the strength of cerric ammonium sulphate
Standard Stock Solution of 0.6 ml was added into a series of 10 ml
standard flasks. To these, 2 ml of 0.2% MBTH solution and 4 ml of
different molarities of cerric ammonium sulphate such as 0.001M, 0.002M,
0.003M, 0.004M, 0.005M and 0.01M were added. The solutions were kept
aside for 30 minutes to favor complex formation and made upto volume
with distilled water. The absorbance's of these solutions were read against
reagent blank (Table : 7). The solution showed highest absorbance and
Experimental Section
Table : 7 Fixing the strength of cerric ammonium sulphate
Strength ofcerric ammonium
sulphate Absorbance
0.001M 0.4561
0.002M 0.5109
0.003M 0.6635
0.004M* 0.7935
0.005M 0.7832
0.01M 0.6382
* Selected parameter
Fig.11 : Fixing the strength of cerric ammonium sulphate
0 0.1 0.2 0.3 0.4 0.5 0.6 0.7 0.8 0.9 1
0.001 0.002 0.003 0.004 0.005 0.01
Molarity
A
b
sor
b
Experimental Section
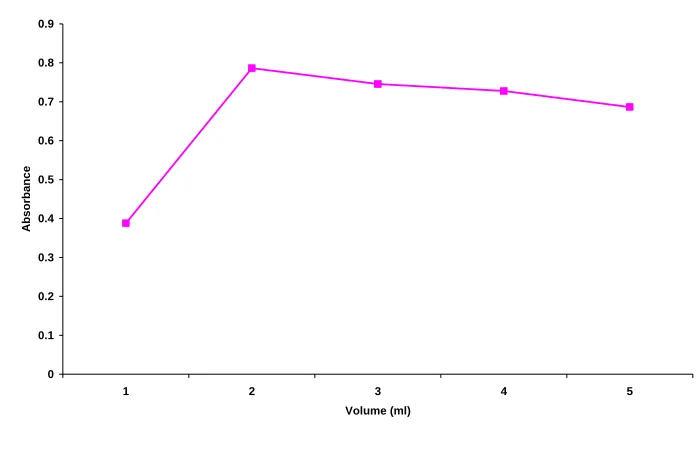
¾ Fixing the volume of cerric ammonium sulphate
Standard Stock Solution of 0.6 ml was added into a series of 10 ml
standard flasks. To these, 2 ml of 0.2% MBTH solution and different
volumes of 0.004M cerric ammonium sulphate such as 1, 2, 3, 4, 5 ml
were added. The solutions were kept aside for 30 minutes to favor
complex formation and made upto volume with distilled water. The
absorbances of these solutions were read against reagent blank
(Table : 8). The solution showed highest absorbance and good spectral
pattern with 2 ml of 0.004M cerric ammonium sulphate (Fig. 12).
Table 8 : Fixing the volume of cerric ammonium sulphate
Volume ofcerric ammonium
sulphate (ml) Absorbance
1 0.3881
2* 0.7862
3 0.7454
4 0.7275
5 0.6864
Experimental Section
Fig. 12 Fixing the volume of cerric ammonium sulphate
0 0.1 0.2 0.3 0.4 0.5 0.6 0.7 0.8 0.9
1 2 3 4 5
Volume (ml)
A
b
so
rb
a
n
ce
¾ Fixing the strength of MBTH solution
Standard Stock Solution of 0.6 ml was added into a series of
10 ml standard flasks. To these, 2 ml of different concentrations of MBTH
solutions such as 0.1%, 0.2%, 0.3%, 0.4%, 0.5% and 2 ml of 0.004M
cerric ammonium sulphate were added. The solutions were kept aside for
30 minutes to favor complex formation and made upto volume with distilled
water. The absorbances of these solutions were read against reagent
blank. The solution showed highest absorbance and good spectral pattern
Experimental Section
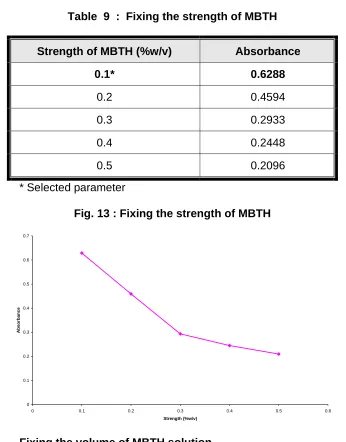
Table 9 : Fixing the strength of MBTH
Strength of MBTH (%w/v) Absorbance
0.1* 0.6288
0.2 0.4594
0.3 0.2933
0.4 0.2448
0.5 0.2096
* Selected parameter
Fig. 13 : Fixing the strength of MBTH
0 0.1 0.2 0.3 0.4 0.5 0.6 0.7
0 0.1 0.2 0.3 0.4 0.5 0.6
Strength (%w/v) A b so rb an ce
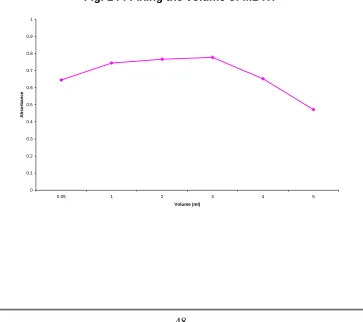
¾ Fixing the volume of MBTH solution
Standard Stock Solution of 0.6 ml was added into a series of 10 ml
standard flasks. To these, different volumes of 0.1% MBTH solution such
as 0.05, 1, 2, 3, 4, 5 ml and 2 ml of 0.004M cerric ammonium sulphate
Experimental Section
absorbances of these solutions were read against reagent blank
(Table 10). The solution showed highest absorbance and good spectral
pattern with 3 ml of 0.1% MBTH solution (Fig. 14).
Table 10 : Fixing the volume of MBTH
Volume of MBTH (ml) Absorbance
0.05 0.6449 1 0.7441 2 0.7662 3* 0.7771 4 0.6516 5 0.4718
[image:55.612.135.498.400.722.2]* Selected parameter
Fig. 14 :Fixing the volume of MBTH
0 0.1 0.2 0.3 0.4 0.5 0.6 0.7 0.8 0.9 1
0.05 1 2 3 4 5
Experimental Section
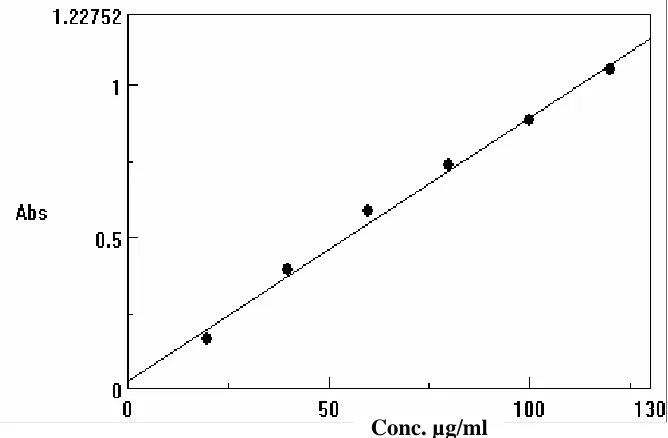
b) Preparation of standard graph
Aliquots of standard stock solution of volume 0.2, 0.4, 0.6, 0.8, 1.0,
1.2 ml were added into a series of 10 ml standard flasks. To these, 3 ml of
0.1% MBTH solution and 2 ml of 0.004M cerric ammonium sulphate was
added. The solutions were kept aside for 30 minutes to favor complex
formation and made upto volume with distilled water. The absorbances of
these solutions were noted at 552 nm against reagent blank. A standard
graph was obtained by plotting concentration of standard solutions Vs
absorbance (Fig. 15). The slope, intercept and correlation coefficient were
found to be 0.0087, 0.0279 and 0.9970 respectively. Tolterodine tartarate
showed good linear relationship in the concentration range 20-120 µg/ml
with the molar absorptivity of 4314.37 l/mole/cm and the Sandell’s
sensitivity was found to be 0.1106 µg /cm/0.001AU (Table : 11).
Table 11 : Absorbance values of Tolterodine tartarate
Concentration
(µg/ml) Absorbance at 552 nm
20 0.1654
40 0.3893
60 0.5813
80 0.7325
100 0.8831
Experimental Section
Fig. 15 : Calibration graph of Tolterodine tartarate
Analysis of Formulation
20 tablets (Roliten, Ranbaxy Laboratories Limited, India) were
weighed and the average weight was calculated. A quantity equivalent to
10 mg of Tolterodine tartarate was weighed and transferred to a 10 ml
standard flask, dissolved in 0.1M HCl and made upto volume with the
same. It was then filtered through Whatman filter paper. From this stock
solution, 0.6 and 0.8 ml were pipetted into 10 ml standard flasks. To these,
3 ml of 0.1% MBTH solution and 2 ml of 0.004M cerric ammonium
sulphate was added. The solutions were kept aside for 30 minutes to favor
complex formation and made upto volume with distilled water. The
absorbances of these solutions were noted at 552 nm against reagent
Experimental Section
blank and the amount of drug present in the formulation was calculated
(Table :12) by single-point standardization method and the equation is as
follows: ctest = Atest x cstd
Astd
Table 12 : Analysis of Formulation
Amount(mg/tablet)
Formulation Labeled Found
%Label Claim*± S.D
Roliten 2 1.97 98.5±0.32
*Mean of six determinations
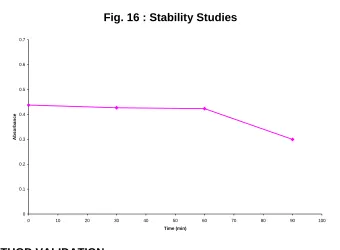
a) Stability studies
Stability studies were carried out at room temperature and the
absorbance of the chromogen was measured with respect to time (Table
13) The color was found to be stable for 1 hour (Fig. 16).
Table 13 : Stability Studies
Time(min) Absorbance
0 0.4376
30 0.4268
60 0.4232
Experimental Section
Fig. 16 : Stability Studies
0 0.1 0.2 0.3 0.4 0.5 0.6 0.7
0 10 20 30 40 50 60 70 80 90 100 Time (min)
A
b
so
rb
an
ce
METHOD VALIDATION
The developed method was validated as per ICH Guidelines in
terms of specificity, linearity, range, precision and accuracy.
i) Accuracy
Accuracy of the developed method was determined by conducting
the recovery studies. To the powder formulation equivalent to 10 mg of
Tolterodine tartarate, standard drug of Tolterodine tartarate was added at
100% level. The concentration of the drug present in the resulting
solutions was determined by the proposed method. The recovery
procedure was repeated six times and the %recovery was calculated
Experimental Section
Table 14 : Recovery Studies
Formulation %Recovery* % RSD
Roliten 98.3 0.76
*Mean of six determinations
ii) Specificity
The developed method was found to be highly specific as there
were no interferences found with the excipients used in the formulation.
iii) Precision
Precision of the method was determined by the repeatability
studies. Intra-day and inter-day assays were carried out with the method
by repeating the procedure six times and the %RSD was calculated. The
Experimental Section
Table 15 : Intra-day Precision
Drug Concentration
(µg/ml) Absorbance %RSD*
0.3893 0.3890 0.3892 0.3896 0.3899 Tolterodine
tartarate 40
0.3892
0.12
*Mean of six determinations
Table 16 : Inter-day Precision
Drug Concentration
(µg/ml) Days Absorbance %RSD*
0.3893 0.3890 0.3892 0.3896 0.3899 1st 0.3892 0.12 0.3895 0.3893 0.3891 0.3897 0.3892 Tolterodine
tartarate 40
2nd
0.3893
0.24
Experimental Section
iv) Linearity and Range
Tolterodine tartarate showed good linearity in the concentration
range of 20 – 120 µg/ml and the slope, intercept and correlation coefficient
was found to be 0.0087, 0.0279 and 0.9970 respectively. Molar
absorptivity was found to be 4314.37 l/mole/cm and Sandell’s sensitivity
was found to be 0.1106 µg/cm/0.001AU.
Results and Discussion
The results obtained by the proposed colorimetric method for the
estimation of Tolterodine tartarate in the tablet dosage form showed that
the amount recovered was in good agreement with the label claim of the
formulation. The method was simple, precise and accurate and can be
employed for the routine analysis of Tolterodine tartarate in the tablet
dosage form. The recovery of the sample was close to 100% indicating the
Introduction to HPTLC
INTRODUCTION TO HPTLC
18-22HPTLC is the most simple separation technique today available
to the analyst. HPTLC is a qualitative tool for separation of simple
mixtures where speed, low cost and simplicity are required and it is
also a tool for quantitative analysis with high sample throughput.
Selection of chromatographic layer
Pre-coated plates with different support material, sorbent layer
and with different sorbent thickness of 100-250µm are used for
quantitative and qualitative analysis.
Pre-washing and activation of pre-coated plates
Sorbents on the plate absorb water vapour, impurities and other
volatile substances from atmosphere which gives dirty zones on
development and fail to give reproducible results. The plates are
cleaned by a method referred to as pre- washing.
The plates are activated by drying in drying cupboards for
sufficient time to ensure removal of the washing liquids (Usually, for
methanol 30-60 min at 105°). Plates are then stored in dust free
Introduction to HPTLC
Sample preparation
This procedure involves, dissolving the dosage form in a solvent
with complete recovery of intact compounds of interest and minimum of
matrix with suitable concentration of analyte during extraction and
analysis must be considered and ensured.
Sample application
Sample application is one of the most critical step for obtaining
good resolution for quantification by HPTLC. The sample should be
applied through clean upper end of the capillary to marked point.
Usually application of 1-10 µl for HPTLC is recommended. Samples
are applied as bands as it offers better separation, higher response of
densitometer, smaller spot broadening etc.
Mobile phase
Mobile phase (Solvent system) is selected by trial and error
method. Mobile phase should be chosen by taking into consideration
chemical properties of analytes and the sorbent layer. Mobile phase
containing more than 3 or 4 components should be avoided as it is
often difficult to get reproducible ratios.
Preconditioning (Chamber saturation)
In a saturated chamber, the solvent vapors get uniformly
Introduction to HPTLC
saturated chamber it soon gets pre loaded with solvent vapour, hence
less solvent is only required, resulting in lower Rf values.
Development and drying
Ascending, descending, 2-dimensional, horizontal, gradient,
radial, multidimensional etc. are the most common mode of
chromatographic development. Rectangular glass chambers,
twin-trough chambers, V-shaped chambers etc. are commonly used for
carrying out different types of TLC development.
Detection and visualization
The characteristic features of TLC/ HPTLC is the possibility to
utilize post chromatographic off line derivatisation. Detection under UV
light is the most preferred method as it is non-destructive and
commonly employed for densitometric scanning.
Criteria for selection of most suitable wave length
The light intensity remitted by chromatographic zones is usually
lower than the sorbent layer around it. Therefore, absorption spectra of
a compound can directly be determined on HPTLC plate itself in
comparison to substance free portion of sorbent layer.
Scanning is mostly carried out at a wave length of maximum
Introduction to HPTLC
chromatographic zone and the blank area of sorbent layer around it is
the largest, background being least.
In case of complex formulations, the analyst should explore the
possibility of selecting a single wavelength at which the entire
chromatogram could be scanned referred to as “most suitable
wavelength”.
While selecting single wavelength, the interest of minor
Experimental Section
METHOD DEVELOPMENT AND VALIDATION OF TOLTERODINE TARTARATE IN TABLET DOSAGE FORM BY HPTLC
1. Selection of Solvent
The drug is dissolved in a solvent in which it is soluble and in
which the drug showed good stability. Another criteria for the selection
of solvent is that it has to be volatile, cheap and easily available. As
Tolterodine tartarate is readily soluble in methanol and showed good
stability, it was selected as the solvent.
2 Selection of Detection Wavelength
An ideal wavelength is the one that gives maximum absorption
and good response for the drug to be detected. UV spectrum of the
drug showed maximum absorption at 282 nm which was selected as
the detection wavelength. (Fig .17).
3. Optimization of the Mobile phase
Based on the property of polarity, solubility, various mobile
phases were tried.
¾ The spot did not migrate with toluene: chloroform: glacial
acetic acid (8:2:0.5 %v/v/v).
¾ The spot did not migrate with toluene: ethyl acetate: glacial
acetic acid (8:2:0.5 %v/v/v).
¾ With methanol: chloroform: ethyl acetate (7:3:0.5 %v/v/v),