DEVELOPMENT OF VALIDATED ANALYTICAL METHODS
FOR THE SIMULTANEOUS DETERMINATION OF
METFORMIN AND TENELIGLIPTIN FROM
TABLET DOSAGE FORM
A Dissertation submitted to
THE TAMIL NADU Dr. M.G.R. MEDICAL UNIVERSITY, CHENNAI – 600 032
In partial fulfilment of the requirements for the award of the Degree of
MASTER OF PHARMACY
IN
BRANCH–V- PHARMACEUTICAL ANALYSIS
Submitted by R. ARAVIND RAJ
REGISTRATION No. 261530101
Under the guidance of
Dr. SUSHEEL JOHN VARGHESE, M.Pharm., Ph.D. Department of Pharmaceutical Analysis
COLLEGE OF PHARMACY
CERTIFICATE
This is to certify that the dissertation entitled “Development of Validated Analytical Methods for the Simultaneous Determination of Metformin and
Teneligliptin from Tablet Dosage Form” being submitted to The Tamil Nadu Dr.M.G.R Medical University, Chennai was carried out by R. Aravind Raj
in the Department of Pharmaceutical Analysis, College of Pharmacy, Sri Ramakrishna Institute of Paramedical Sciences, Coimbatore, under the supervision and guidance of Dr. Susheel John Varghese, M.Pharm., Ph.D. Assistant Professor, Department of Pharmaceutical Analysis, College of Pharmacy, Sri Ramakrishna Institute of Paramedical Sciences, Coimbatore.
Dr. T. K. RAVI, M. Pharm., Ph.D., FAGE., Principal & HOD, Department of Pharmaceutical Analysis,
College of Pharmacy, SRIPMS,
Coimbatore-641 044.
CERTIFICATE
This is to certify that the dissertation entitled “Development of Validated Analytical Methods for the Simultaneous Determination of Metformin and Teneligliptin from Tablet Dosage Form” being submitted to The Tamil Nadu Dr. M.G.R Medical University, Chennaiwas carried out by Mr. R. Aravind Raj in the Department of Pharmaceutical Analysis, College of Pharmacy, Sri Ramakrishna Institute of Paramedical Sciences, Coimbatore under my direct supervision and guidance to my fullest satisfaction.
Dr. SUSHEEL JOHN VARGHESE, M.Pharm., Ph.D. Assistant Professor, Department of Pharmaceutical Analysis, College of Pharmacy, SRIPMS, Coimbatore-641 044. Place: Coimbatore
ACKNOWLEDGEMENT
I would like to devote my sincere gratitude to my guide
Dr. Susheel John Varghese, M.Pharm., Ph.D., Assistant Professor, Department of Pharmaceutical Analysis, College of Pharmacy, SRIPMS,
Coimbatore for his remarkable guidance and valuable suggestion during
the tenure of my work. I wish to convey my deep sense to him for all the guidance he provided me over the time of my academic years. There is no
doubt that without his efforts the task would not be achieved. It is my great privilege to have such dedicated guide like him who provides dynamic
encouragement to me.
It is my pleasure to express my sedulous gratitude to our Principal
Dr. T. K.Ravi M.Pharm., Ph.D., FAGE, College of Pharmacy, SRIPMS, Coimbatore for giving us an opportunity to do this project work and for
providing all necessary facilities for it.
I extend my gratitude and respectful regards to our Managing
Trustee, Thiru.K.Vijayakumhar and the Management of SRIPMS for providing facilities required for the work.
My solemn thanks to my dear teachers, Dr. M. Gandhimathi, M.Pharm, Ph.D., Dr. A. Suganthi, M.Pharm., Ph.D., and Mrs. Sangeetha Sudhakaran, M.Pharm., (Ph.D)., Department of Pharmaceutical Analysis, College of Pharmacy, SRIPMS, Coimbatore for their timely help and
guidance during the course of the work.
My special thanks to Dr. R. Jayaprakasam, M.Pharm, Ph.D.,
My special thanks to Dr. A.T. Sivashanmugam, M.Pharm, Ph.D.,
Department of Pharmacology and Mr. Sunnappu Prasad, M.Pharm.,
Department of Pharmaceutical Chemistry, for their valuable help during
my course.
A special thanks to Mrs. Dhanalakshmi and Mrs. Kalaivani for unstinted support at the time of need.
I owe my sincere thanks to Dr. Venkatasamy for his kind support and cooperation.
Above all I dedicate myself before the constant love and encouragement given to me by my beloved Parents Mr. Ravichandran. R
and Mrs. Devambika. R, my brothers Mr. Avinash Lingam. R and Mr.Somasekar. S who have been the backbone of all my achievements.
My special thanks to my dear friend Sumithra who have helped me during my project work.
My heartfelt thanks to my dear friends Arthi, Dhivya, Veerapandiyan, Maria, Gobi, Raja, Naveen, Satheesh, Devika, Yazhini and Sneha who have helped me during my project work.
I owe my sincere thanks to Mrs. Mini Nair, Saraswathi Computer Centre whose technical assistance and efforts gave colour and shape to this
manuscript in such a beautiful manner.
I would like to thank all the staffs and friends who have directly or
indirectly contributed towards the success of this project.
Abbreviations & Symbols
ABBREVIATIONS AND SYMBOLS
HPLC - High Performance Liquid Chromatography
HPTLC - High Performance Thin Layer Chromatography
ICH - International conference on harmonization
LOD - Limit of detection
LOQ - Limit of quantification
min - Minute
RP-HPLC - Reverse Phase - High Performance Liquid Chromatography
RSD - Relative standard deviation
UV - Ultra violet
AS - Asymmetric factor
gm - Gram
M - Molar
Mg - Milligram
ml - Milliliter
mM - Millimolar
mm - Millimeter
N - Normality
g - Microgram
ng - Nano gram
Abbreviations & Symbols
Rs - Resolution
Rt - Retention time
Tf - Tailing factor
k` - capacity factor
α - selectivity
l - Microlitre
max - Wavelength of maximum absorbance
MET - Metformin
TENE - Teneligliptin
CONTENTS
CHAPTER
NO. TITLE
PAGE NO.
LIST OF ABBREVIATIONS
1. INTRODUCTION 1
2. LITERATURE REVIEW 18
3. DRUG PROFILE 19
4. AIM AND PLAN OF WORK 21
5. MATERIALS AND INSTRUMENTS 22
6. EXPERIMENTAL SECTION
i.) DEVELOPMENT AND VALIDATION OF HPTLC METHOD FOR THE SIMULTANEOUS
DETERMINATION OF METFORMIN AND TENELIGLIPTIN IN TABLET DOSAGE FORM
ii.)
DEVELOPMENT OF VALIDATEDRP-HPLC METHOD FOR THE SIMULTANEOUS DETERMINATION OF METFORMIN AND TENELIGLIPTIN IN TABLET DOSAGE FORM
24
44
7. SUMMARY AND CONCLUSION 77
Introduction
1.
INTRODUCTION
Analytical chemistry deals with methods for determining the chemical
composition of samples of matter. Analytical chemistry consists of classical, wet
chemical methods and modern, instrumental methods. Analytical chemistry has
broad applications to forensics, medicine, science and engineering.
I. CLASSICAL METHODS1
1. Qualitative methods
2. Quantitative methods
1. Qualitative methods
A qualitative method yields information about the identity of atomic or
molecular species or the functional groups in the sample. Identification may be
based on differences in colour, odour, melting point, boiling point, radioactivity or
reactivity.
2. Quantitative methods
A quantitative method provides numerical information as to the relative
amount of one or more of these components. It uses mass or volume changes to
quantify amount.
II. INSTRUMENTAL METHODS
The instruments used for the analysis of methods are given below:
X – ray diffraction
UV – Visible Spectroscopy Raman spectroscopy
Refractrometry
Polarimetry
Introduction
Polarography
Conductometry
Mass spectrometry
There are several valid reasons for developing new method of analysis:
Marketed drug may not be official in pharmacopoeias.
There may not be a suitable method for a particular analyte in the specific
sample matrix.
Existing methods may have poor accuracy and precision, too expensive,
time consuming or energy intensive, not easily automated, does not
provide adequate sensitivity or analyte selectivity in sample of interest.
Difficulties in extraction and separation process.
There may be a need for an alternative method to confirm, for legal or
scientific reasons, analytical data originally obtained by existing methods.
III. CHROMATOGRAPHY2
Chromatography is essentially a group of techniques for the separation of
the compounds of mixtures by their continuous distribution in two phases, one of
which moving past the other. The systems associated with this definition are
A solid stationary phase and a liquid or gaseous mobile phase
(adsorption chromatography)
A liquid stationary phase and a liquid or gaseous mobile phase
(partition chromatography)
A solid polymeric stationary phase containing replaceable ions and
an ionic liquid mobile phase (ion exchange chromatography)
An inert gel which acts as a molecular sieve and a liquid mobile phase (gel
chromatography)
The basis of the separation of the components of a mixture may be defined
Introduction
1. CHROMATOGRAPHY TECHNIQUES
The different chromatographic techniques include:
Thin layer chromatography
High performance thin layer chromatography High performance liquid chromatography Gas chromatography
Super critical fluid chromatography
1.1. High Performance Thin Layer Chromatography3, 4
HPTLC is a sophisticated and automated form of TLC and is highly useful
method for both qualitative and quantitative analysis. It allows for the various
analytical applications which involve complex separation. The advantages of
automation, scanning, full optimization, selective detection principle, minimum
sample preparation, hyphenation, etc. enable it to be a powerful analytical tool for
chromatographic information of complex mixtures of inorganic, organic, and
biomolecules. It is a valuable tool for reliable identification providing
chromatographic fingerprints.
Various steps involved in HPTLC
Selection of plate
Sample and standard preparation
Selection and optimization of mobile phase
Application of standard and the sample
Chromatographic development
Introduction
a. Selection of plate
Pre-coated plates with various support material, sorbent layer and with
various sorbent thickness of 100-250 m are used for quantitative and qualitative
analysis.
b. Sample preparation
Sample preparation involves, dissolving the dosage form in a solvent with
complete recovery of intact compounds of interest and minimum of matrix with
suitable concentration of analyte during extraction and analysis must be
considered and ensured.
Choice of solvent for the sample:
It should dissolve the analytes. It should be reasonably volatile. It should have low viscosity.
It should be a weak (least polar) chromatographic solvent for the analyte.
c. Sample application
This is the most critical step for obtaining good resolution for
quantification by HPTLC. The sample solution should be applied through clean
upper end of the capillary to marked point. Usually application of 0.5-5l for
HPTLC is recommended. Samples are applied as bands, because it offers better
separation and uniform after development.
Advantages of auto sampler:
Even distribution of sample Better resolution
Greater accuracy Better separation
Introduction
d. Optimization of mobile phase
Mobile phase should be chosen by considering chemical properties of
analytes and the sorbent layer. Mobile phase ratio is selected by trial and error
method.
e. Chromatographic development
The chamber needs to be saturated prior to development, as solvent
vaporizes soon. The time required for saturation will depend on the nature and
composition of mobile phase and layer thickness. The precoated plate is then
placed in the saturated chamber containing mobile phase and allowed to run the
desired running distance and then kept out for drying.
f. Detection
Detection under UV light is the first choice, as it is non – destructive in
most cases and employed for densitometric scanning.
Iodine is the universal detection reagent, the detection is usually
non-destructive and reversible but certain substances may be altered through
non-reversible derivatization such as ethambutol hydrochloride, a totally
non-UV absorbing compound.
Fluorescent chemicals are employed for detection of lipophilic substances
Introduction
1.2. High Performance Liquid Chromatography5-7
A variety of methods are available for analysing pharmaceutical
compounds; however high pressure liquid chromatography is currently the method
of choice for the analysis of these compounds. HPLC offers high performance
over ambient pressure or low pressure liquid chromatography.
High performance liquid chromatography is used in analytical
development to quantitate the active pharmaceutical ingredient (API) and to
evaluate impurity and degradation product profiles of drug substance and drug
products. Additional uses of HPLC include the determination of content
uniformity of dosage forms, monitoring of dissolution profiles, determination of
antioxidant and microbial preservative content and support of cleaning
validations. Separations of these types require only a monitoring of one, or a
limited number of predefined components. A significantly larger challenge is
presented in the composite assays of drug substances and drug products where the
goal is to quantitate API and relevant impurities and degradation products in a
single chromatographic run.
The method development of pharmaceuticals by HPLC begins with array
of methods suitable for the separation of drug substances, synthetic intermediates
and starting materials, excipients, and products from forced decomposition
studies.
The development of any new or improved method usually tailors existing
approaches and instrumentation to the current analyte, as well as to the final needs
or requirements of the method. Method development usually requires selecting the
requirements and deciding on what type of instrumentation to utilize at the
development stage, decisions regarding
Introduction
Goals for new or improved HPLC method might include the following:
Qualitative identification of the specific analyte(s) of interest, providing
some structural information to confirm general behaviour (i.e. retention
time, pH )
Quantitative determination, at trace levels when necessary (i.e. accurate,
precise and reproducible in any laboratory setting when performed
according to established procedures).
Ease of use, ability to be automated, high sample throughout and rapid
sample turnaround time.
Sample preparation that minimizes time, effort, materials and volume of
Introduction
The following criteria are to be met for developing methods:
i. For drug substance
Methods should separate the API, synthetic process impurities, and drug
substances degradation products. Methods should be able to detect impurities and
degradation products present at levels greater than 0.05% relative to the API.
Impurities and degradation products present at the levels greater than 0.1% should
be identified and specifications should be placed on limits.
ii. For drug products
Methods should separate the API, drug products degradation products
from excipients. Drug products methods are not required to monitor synthetic
process impurities, unless they are also drug product degradation products.
Methods should be able to detect degradation products present at levels greater
than 0.1% relative to the API. Degradation products present at levels greater than
0.2% should be identified and specifications should be placed on limits.
1.2.1. Fundamental Concepts
The fundamental concepts in HPLC include:
a. Retention time
Retention time is the time of emergence of the peak maximum of a
component after injection.
The time between the sample injection point and analyte reaching a
detector is called retention time (tR). The retention time of an unretained
component (often marked by the first baseline disturbance caused by the elution of
Introduction
The height or the area of a peak is proportional to the concentration or the
amount of that particular component in the sample. The peak area is most
commonly used since it provides a more accurate quantitative measurement.
Chromatogram
b. Capacity factor (k`)
A more fundamental term that measures the degree of retention of the
analyte is the capacity factor or retention factor (k`), calculated by normalising the
net retention time by the void time (t0).
k` = tR - t0 / t0
Where
k` = capacity factor
tR = retention time
Introduction
c. Selectivity (α)
Separations between two components are possible if they have different
migration rates through the column. Selectivity or separation factor is a measure
of differential retention of two analytes.
Selectivity must be greater than 1.5 for peak separation. Selectivity is
dependent on the nature of the stationary phase and the mobile phase composition.
d. Column efficiency (N)
The term plate number (N), is a quantitative measure of the efficiency of
the column and is related to the ratio of the retention time and the standard
deviation of the peak width (σ).
N = 16 X (tR /W)
Where
N = number of theoretical plates
tR = retention time
Introduction
e. Height equivalent of a theoretical plate (HETP)
The concept of a plate is traditionally derived from the industrial
distillation process using distillation columns consisting of individual plates were
the condensing liquid is in equilibrium with the rising vapour. Thus, a longer
distillation column would have more plates or equilibration steps. Similarly in
chromatography, the HETP is equal to the length of the column (L) divided by the
number of theoretical plates (N) even though there are no discrete plates inside the
HPLC column.
Height equivalent of a theoretical plate, (HETP) = L / N
Where
L = length of the column
Introduction
f. Resolution (Rs)
The goal of most HPLC analysis is the separation of one or more analytes
from other components in the sample in order to obtain quantitative information
for each analyte. Resolution is the degree of separation of two adjacent peaks, and
is defined as the difference in retention times of the two peaks divided by the
average peak width. As peak widths of adjacent peaks tend to be similar, the
average peak width can be equal to the width of one of the two peaks.
Resolution, (Rs) = tR1 – tR2 / {(w1+ w2)/2}
Where
tR1 & tR2 -retention time of peaks
w1&w2 - width of the peaks
Resolution: Chromatogram with two adjacent peaks
g. Tailing factor (Tf)
Under ideal conditions, chromatographic peaks will have Gaussian peak
shapes with perfect symmetry. In reality, most peaks are either slightly fronting or
Introduction
Tailing factors for most peaks should fall between 0.9 and 1.4, with a
value of 1.0 indicating a perfectly symmetrical peak. Peak tailing is typically
caused by adsorption or other strong interactions of the analyte with the stationary
phase while peak fronting can be caused by column overloading, chemical
reaction or isomerization during the chromatographic process.
Tailing factor, Tf = AC / 2AB
1.2.2. Mobile Phase Parameters
a. Organic solvent and selectivity
Sample retention can be controlled by varying the solvent strength of the
mobile phase. A strong solvent decreases retention and weak solvent increases
retention. Tetrahydrofuran is stronger than acetonitrile, which in turn is stronger
than methanol in RP – HPLC. b. Buffers
Many drugs have either acidic or basic functional groups and can exist in
solutions in ionized or non – ionized forms. The ionic state and degree of ionization greatly affect their chromatographic retention in RP – HPLC. Typically, the ionic form does not partition well into the hydrophobic stationary phase and
therefore has significantly lower capacity factor than the neutral, un-ionized form.
Buffers are commonly used to control the pH of the mobile phase for the
Introduction
c. Acidic mobile phase
A mobile phase at acidic pH of 2.5 – 3 is a good starting point for most pharmaceutical applications because the low pH suppresses the ionization of most
acidic analytes resulting in the higher retention. Common acids used for mobile
phase preparations are phosphoric acid, formic acid and acetic acid. Low pH also
minimises the interaction of basic analytes with surface silanols on the silica
packing (because silanols do not ionize at acidic pH). Also, the lifetime of most
silica-based columns is excellent in the pH range of 2–8. However, basic analytes are ionized at low pH and might not be retained unless ion – pairing reagents are used.
d. Ion – pairing reagents
Ion – pairing reagents are detergents like molecules added to the mobile phase to provide additional retention or selectivity for the analytes with opposite
charge. Long- alkyl sulphonates are commonly used for the separation of water
soluble basic analytes in the analysis of water soluble vitamins. Amine modifiers
such as trimethylamine are often used in the mobile phase to reduce peak tailing
caused by strong interaction of basic analytes with acidic surface silanols. For
acidic analytes, ion pairing reagents such as tetra – alkyl ammonium salts are often used.
e. Isocratic vs gradient analysis
Traditionally, most pharmaceutical assays are isocratic analysis employing
the same mobile phases throughout the elution of the sample. Isocratic analyses
are particularly common in quality control applications since they use simpler
HPLC equipment and premixed mobile phases.
In contrast, gradient analysis in which the strength of the mobile phase is
increased with time during sample elution, is suited for complex samples and
those containing analytes of wide polarities. Gradient chromatography is
Introduction
IV.
VALIDATION PARAMETERS AS PER ICH GUIDELINES8a. Specificity
Specificity is the ability to assess unequivocally the analyte in presence of
components which may be expected to be present like impurities, matrix etc. An
investigation of specificity should be conducted during the validation of
identification tests, the determination of impurities and the assay. The procedures
used to demonstrate specificity will depend on the intended objective of the
analytical procedure.
b. Accuracy
The accuracy of an analytical procedure expresses the closeness of
agreement between the value which is accepted either as convential true value or
an accepted reference value and the value found. Accuracy should be established
across the specified range of the analytical procedure.
Assay
1) Drug substance
2) Drug product
Impurities (Quantitation)
Accuracy should be assessed using a minimum of 9 determinations over a
minimum of 3 concentration levels covering the specified range (e.g., 3
concentrations/3 replicates each of the total analytical procedure). Accuracy
should be reported as percent recovery by the assay of known added amount of
analyte in the sample or as the difference between the mean and the accepted true
value together with the confidence intervals.
c. Precision
The precision of an analytical procedure expresses the closeness of
agreement (degree of scatter) between a series of measurements obtained from
multiple sampling of the same homogeneous sample under the prescribed
conditions. Precision may be considered at three levels: repeatability,
intermediate precision and reproducibility.
Introduction
i. Repeatability (Intra assay precision)
Repeatability expresses the precision under the same operating conditions
over a short interval of time.
ii. Intermediate precision
Intermediate precision expresses within-laboratories variations: different
days, different analysts, different equipment, etc.
iii. Reproducibility
Reproducibility expresses the precision between laboratories (collaborative
studies, usually applied to standardization of methodology).
d. Limit of detection (LOD)
LOD is defined as the smallest concentration of an analyte detected, but
not necessarily quantified. A few approaches to determine LOD are listed below
i. Based on signal-to-noise approach
A signal-to-noise ratio between 3 or 2:1 is generally considered acceptable
for estimating the detection limit.
ii. Based on the standard deviation of the response and the slope
The detection limit (DL) may be expressed as:
DL = 3.3 σ / S
Where
σ = the standard deviation of the response
S = the slope of the calibration curve
e. Limit of quantification (LOQ)
LOQ is defined as the lowest concentration of an analyte determined with
acceptable precision, accuracy and reliability by a given method under stated
Introduction
i. Based on signal-to-noise approach
A signal-to-noise ratio of 10: 1 is generally considered acceptable for
estimating the quantitation limit.
ii. Based on the standard deviation of the response and the slope
The quantitation limit (QL) may be expressed as:
Quantitation limit, QL = 10 σ / S Where
σ = the standard deviation of the response S = the slope of calibration curve
f. Linearity
The linearity of an analytical procedure is its ability (within a given range)
to obtain test results which are directly proportional to the concentration (amount)
of analyte in the sample. This relationship is evaluated by statistical methods. For
the establishment of linearity, a minimum of five concentrations is recommended.
The parameters to be calculated are correlation coefficient, y-intercept, slope and
residual sum of squares.
g. Range
The range of an analytical procedure is the interval between the upper and
lower concentration (amounts) of analyte in the sample (including these
concentrations) for which it has been demonstrated that the analytical procedure
has a suitable level of precision, accuracy and linearity.
h. Robustness
The robustness of an analytical procedure is a measure of its capacity to
remain unaffected by small, but deliberate variations in method parameters and
Literature Review
2. LITERATURE REVIEW
9-12 Madhukar A. et al. reported a validated HPLC method for analysis of
metformin hydrochloride.
Prasad PBN. et al. proposed a RP – HPLC method for simultaneous
determination of metformin and saxagliptin in formulation.
Sohan SC. et al. reported validated RP - HPLC and derivative spectroscopy
methods for determination of teneligliptin.
Ganesh K. et al. reported RP – HPLC and UPLC tandem mass
spectroscopy methods for stability studies and identification of degradation
Drug Profile
3. DRUG PROFILE
13-15Drug name : Metformin
Drug structure :
IUPAC name : N, N – dimethylimidodicarbonimidic
diamide
Molecular formula : C4 H11 N5
Molecular weight : 165.62
Description : White, crystalline, hygroscopic
Solubility : Freely soluble in water;
Slightly soluble in ethanol (95%)
Category : Type II diabetes mellitus
Drug Profile
Drug name : Teneligliptin
Drug structure :
IUPAC name : {(2S, 4S)- 4- [ 4- (3- methyl -1- phenyl - 1H – pyrazol - 5 yl) - 1- piperazinyl] - 2 – pyrolindinyl} (1,3- thiazolindin - 3- yl )
methanone
Molecular formula : C22 H30 N6 OS
Molecular weight : 426.58
Description : White powder
Solubility : Soluble in methanol and water
Category : Type II diabetes mellitus
Aim & Plan of Work
4. AIM AND PLAN OF WORK
Diabetes is a chronic, metabolic disease characterized by elevated levels of
blood glucose (or blood sugar), which leads over time to serious damage to heart,
blood vessels, eyes, kidneys and nerves. The most common is type 2 diabetes,
usually in adults, which occurs when the body becomes resistant to insulin or
doesn’t make enough insulin. According to WHO, around 422 million adults have diabetes and 1.5 million deaths are directly attributed to diabetes each year.16
Antidiabetic drugs can be used alone or in combination for the
management of diabetes. Metformin is an oral anti-hyperglycaemic drug
belonging to the class of biguanides which is used in the management of
type 2 diabetes.17 Teneligliptin is a third generation dipeptidyl peptidase-4
inhibitor approved for treatment of type 2 diabetes. Combination of these drugs
has been recently launched and it has been reported that teneligliptin
co-administered with metformin produced significant reductions in HbA1c in patients
with type 2 diabetes mellitus without increasing the risk of hypoglycemia.18 No
HPTLC and HPLC methods have been reported for the simultaneous analysis of
these drugs in combined dosage form. Hence, an attempt is made to
develop HPTLC and HPLC methods for the simultaneous determination of
Materials & Instruments
5. MATERIALS AND INSTRUMENTS
Active pharmaceutical ingredient (API)
Metformin and Teneligliptin were procured from Tristar Formulations
Pvt. Ltd., Pondicherry, India and Zydus Cadila Healthcare Pvt. Ltd., Gujarat, India
respectively.
Formulation
ZITA – MET PLUS 20mg/ 500mg extended release tablets: Glenmark
Pharmaceuticals.
Chemicals and solvents used
Water- HPLC grade
Methanol HPLC grade, AR grade
Tetrahydrofuran - HPLC grade
Formic acid- AR grade
Chloroform- LR grade
Sodium hydroxide- LR grade
Hydrochloric acid- AR grade
Hydrogen peroxide- LR grade
Ammonia 25% solution
Ammonium acetate
Potassium dihydrogen phosphate
Ortho Phosphoric acid
Hydrochloric acid (0.5 N)
Materials & Instruments
All the above chemicals and solvents were supplied by S.D. Fine
Chemicals Pvt. Ltd., India, Sigma - Aldrich Chemicals Pvt. Ltd., Maharashtra,
India and Ranbaxy chemicals Pvt. Ltd., New Delhi, India.
Stationary phases used
Pre-coated silica gel 60F254 on aluminium sheets were procured from
Merck, Germany.
Hibar, C18 (250mm X 4.0mm, 5μm) column was obtained from Merck Pvt.
Ltd., Mumbai.
Instruments used
Shimadzu digital electronics balance
Elico Pvt. Limited, India, pH meter
Jasco V-600 UV/ Vis- spectrophotometer
Camag HPTLC system (with TLC Scanner-3, Win CATS software and
Linomat V as application device)
Shimadzu HPLC Prominence i LC – 2030 liquid chromatograph system
with UV – VISIBLE detector and auto sampler injector. Chromatograms
were recorded and integrated on PC installed with Lab solutions
chromatographic software.
Shimadzu liquid chromatograph equipped with LC – 10 AT VP pump,
SPD-M10A VP diode array detector and rheodyne 7725 i injected with a
20 l loop. Chromatograms were recorded and integrated on PC installed
Experimental Section
6. EXPERIMENTAL SECTION
I. DEVELOPMENT AND VALIDATION OF HPTLC METHOD
FOR THE SIMULTANEOUS DETERMINATION OF
METFORMIN AND TENELIGLIPTIN IN
TABLET DOSAGE FORM
1. Selection of plate
Pre-coated silica gel 60F254 on aluminium sheet was selected for the study.
2. Selection of solvent
Ideal properties of a solvent employed for HPTLC are
a) Drug should be soluble in the solvent used
b) Drug should show stability in the solvent used
c) Solvent should be volatile
Accordingly, methanol was selected as the solvent.
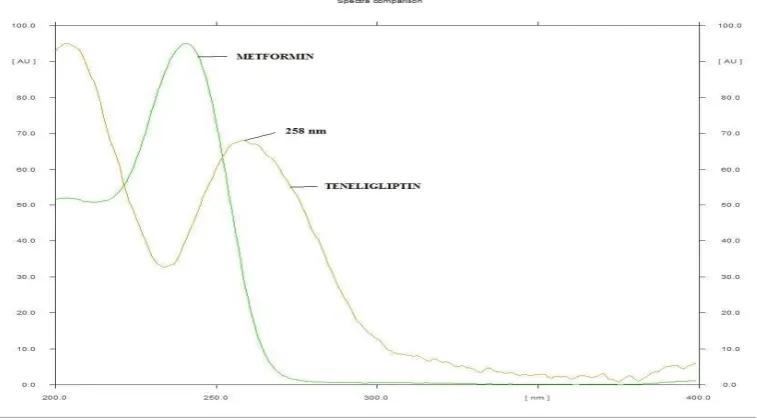
3. Selection of wavelength
UV spectra of metformin and teneligliptin were recorded on pre-coated
TLC plate. The max of metformin and teneligliptin were found to be 237 nm and 258 nm respectively. From the overlain UV spectra of the drugs, a wavelength of
258 nm was selected for the study, fig. 1.
Fig. 1: Overlain UV spectra of metformin and teneligliptin
Experimental Section
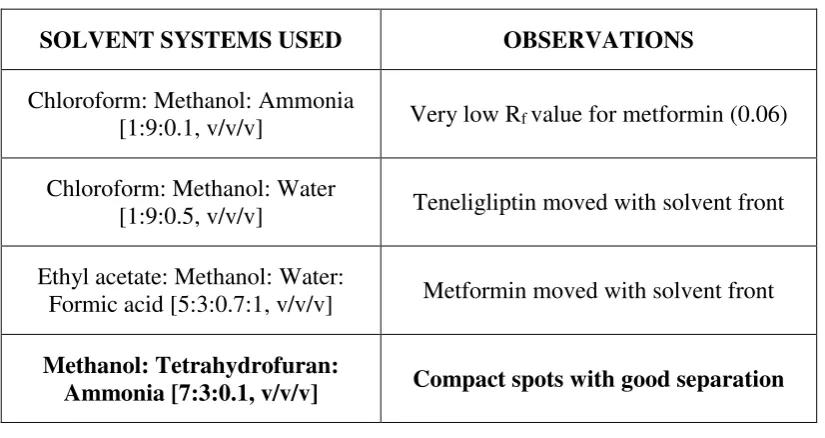
4. Developing optimum mobile phase system
A solvent system should be selected in such a way that it would give
compact spots and good separation from solvent front and application position.
Initially, different solvent systems were tried and observations were as given in
[image:33.595.102.515.253.472.2]table 1.
Table: 1 Selection of mobile phase system
SOLVENT SYSTEMS USED OBSERVATIONS
Chloroform: Methanol: Ammonia
[1:9:0.1, v/v/v] Very low Rf value for metformin (0.06)
Chloroform: Methanol: Water
[1:9:0.5, v/v/v] Teneligliptin moved with solvent front
Ethyl acetate: Methanol: Water:
Formic acid [5:3:0.7:1, v/v/v] Metformin moved with solvent front
Methanol: Tetrahydrofuran:
Ammonia [7:3:0.1, v/v/v] Compact spots with good separation
Among these systems, methanol: tetrahydrofuran: ammonia was selected because this system gave good separation with compact spots.
5. Optimization of mobile phase ratio
Different ratios of methanol: tetrahydrofuran: ammonia like 6.5: 2.5: 0.1,
6.5: 2.5: 0.2, 6.5: 2.5: 0.5 and 7: 3: 0.1, v/v/v etc. were tried, from which the ratio
of (7: 3: 0.1, v/v/v) was selected because it gave compact spots with good
Experimental Section
6. Fixed experimental conditions
Sorbent layer : Silica gel 60F254
Mobile phase : Methanol: Tetrahydrofuran: Ammonia [7:3:0.1, v/v/v]
Saturation time : 15 minutes
Total run distance : 8 cm
Slit dimension : 5 x 0.45 mm
Plate thickness : 250 m
Light source : Deuterium lamp
Detection wavelength : 258 nm
Rf values : Metformin 0.29 ± 0.02
Experimental Section
VALIDATION OF THE METHOD
The validation of the developed method was carried out for various
parameters like limit of detection (LOD), limit of quantification (LOQ), linearity,
accuracy, precision and specificity.
1. Limit of detection [LOD] & Limit of quantification [LOQ]
The LOD and LOQ values were determined by injecting lower
concentrations of the drugs. The LOD values for metformin and teneligliptin were
found to be 0.01 and 0.1g/band respectively and their LOQ values were found to
be 0.07 and 0.4g/band respectively, fig. 2-5.
Experimental Section
Fig. 3: Limit of detection – Teneligliptin
Experimental Section
Fig. 5: Limit of quantification – Teneligliptin
2. Linearity
a) Metformin
Metformin was found to be linear in the concentration range of 6.25-17.5
g/band. Calibration curve was plotted using concentration (x) versus peak area
(y). The slope, intercept and correlation coefficient values were found to be
1132.521, 6055.128 and 0.9991 respectively, fig. 6; table 2.
The regression equation is as follows
Experimental Section
Fig. 6: Calibration graph of metformin
Table 2: Calibration data (6.25 – 17.50 µg/band)
Concentration (µg/band) Peak Area
6.25 13296.8
7.5 14965.5
8.75 16384.9
10.00 17390.0
11.25 19311.4
12.50 20268.3
13.75 21735.8
15.00 23118.7
16.25 24468.4
Experimental Section
b) Teneligliptin
Teneligliptin was found to be linear in the concentration range of 0.25-0.7
g/band. Calibration curve was plotted using concentration (x) versus peak area
(y). The slope, intercept and correlation coefficient values were found to be 2.725,
-125.859 and 0.9981 respectively, fig. 7; table 3.
The regression equation is as follows
Peak area = (-125.859) + 2.725x concentration
Experimental Section
Table 3: Calibration data (0.25 – 7 µg/band)
Concentration (µg/band) Peak Area
0.25 624.7
0.30 745.4
0.35 881.3
0.40 993.5
0.45 1188.9
0.50 1278.4
0.55 1449.0
0.60 1606.3
0.65 1722.1
0.70 1891.7
3. Accuracy
Recovery studies were done for determining accuracy parameter. It was
done by mixing known quantity of standard drug with the analysed sample
formulation and the contents were reanalysed by the proposed method. Recovery
studies were carried out at 80, 100 and 120% levels. The percentage recovery and
its %RSD were calculated, table 4 and 5.
Table 4: Recovery studies for metformin
Level %Recovery %RSD*
80% 99.62 0.6
100% 101.25 0.37
Experimental Section
Table 5: Recovery studies for teneligliptin
Level %Recovery %RSD*
80% 99.99 0.19
100% 100.98 0.64
120% 101.06 0.64
*RSD of 6 observations
4. Precision
Precision of method was demonstrated by:
i.) Intra-day precision
ii.) Inter-day precision
iii.) Repeatability
a) Repeatability of sample application
b) Repeatability of sample measurement
i) Intraday precision
Intraday precision was studied by carrying out the analysis of the standard
drugs at two different concentrations in the linearity range of the drugs for three
times on the same day and %RSD was calculated, table 6.
Table 6: Intraday precision
Concentration Peak Area % RSD
Metformin Teneligliptin Metformin Teneligliptin
10.00(µg/band) Metformin 0.4(µg/band) Teneligliptin 17505.5 969.3 0.11 0.43 17491.6 950.5 17467.2 944.8 12.50(µg/band) Metformin 0.5(µg/band) Teneligliptin
19864.2 1171.0
1.3 1.7
19692.6 1130.9
Experimental Section
ii) Inter-day precision
Inter-day precision was studied by carrying out the analysis of the standard
drugs at two different concentrations in the linearity range of the drugs for three
days over a period of one week and % RSD was calculated, table 7.
Table 7: Inter-day precision
Concentration Peak Area % RSD
Metformin Teneligliptin Metformin Teneligliptin
10.00(µg/band) Metformin 0.4(µg/band) Teneligliptin
17593.2 983.3
0.54 1.26
17467.2 958.8
17406.0 973.1
12.50(µg/band) Metformin 0.5(µg/band) Teneligliptin
19973.1 1195.0
0.44 1.43
19796.0 1157.5
19872.8 1198.5
iii) Repeatability
a) Repeatability of sample application
Repeatability of sample application was evaluated by spotting drug
solution six times on pre-coated TLC plate. Plate was then developed, scanned
and %RSD was calculated, table 8.
Table 8: Repeatability of sample application
Concentration Peak Area % RSD
Metformin Teneligliptin Metformin Teneligliptin
10.00(µg/band) Metformin 0.4(µg/band) Teneligliptin
17988.3 956.2
0.13 0.7
Experimental Section
b) Repeatability of sample measurement
Repeatability of measurement of peak area was evaluated by spotting the
standard drug solutions on pre-coated TLC plate. After development of the plate
the separated spots were scanned six times without changing the position of the
plate and % RSD was calculated, table 9.
Table 9: Repeatability of sample measurement
Concentration
Peak Area % RSD
Metformin Teneligliptin Metformin Teneligliptin
10.00(µg/band)
Metformin
0.4(µg/band)
Teneligliptin
17799.0 986.9
0.22 1.37
17709.8 988.1
17770.9 994.3
17755.3 969.9
17696.7 959.2
17771.3 988.1
5. Specificity
The peak purity of metformin and teneligliptin was assessed by comparing
their respective spectra at peak start, peak apex and peak end positions of the spot.
The good correlation among spectra acquired at start (s), apex (m) and end (e) of
the peaks metformin[{correlation r(s,m)=0.99943}, r(m,e)=0.99908}] and
teneligliptin [{correlation r(s,m) =0.99966}, r(m,e) =0.99521}] indicates good
peak purities of drugs, fig. 8 and 9. It can be concluded that no impurities or
degradation products migrated with the peaks obtained from standard solutions of
Experimental Section
Fig. 8: Peak purity graph showing correlation between peak maxima and slope for metformin
Experimental Section
ANALYSIS OF FORMULATION
1. Preparation of stock solution
A stock solution of metformin (2500 µg/ml) and teneligliptin (100 µg/ml)
was prepared in methanol.
2. Preparation of sample solutions
Ten tablets each containing 500 mg of metformin and 20 mg of
teneligliptin were weighed and the average weight was determined. Amount of
powder equivalent to 125 mg of metformin and 5 mg of teneligliptin was
transferred to a 50 ml volumetric flask, and 25 ml methanol was added. The
contents of the flask were shaken for 10 minutes, followed by dilution to volume
with methanol to provide a solution containing 2500 µg/ml of metformin and 100
µg/ml of teneligliptin. This solution was filtered through a 0.45 mm membrane
filter before injection.
3. Recording the chromatograms
With the fixed chromatographic conditions, 2.5 – 7 l (i.e. 6.25 to 17.5
g/band for metformin and 0.25 to 0.7 g/band for teneligliptin) from standard stock solution and suitable volumes from sample solution were applied on the
precoated TLC plate. The plates were analysed and chromatograms were
recorded and results are given in table 10. The standard chromatograms, overlain
UV spectra of drugs in formulation and 3D image of standard chromatograms are
given in fig. 10 – 21.
Table 10: Analysis of formulation
Drug
Amount of drug
(mg/tablet) % Label
claim %RSD*
Labelled Found
Zita met plus (Teneligliptin 20 mg & Metformin 500mg)
20 mg 19.84 mg 99.2 0.98
500 mg 491.4 mg 99.3 1.12
Experimental Section
CHROMATOGRAMS OF STANDARDS
Fig. 10: Chromatogram of standard 1 (MET 6.25 g/band; TENE 0.25 g/band)
Experimental Section
Fig. 12: Chromatogram of standard 3 (MET 8.75 g/band; TENE 0.35 g/band)
Experimental Section
Fig. 14: Chromatogram of standard 5 (MET 11.25 g/band; TENE 0.45 g/band)
Experimental Section
Fig. 16: Chromatogram of standard 7 (MET 13.75 g/band; TENE0.55 g/band)
Experimental Section
[image:50.595.115.495.144.387.2]Fig. 18: Chromatogram of standard 9 (MET 16.25 g/band; TENE0.65 g/band)
Experimental Section
Fig. 20: Overlain UV spectra of drugs in formulation on precoated TLC plate
[image:51.595.122.496.253.688.2]Experimental Section
II.
DEVELOPMENT OF VALIDATED RP-HPLC METHOD
FOR THE SIMULTANEOUS DETERMINATION OF
METFORMIN AND TENELIGLIPTIN IN TABLET
DOSAGE FORM
1. Selection of stationary phase
Since metformin and teneligliptin are polar in nature, RP-HPLC method
with C18 column was selected for method development.
2. Selection of wavelength
Selectivity of HPLC method that uses UV detector depends on proper
selection of wavelength. A wavelength which gives good response for the drugs to
be detected is to be selected. From UV spectral studies, 247 nm was selected as
[image:52.595.116.500.406.664.2]detection wavelength for metformin and teneligliptin, fig. 22.
Experimental Section
Department of Pharmaceutical Analysis
3. Selection of mobile phase
Solvent type, solvent strength, strength of buffer and optimum pH were
optimised to get the chromatographic conditions that gave best separation, fig.
23-30;table 11.
Table 11: Selection of mobile phase
Figure No.
Mobile phase
Chromatograms
Metformin Teneligliptin
23 & 24
Water: Methanol
Asymmetric peak Peak tailing
25 & 26
10 mM Sodium dihydrogen Ortho phosphate: Methanol
Peak tailing Broad peak
27 & 28
10 mM Potassium dihydrogen Ortho phosphate: Methanol
Experimental Section
Figure No. Mobile phase ChromatogramsMetformin Teneligliptin
29 & 30
10 mM Ammonium
acetate: Methanol
Peak tailing Peak tailing
4. Selection of mobile phase ratio
Mobile phase system containing 10 mM potassium dihydrogen ortho
phosphate and methanol was tested in different ratios like 30: 70, 35: 65 and
40: 60 v/v. A ratio of 35: 65% v/v gave good resolution and peak characteristics,
fig. 31-33; table 12.
Table 12: Selection of mobile phase ratio
Figure No.
Mobile
phase ratio Chromatogram Observation
31 30:70
Less resolution between the
Experimental Section
Department of Pharmaceutical Analysis
Figure No.
Mobile
phase ratio Chromatogram Observation
32 35: 65
Good peak shape and acceptable resolution
33 40: 60 Drug peak
shapes not good
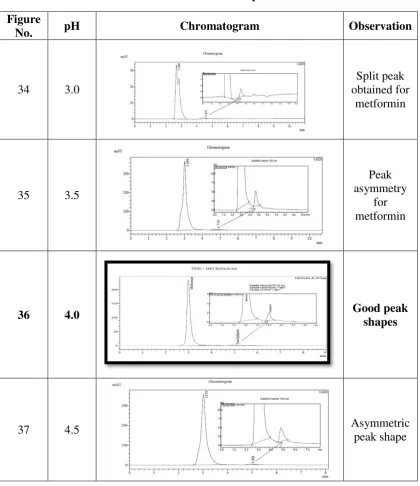
5. Selection of pH
Different pH’s of 10 mM potassium dihydrogen orthophosphate such as
3, 3.5, 4, 4.5 and 5.4 were tried. Good peak characteristics was observed for pH 4
Experimental Section
Table 13: Selection of pH
Figure
No. pH Chromatogram Observation
34 3.0
Split peak obtained for
metformin
35 3.5
Peak asymmetry
for metformin
36 4.0 Good peak
shapes
37 4.5 Asymmetric
Experimental Section
Department of Pharmaceutical Analysis
Figure
No. pH Chromatogram Observation
38 5.4
Less resolution between the
drug peaks
6. Fixed chromatographic conditions
Stationary phase : Hibar, C18 column (250mm X 4.0mm, 5m)
Mobile phase : 10 mM potassium dihydrogen orthophosphate
(adjusted to pH 4 using ortho phosphoric acid):
Methanol
Solvent ratio : 35: 65, v/v
Flow rate : 1.0 ml/min
Detection wavelength : 247 nm
Temperature : Room temperature
A chromatogram showing the separation of metformin and teneligliptin
Experimental Section
Experimental Section
Department of Pharmaceutical Analysis
METHOD VALIDATION
The validation of the developed method was carried out for various
parameters like linearity, accuracy, precision, limit of detection (LOD), limit of
quantification (LOQ), stability, robustness and specificity.
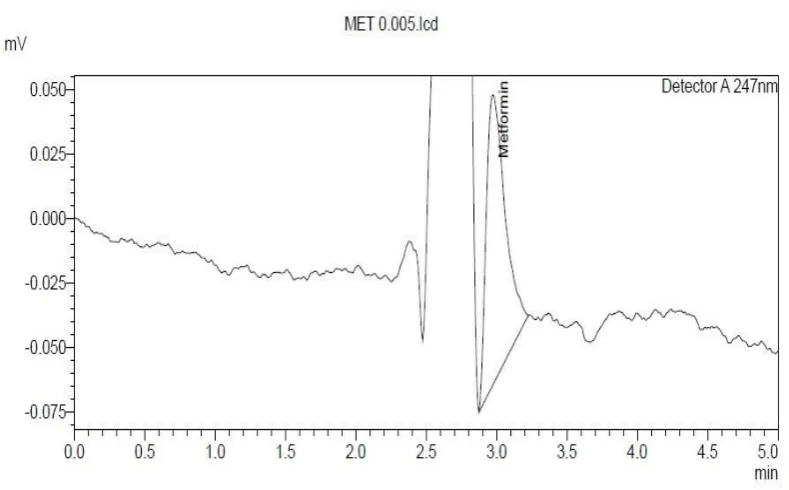
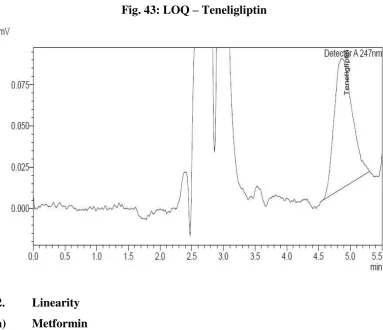
1. Limit of detection and limit of quantification (LOD & LOQ)
The LOD and LOQ values were determined by injecting lower
concentrations of the drugs. The LOD values for metformin and teneligliptin were
found to be 5 and 10 ng/ml respectively and their LOQ values were found to be 10
[image:59.595.108.503.376.621.2]and 70 ng/ml respectively, fig. 40-43
Experimental Section
Fig. 41: LOD - Teneligliptin
Experimental Section
[image:61.595.112.496.115.445.2]Department of Pharmaceutical Analysis
Fig. 43: LOQ – Teneligliptin
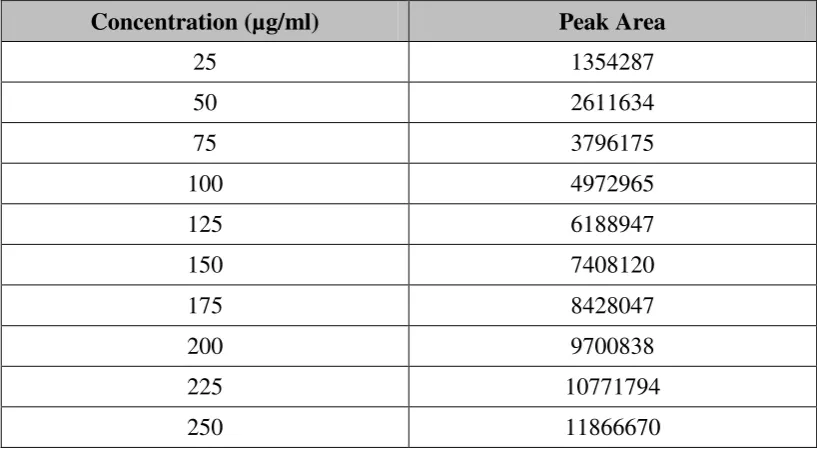
2. Linearity
a) Metformin
Metformin was found to be linear in the concentration range of 25 – 250
µg/ml. Calibration curve was plotted using concentration (x) versus peak area (y).
The slope, intercept and correlation coefficient values were found to be 46749.2,
281930 and 0.9998 respectively, fig. 44; table 14.
The regression equation is as follows
Experimental Section
Fig. 44: Calibration graph – Metformin
Table 14: Metformin - Calibration data (25 – 250 µg/ml)
Concentration (µg/ml) Peak Area
25 1354287
50 2611634
75 3796175
100 4972965
125 6188947
150 7408120
175 8428047
200 9700838
225 10771794
250 11866670
0 2000000 4000000 6000000 8000000 10000000 12000000 14000000
0 50 100 150 200 250 300
Peak area
[image:62.595.102.511.443.668.2]Experimental Section
Department of Pharmaceutical Analysis
b) Teneligliptin
Teneligliptin was found to be linear in the concentration range of 1 – 10
µg/ml. Calibration curve was plotted using concentration (x) versus peak area (y).
The slope, intercept and correlation coefficient values were found to be 16392.2,
-1954.47 and 0.9991 respectively, fig. 45; table 15.
The regression equation is as follows
[image:63.595.109.506.296.574.2]Peak area = (-1954.47) + 16392.2 x concentration
Fig. 45: Calibration graph - Teneligliptin
0 20000 40000 60000 80000 100000 120000 140000 160000 180000
0 2 4 6 8 10 12
Peak area
Experimental Section
Table 15: Teneligliptin - Calibration data (1 – 10 µg/ml)
Concentration (µg/ml) Peak Area
1 15169
2 29070
3 46856
4 62792
5 79957
6 98550
7 112943
8 131102
9 147915
10 157651
3. Accuracy
Recovery studies were done for determining accuracy parameter. It was
done by spiking known quantity of standard drug with the analysed sample
formulation and the contents were reanalysed by the proposed method. Recovery
studies were carried out at 80, 100 and 120% levels. The percentage recovery and
its %RSD were calculated, table 16 & 17.
Table 16: Recovery studies for metformin
Level %Recovery %RSD*
80% 99.9 0.71
100% 99.78 0.77
120% 103.81 0.77
Experimental Section
Department of Pharmaceutical Analysis
Table 17: Recovery studies for teneligliptin
Level %Recovery %RSD*
80% 99.43 0.7
100% 100.27 0.57
120% 99.66 0.81
*RSD of 6 observations
4. Precision
Precision of method was demonstrated by:
i.) Intraday precision
ii.) Inter-day precision
iii.) Repeatability
a. Repeatability of injection
i) Intraday precision
Intra-day precision was studied by carrying out the analysis of the standard
drugs at two different concentrations in the linearity range of the drugs for three
times on the same day and %RSD was calculated, table 18.
Table 18: Intraday precision
Concentration Peak Area %RSD
Metformin Teneligliptin Metformin Teneligliptin
100 (µg/ml) Metformin
4 (µg/ml) Teneligliptin
5123139 60866
0.88 0.46
5173112 61212
5214763 61427
125 (µg/ml) metformin
5 (µg/ml) Teneligliptin
6299618 78644
0.98 0.29
6279424 79109
Experimental Section
ii) Inter-day precision
Inter-day precision was studied by carrying out the analysis of the standard
drugs at two different concentrations in the linearity range of the drugs for three
days over a period of one week and %RSD was calculated, table 19.
Table 19: Inter-day precision
Concentration Peak Area % RSD
Metformin Teneligliptin Metformin Teneligliptin
100 (µg/ml) Metformin
4 (µg/ml) Teneligliptin
5172965 62792
0.65 0.19
4967626 62553
5027176 62720
125 (µg/ml) Metformin
5 (µg/ml) Teneligliptin
6188947 79957
0.71 1.15
6203468 79833
6271502 78311
iii) Repeatability
a) Repeatability of injection
Standard drug solution was injected six times and its %RSD was
calculated, table 20.
Table 20: Repeatability of injection
Concentration
Peak Area %RSD
Metformin Teneligliptin Metformin Teneligliptin
125 (µg/ml)
Metformin 5 (µg/ml)
Teneligliptin
6278397 79627
0.09 0.43
6276164 79874
6279061 78968
6279365 79738
6266020 79736
Experimental Section
Department of Pharmaceutical Analysis
5. Stability
The standard drug solutions were subjected to stability studies under room
temperature and refrigerated conditions. Stability of solutions were analysed by
looking for any changes in retention time, resolution, peak shape etc. The drug
solutions were found to be stable for 5 hours at room temperature and 24 hours at
[image:67.595.114.503.296.537.2]refrigerated conditions, fig. 46 and 47.
Experimental Section
Fig. 47: Stability of the analyte at refrigerator
6. Robustness
The concept of robustness of an analytical procedure has been defined by
the ICH as a measure of its capacity to remain unaffected by small, but deliberate
variations in method parameters. Important parameters in the method were
systemically varied and their effect on separation was measured as follows:-
± 0.1 units of flow rate (fig. 48)
± 2 units of mobile phase ratio (fig. 49)
Experimental Section
[image:69.595.110.507.107.738.2]Department of Pharmaceutical Analysis
Fig. 48: Effect of flow rate
Experimental Section
Fig. 50: Effect of pH
7. Specificity (forced degradation studies)
Sample degradation is also a technique for assessing specificity by
deliberately degrading the sample and to look for the appearance of other peaks in
the chromatogram. Here, the drugs were subjected to acid degradation
(0.5 N HCL), base degradation (0.5 N NaOH), oxidative degradation (3% H2O2)
and neutral conditions to achieve 10 to 20% degradation from the initial material.
Procedure
The stress testing was conducted as per ICH guidelines.
Forced degradation for the drugs were carried out under acid hydrolysis,
base hydrolysis, oxidative stress conditions and neutral conditions.
Drug at concentration 1 mg/ml was used in all degradation studies.
In each study, blank and control (zero hour sample) were used to compare
Experimental Section
Department of Pharmaceutical Analysis
There were four samples prepared in each stress test
1. Blank solution stored under normal condition
2. Blank solution subjected to stress like the drug
3. Zero time sample containing the drug which is stored under normal
condition (control) and
4. Drug solution subjected to stress
i. Hydrolytic studies
a. Acidic condition
The solution was prepared by dissolving the drugs in methanol and the
drugs were subjected to accelerated degradation under acidic condition with
0.5 N HCL and the sampling was done at every 15 minutes till sufficient
[image:71.595.131.517.388.642.2]degradation was achieved, fig. 51 – 53.
Experimental Section
Fig. 52: Peak purity view of metformin
Experimental Section
Department of Pharmaceutical Analysis
b. Alkaline condition
The drugs were dissolved in methanol and the drug was subjected to
accelerated degradation under alkaline condition with 0.5 N NaOH and the
sampling was done at every 15 minutes till sufficient degradation was
achieved. The resulting solution was neutralized, appropriately diluted and
[image:73.595.124.505.287.531.2]chromatograms were recorded, fig. 54 – 56.
Experimental Section
Fig. 55: Peak purity view of metformin
Experimental Section
Department of Pharmaceutical Analysis
c. Oxidative studies
Oxidation studies were performed in 3% H2O2 at room temperature. The
resulting solution was appropriately diluted and chromatograms were
recorded, fig. 57 – 59.
Fig. 57: Chromatogram of drug solution in oxidative condition
Experimental Section
Fig. 59: Peak purity view of teneligliptin
d. Neutral condition
The drugs were dissolved in methanol and the solution was stored at room
temperature and analysed periodically, fig. 60 – 62.
[image:76.595.121.486.485.736.2]Experimental Section
[image:77.595.111.499.160.381.2]Department of Pharmaceutical Analysis
Fig. 61: Peak purity view of metformin
Experimental Section
In all degradation studies, there was no corresponding formation of
degradation products except oxidation studies when compared to the standard
solution of the drug. Photo diode array detection was used as an evidence of the
specificity of the method and to evaluate the homogeneity of the drug peak.
Chromatographic peak purity data was obtained from the spectral analysis report
and peak purity index values close to 1 indicates homogenous peaks thus
establishing the specificity of the assay method.
8. System suitability parameters
The USP defines parameters that can be used to determine system
suitability prior to analysis. These parameters include plate number (N), tailing
factor (Tf), capacity factor (k`), resolution (Rs) and relative standard deviation of
peak area for repetitive injections, table 21.
Table 21: System suitability studies
Drug name Number of theoretical plates (N) Tailing Factor
(Tf)
Capacity factor (k`) Resolution (Rs) Relative standard deviation of peak area (%RSD)
METFORMIN 1652 1.3
0.657 4.746
0.09
Experimental Section
Department of Pharmaceutical Analysis
ANALYSIS OF FORMULATION
1. Preparation of stock solution
A stock solution of metformin (2500 µg/ml) and teneligliptin (100 µg/ml)
was prepared in methanol.
2. Preparation of sample solution
Ten tablets each containing 500 mg of metformin and 20 mg of
teneligliptin were taken for the studies and the average weight was determined.
Amount of powder equivalent to 125 mg of metformin and 5 mg of teneligliptin
was taken and transferred to a 50 ml volumetric flask, and 25 ml methanol was
added. The contents of the flask were shaken for 10 minutes, followed by dilution
to volume with methanol to provide a solution containing 2500 µg/ml of
metformin and 100 µg/ml of teneligliptin. This solution was filtered through a
0.45 mm membrane filter before injection.
3. Recording the chromatogram
A steady baseline was recorded with the fixed chromatographic conditions
and 20 L of standard drug solutions and sample solutions were injected and
chromatograms were recorded, fig. 63-72. Calibration curve was plotted using the
standard drug peak area versus concentration of standard solutions. The results of
formulation analysis are given in, table 22.
Table 22: Analysis of formulation
Drug
Amount of drug
(mg/tablet) % Label
claim %RSD*
Labelled Found
Zita met plus (Teneligliptin 20 mg & Metformin 500mg)
20 mg 19.71 mg 98.55 1.42
500 mg 483.33 mg 96.66 1.14
Experimental Section
[image:80.595.113.497.189.421.2]STANDARD CHROMATOGRAMS
Fig. 63: Chromatogram of standard 1 (MET 25μg/ml; TENE 1 μg/ml)
[image:80.595.117.503.467.729.2]Experimental Section
[image:81.595.124.493.159.397.2]Department of Pharmaceutical Analysis
Fig. 65: Chromatogram of standard 3 (MET 75μg/ml; TENE 3 μg/ml)
[image:81.595.116.497.431.735.2]Figure


Related documents
Development and validation of RP-HPLC method for the simultaneous estimation of Domperidone and Naproxen in tablet dosage form, Journal of Applied. Pharmaceutical Sciences,
SIMULTANEOUS ESTIMATION OF REPAGLINIDE AND METFORMIN HYDROCHLORIDE IN TABLET DOSAGE FORM BY REVERSE PHASE HIGH PERFORMANCE LIQUID CHROMATOGRAPHY.. Dissertation
the determination of Letrozole in tablet dosage form by using a HPTLC
However, the development of simultaneous estimation of Teneligliptin and Metformin in combined dosage.. form by RP-HPLC method has not yet been
Method Development and Validation for Simultaneous estimation of Metformin Hcl and Sitagliptin by RP-HPLC in Tablet Dosage Form Sudheer Kumar Sapavat*1, V.Mohan goud 2 J.V.C
ABSTRACT: A stability indicating UPLC method was developed and validated for the determination of Teneligliptin Hydrobromide and Metformin Hydrochloride in bulk
ABSTRACT: A rapid and accurate HPLC method was developed for determination of both metformin hydrochloride and pioglitazone hydrochloride in tablet dosage form.. An
Spectrophotometric and reversed-phase high-performance liquid chromatographic methods for simultaneous determination of escitalopram oxalate and clonazepam in combined tablet
