DEVELOPMENT OF ANALYTICAL METHODS FOR THE
SIMULTANEOUS ESTIMATION OF LAFUTIDINE AND
DOMPERIDONE IN TABLET DOSAGE FORM
The Tamil Nadu Dr. M.G.R. Medical University
In partial
GARLAPATI VAMSI KRISHNA
Prof. (Dr.) T. VETRICHELVAN, M. Pharm., Ph.D.
Department of Pharmaceutical Analysis
ADHIPARASAKTHI COLLEGE OF PHARMACY
(Accredited By “NAAC
EVELOPMENT OF ANALYTICAL METHODS FOR THE
SIMULTANEOUS ESTIMATION OF LAFUTIDINE AND
DOMPERIDONE IN TABLET DOSAGE FORM
Dissertation Submitted to
The Tamil Nadu Dr. M.G.R. Medical University Chennai - 600032
fulfillment for the award of the Degree of MASTER OF PHARMACY
(Pharmaceutical Analysis) Submitted by
GARLAPATI VAMSI KRISHNA Register No: 26106123 Under the Guidance of
Prof. (Dr.) T. VETRICHELVAN, M. Pharm., Ph.D., Principal & Head
Department of Pharmaceutical Analysis
ADHIPARASAKTHI COLLEGE OF PHARMACY
NAAC” with CGPA of 2.74 on a Four point Scale at “B”
MELMARUVATHUR – 603319
MAY – 2012
EVELOPMENT OF ANALYTICAL METHODS FOR THE
SIMULTANEOUS ESTIMATION OF LAFUTIDINE AND
DOMPERIDONE IN TABLET DOSAGE FORM
,
ADHIPARASAKTHI COLLEGE OF PHARMACY
CERTIFICATE
This is to certify that the research work entitled “DEVELOPMENT OF
ANALYTICAL METHODS FOR THE SIMULTANEOUS ESTIMATION OF
LAFUTIDINE AND DOMPERIDONE IN TABLET DOSAGE FORM”
submitted to The Tamil Nadu Dr. M.G.R Medical University in partial fulfillment for
the award of the Degree of Master of Pharmacy (Pharmaceutical Analysis) was
carried out by GARLAPATI VAMSI KRISHNA (Register No: 26106123) in the Department of Pharmaceutical Analysis under my direct guidance and supervision
during the academic year 2011-2012.
Place: Melmaruvathur Prof. (Dr.) T. VETRICHELVAN, M. Pharm., Ph.D.,
Date: Principal & Head,
Department of Pharmaceutical Analysis,
Adhiparasakthi College of Pharmacy,
CERTIFICATE
This is to certify that the research work entitled “DEVELOPMENT OF ANALYTICAL METHODS FOR THE SIMULTATNEOUS ESTIMATION OF
LAFUTIDINE AND DOMPERIDONE IN TABLET DOSAGE FORM”
submitted to The Tamil Nadu Dr. M.G.R Medical University in partial fulfillment for
the award of the Degree of Master of Pharmacy (Pharmaceutical Analysis) was
carried out by GARLAPATI VAMSI KRISHNA (Register No: 26106123) in the Department of Pharmaceutical Analysis, Adhiparasakthi College of Pharmacy,
Melmaruvathur which is affiliated to The Tamil Nadu Dr. M.G.R. Medical
University, Chennai, under the guidance of Prof. (Dr.) T.VETRICHELVAN, M. Pharm., Ph.D., Department of Pharmaceutical Analysis, Adhiparasakthi College of Pharmacy, during the academic year 2011-2012.
Place: Melmaruvathur Prof. (Dr.) T. VETRICHELVAN, M. Pharm., Ph.D.,
Date: Principal & Head,
Department of Pharmaceutical Analysis,
Adhiparasakthi College of Pharmacy,
ACKNOWLEDGEMENT
First and foremost, I wish to express my deep sense of gratitude to his Holiness ARULTHIRU AMMA for his ever growing Blessings in each step of my study. I am grateful to THIRUMATHI LAKSHMI BANGARU ADIGALAR, Vice President, ACMEC Trust, Melmaruvathur, for given me an opportunity and encouragement for the way in completing the study.
With great respect and honor, I extend my thanks to our Managing trustee SAKTHI G.B. ANBALAGAN, Adhiparasakthi College of Pharmacy, Melmaruvathur for his excellence in providing skillful and compassionate spirit of unstinted support to our department for carrying out research work entitled “DEVELOPMENT OF ANALYTICAL METHODS FOR THE SIMULTATNEOUS ESTIMATION OF LAFUTIDINE AND DOMPERIDONE IN TABLET DOSAGE FORM”.
On a personal note I wish to avail my deep sense of thanks to Prof. (Dr.) T. VETRICHELVAN, M. Pharm., Ph.D., Principal, Adhiparasakthi
College of Pharmacy, for all the support offered by him during the period of my entire dissertation work, I wish to sincerely record my deepest gratitude and thanks for his kind cooperation and initiative guidance, constructive criticism with enthusiastic encouragement which enabling me to complete this project work successfully.
I have great pleasure in express my sincere heartfelt thanks to Mr. K. ANANDHA KUMAR, M. Pharm., Assistant Professor, Mrs. D. NAGAVALLI, M. Pharm., Ph.D., Professor, Mrs. G. ABIRAMI,
My sincere thanks to our lab assistants Mr. M. GOMATHI SHANKAR, D. Pharm., and Mrs. S. KARPAGAVALLI, D. Pharm., for their kind help throughout this work.
My sincere thanks to Mrs. PRATHIMA MATHUR, Managing Director, Pharma Information Centre, Chennai for helping in the literature collection.
I am indeed very much thankful to the librarian Mr. M.SURESH, M.L.I.S., for providing all reference and literature for the completion of this project.
I am grateful to my classmates for their pleasant working atmosphere and discussion during the work.
A special thanks to my ever loving College staffs, friends, seniors and juniors for their kind moral support during my work.
Finally, I gratefully forward my affectionate thanks to my Mother Mrs. GARLAPATI DHANAMMA, and Brother Mr. GARLAPATI MAHESH.
I take privilege to express my heartfelt to all the dignitaries who have been involved directly (or) indirectly with the successfully completion of this dissertation.
DEDICATED TO
MY FAMILY
&
CONTENTS
SECTION TITLE Page
No.
1. INTRODUCTION
1.1 Introduction to Analytical Chemistry 1
1.5 Spectroscopy 6
1.9 High Performance Liquid Chromatography 19
1.10 Validation 23
1.12 System suitability test parameters 28
1.13 Basic statistical parameters 30
2. LITERATURE REVIEW
2. 1 Drug profile 34
2.3 Reported methods 38
3. AIM AND PLAN OF WORK 44
4. MATERIALS AND METHODS
4.1 Materials 46
4.2 Methods 49
4.2.1 Simultaneous equation method 49
4.2.2 Area under curve method 49
4.2.3 Reverse Phase-HPLC method 53
5. RESULTS AND DISCUSSION
5.1 Simultaneous equation method 58
5.2 Area under curve method 61
5.3 Reverse Phase-HPLC method 63
6. SUMMARY AND CONCLUSION
6.1 Simultaneous equation method 66
6.2 Area under curve method 66
6.3 Reverse Phase-HPLC method 66
LIST OF FIGURES
FIGURE
No. SUBJECT
1 IR SPECTRUM OF LAFUTIDINE
2 IR SPECTRUM OF DOMPERIDONE
3. UV SPECTRUM OF LAFUTIDINE IN METHANOL 4. UV SPECTRUM OF DOMPERIDONE IN METHANOL
5. UV OVERLAIN SPECTRA OF LAFUTIDINE AND DOMPERIDONE IN METHANOL
6. CALIBRATION CURVE OF LAFUTIDINE IN METHANOL AT 273 nm SIMULTANEOUS EQUATION METHOD
7.
CALIBRATION CURVE OF LAFUTIDINE IN METHANOL AT 287.5 nm SIMULTANEOUS EQUATION METHOD
8.
C CALIBRATION CURVE OF DOMPERIDONE IN METHANOL AT 273 nm SIMULTANEOUS EQUATION METHOD
9.
CALIBRATION CURVE OF DOMPERIDONE IN METHANOL AT 287.5 nm SIMULTANEOUS EQUATION METHOD
10.
CALIBRATION CURVE OF LAFUTIDINE IN METHANOL BETWEEN 276 and 271 nm AREA UNDER CURVE METHOD
11.
CALIBRATION CURVE OF LAFUTIDINE IN METHANOL BETWEEN 291 and 282 nm AREA UNDER CURVE METHOD
12.
CALIBRATION CURVE OF DOMPERIDONE IN METHANOL BETWEEN 276 and 271 nm AREA UNDER CURVE METHOD
13.
FIGURE
No. SUBJECT
14. INITIAL SEPERATION CONDITIONS IN METHANOL:WATER (50:50 % v/v)
15.
EFFECT OF RATIO OF MOBILE PHASE METHANOL:AMMONIUM ACETATE BUFFER (50:50 % v/v)
16.
EFFECT OF RATIO OF MOBILE PHASE METHANOL:AMMONIUM ACETATE BUFFER (60:40 % v/v)
17. OPTIMIZED CHROMATOGRAM OF LAFUTIDINE IN MOBILE PHASE METHANOL:AMMONIUM ACETATE BUFFER (85:10 %V/V)
18. OPTIMIZED CHROMATOGRAM OF DOMPERIDONE IN MOBILE PHASE METHANOL:AMMONIUM ACETATE BUFFER (85:10 %V/V)
19. OPTIMIZED CHROMATOGRAM OF LAFUTIDINE AND DOMPERIDONE IN MOBILE PHASE METHANOL:AMMONIUM ACETATE BUFFER (85:10%V/V)
20. LINEARITY CHROMATOGRAM OF LAFUTIDINE AND DOMPERIDONE, (35, 105 µg/ ml)
21. LINEARITY CHROMATOGRAM OF LAFUTIDINE AND DOMPERIDONE, (40, 120 µg/ ml)
22. LINEARITY CHROMATOGRAM OF LAFUTIDINE AND DOMPERIDONE, (45, 135 µg/ ml)
23. LINEARITY CHROMATOGRAM OF LAFUTIDINE AND DOMPERIDONE, (50, 150 µg/ ml)
24. LINEARITY CHROMATOGRAM OF LAFUTIDINE AND DOMPERIDONE, (55, 165 µg/ ml)
25. LINEARITY CHROMATOGRAM OF LAFUTIDINE AND DOMPERIDONE, (60, 180 µg/ ml)
26. LINEARITY CHROMATOGRAM OF LAFUTIDINE AND DOMPERIDONE, (65, 195 µg/ ml)
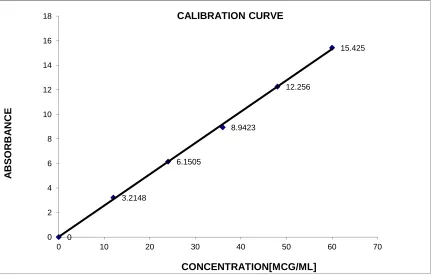
27. CALIBRATION CURVE OF LAFUTIDINE RP-HPLC 28. CALIBRATION CURVE OF DOMPERIDONE RP-HPLC
29. CHROMATOGRAM FOR ANALYSIS OF FORMULATION LAFAXID- D REPEATABILITY – 1 (80 % CONCENTRATION)
31. CHROMATOGRAM FOR ANALYSIS OF FORMULATION LAFAXID- D REPEATABILITY – 3 (80 % CONCENTRATION)
32.
CHROMATOGRAM FOR ANALYSIS OF FORMULATION LAFAXID- D REPEATABILITY – 4 (100 % CONCENTRATION)
33. CHROMATOGRAM FOR ANALYSIS OF FORMULATION LAFAXID- D REPEATABILITY – 5 (100 % CONCENTRATION)
34. CHROMATOGRAM FOR ANALYSIS OF FORMULATION LAFAXID- D REPEATABILITY – 6 (100 % CONCENTRATION)
35. CHROMATOGRAM FOR ANALYSIS OF FORMULATION LAFAXID- D REPEATABILITY – 7 (120 % CONCENTRATION)
36. CHROMATOGRAM FOR ANALYSIS OF FORMULATION LAFAXID- D REPEATABILITY – 8 (120 % CONCENTRATION)
37. CHROMATOGRAM FOR ANALYSIS OF FORMULATION LAFAXID- D REPEATABILITY – 9 (120 % CONCENTRATION)
38. CHROMATOGRAM FOR FIRST RECOVERY OF FORMULATION LAFAXID- D (110 % CONCENTRATION)
39. CHROMATOGRAM FOR SECOND RECOVERY OF FORMULATION LAFAXID- D (120 % CONCENTRATION)
LIST OF TABLES
TABLE
No. SUBJECT
1. SOLUBILITY PROFILE OF LAFUTIDINE AND DOMPERIDONE IN POLAR AND NON-POLAR SOLVENTS
2. OPTICAL CHARACTERISTICS OF LAFUTIDINE SIMULTANEOUS EQUATION METHOD
3. OPTICAL CHARACTERISTICS OF DOMPERIDONE SIMULTANEOUS EQUATION METHOD
4. QUANTIFICATION OF FORMULATION (LAFAXID- D) SIMULTANEOUS EQUATION METHOD
5. INTRADAY AND INTERDAY ANALYSIS OF FORMULATION (LAFAXID- D)
SIMULTANEOUS EQUATION METHOD
6. RUGGEDNESS STUDY (LAFAXID- D) SIMULTANEOUS EQUATION METHOD
7. RUGGEDNESS STUDY (LAFAXID- D) SIMULTANEOUS EQUATION METHOD
8. RUGGEDNESS STUDY (LAFAXID- D) SIMULTANEOUS EQUATION METHOD
9. RUGGEDNESS STUDY (LAFAXID- D) SIMULTANEOUS EQUATION METHOD
10. RECOVERY ANALYSIS (LAFAXID- D) SIMULTANEOUS EQUATION METHOD
[image:11.595.82.523.106.717.2]12. OPTICAL CHARACTERISTICS OF DOMPERIDONE AREA UNDER CURVE METHOD
13. QUANTIFICATION OF FORMULATION (LAFAXID- D) AREA UNDER CURVE METHOD
14. INTRADAY AND INTERDAY ANALYSIS OF FORMULATION (LAFAXID- D) AREA UNDER CURVE METHOD
15. RUGGEDNESS STUDY (LAFAXID- D) AREA UNDER CURVE METHOD
16. RUGGEDNESS STUDY (LAFAXID- D) AREA UNDER CURVE METHOD
17. RUGGEDNESS STUDY (LAFAXID- D) AREA UNDER CURVE METHOD
18. RUGGEDNESS STUDY (LAFAXID- D) AREA UNDER CURVE METHOD
19. RECOVERY ANALYSIS (LAFAXID- D) AREA UNDER CURVE METHOD
20. SYSTEM SUITABILITY TEST PARAMETERS FOR THE OPTIMIZED CHROMATOGRAM RP-HPLC
21. OPTICAL CHARACTERISTICS OF LAFUTIDINE AND DOMPERIDONE RP-HPLC
22. QUANTIFICATION OF TABLET FORMULATION (LAFAXID- D) RP-HPLC
LIST OF ABBREVIATIONS USED
ICH - International Conference on Harmonization
λ - Lambda
LOD - Limit of Detection
LOQ - Limit of Quantification
µg/ ml - Microgram Per Milliliter
mg/ tab - Milligram Per tablet
mL - Millilitre
mM - Milli Mole
nm - Nanometer
pH - Negative Logarithm of Hydrogen Ion Concentration
% - Percentage
% RSD - Percentage Relative Standard Deviation
RP-HPLC - Reverse Phase - High Performance Liquid Chromatography
Rt or t R - Retention Time
S.D. - Standard Deviation
S.E - Standard Error
UV-VIS - Ultraviolet - Visible
IR - Infra Red
AUC - Area Under Curve °
C - Degree Celsius
µl - Microlitre
rpm - Rotations Per Minute
µ - Micron
v/v - Volume/Volume
min - Minute
mL/min - Milliliter/Minute
LAF - Lafutidine
DOM - Domperidone
INTRODUCTION
1. PHARMACEUTICAL ANALYSIS
(Sethi et al., 2003, Gurdeep R. Chatwal et al., 2007)
Pharmaceutical Analysis comprises those procedures necessary to determine the identity, strength, quality and purity of pharmaceuticals.
It got two branches: Quality Control Quality Assurance Quality control
It is primarily designed to detect and correct defects or checking to demonstrate whether the anticipated results are complied with.
Quality assurance
It is oriented towards preventing defects from occurring. It is a managerial function which prevents problems by heading them off and by advising restraints and redirection at the proper time and level.
1.1ANALYTICAL CHEMISTRY ( Anjaneyulu et al., 2006) A scientific discipline that develops and applies methods, instrument and strategies to obtain information on the composition and nature of matter in space and time.
1.1.1 BRANCHES OF ANALYTICAL CHEMISTRY Biology
Geology Chemistry
Social science Medicine Engineering Physics Agriculture
1.1.2 DISCIPLINES OF ANALYTICAL CHEMISTRY There are two types of analysis. Those are as follows:
Qualitative analysis Quantitative analysis 1.1.2.1 Qualitative analysis
This is practiced in order to establish the composition of naturally occur, artificially synthesized or manufactured substances.
1.1.2.2 Quantitative analysis
There are several methods for quantitative analysis such methods are as mentioned below.
1.1.3 Chemical methods 1.1.4 Titrimetric analysis
The titrimetric methods are considered superior to gravimetric methods the analysis is similarly based on equivalent weight of one substance reacts quantitatively with the other.
i. Acid-base titrations ii. Non-aqueous titrations iii. Redox titrations iv. Precipitation titrations
1.1.5 Gravimetric analysis
The method involves the conversion of the element or a radical to be determined into a pure stable compound, readily convertible into a form suitable for weighing.
1.1.6 Gasometric analysis
The gases like Cyclopropane, Carbondioxide, Nitrous oxide, Oxygen, Octyl nitrate, Nitrogen, Amylnitrate, Ethylene and Helium are determined by Gasometric analysis. The measurement of volume of gas is usually done by means of gas buretts (or) nitrometers.
1.1.7 Physicochemical methods
These methods are mainly used for the measurement of certain physical properties and to determine the contents or composition of a substance. They are employed for the determination of trace concentrations of elements in preference to the sample. These are preferred due to their selectivity, simplicity, speed of analysis and accuracy than other methods. Most of the methods make use of standards having in the known amount of the constituents serves as the basis of comparison in the instrument. The changes in the properties of system detected by measurement of current, potential, electrical conductivity, specific rotation and refractive index.
1.1.8 Microbiological methods
compared with the known concentration of the antibiotic standard preparation having known activity. Widely used methods are cup plate method and tube assay method.
1.1.9 Biological methods
When the potency of the drug or its derivative cannot be properly determined by physical or chemical methods, and where it is possible to observe the biological effects of the drug on some type of living matter, the biological assays are carried out on the basis of such assays is to determine how much of sample gives the same biological effect as a given quantity of the standard preparation. The sample and standard tested under identical conditions in all respect. In a typical bio-assay, a stimulus is applied to a subject. The intensity of stimulus applied to a subject is referred to as the dose and is indicated by a weight or in terms of the concentration of the preparation. The application of a stimulus on a subject produces some observable effect and this is called the response. The response may be measured by the total weight or weight of some organ of the subject, blood sugar concentration, diameter of inhibition zone or by some other physiological symptoms.
1.2 Factors Affecting the Choice of Analytical Methods (Mendham et al., 2002)
Analytical techniques have different techniques of sophistication, sensitivity, selectivity requires different cost and time. Analyst should select best procedure for a given determination.
The form of chemical analysis required.
Difficulty arising from the nature of the substance
Feasible interference from apparatus of the material other than those of interest. The concentration range which needs to be examined.
The amenities available.
The time necessary for total analysis.
Analogous type of investigation performed.
1.3 ANALYTICAL METHOD BASED ON MEASUREMENT OF
PROPERTY (Gurdeep R. Chatwaal et al., 2007)
S.No Physical property Analytical methods based on measurement of property
1. Mass Gravimetric
2. Volume Volumetric
3. Electrical potential Electrical resistance Electrical current Electrical charge
Potentiometry, Chronopotentiometry. Conductometry.
Polarography, Amperometry. Columetry.
4. Absorption of radiation Spectrophotometry
5. Emission of radiation Emission spectroscopy, flame photometry, fluorescence, radio chemical methods
6. Scattering of radiation Turbidimetry, Nephelometry, Raman spectroscopy
7. Refraction of radiation Refractometry, Interferometry
8. Rotation of radiation Polarimetry, Optical rotatory dispersion
9. Diffraction of radiation X-ray electron diffraction methods
10. Mass to charge ratio Mass spectrometry
1.4 APPLICATIONS OF ANALYTICAL CHEMISTRY
(Anjaneyulu et al., 2006) 1. Helping to save lives
2. Consumer and Enviroment protection 3. Farming support
4. Crime prevention and detection 5. Maintain fair play
1.5 UV-SPECTROSCOPY (Gurdeep R. Chatwal et al., 2007) Ultraviolet absorption spectra arise from transition of electrons within a molecule or an ion from a lower to higher electronic energy levels and the ultraviolet emission spectra arise from the reverse type of transition. For radiation to cause electronic excitation, it must be in the UV region of the electromagnetic spectrum.
Ultraviolet region produces changes in the electronic energy of the molecule resulting from transitions of valence electrons in the molecule. Three different types of electrons are involved in organic molecules. They are follows,
I. σ - electrons
These electrons are involved in saturated bonds, such as those between carbons and hydrogen in paraffins.
II. π - electrons
These electrons are involved in unsaturated hydrocarbons. Typical compounds with π bonds are trienes and aromatic compounds.
III. n - electrons
1.5.1 Electronic transitions (Sharma, 2007)
A molecule is excited by the absorption of energy (UV or Visible light). Its electrons are promoted from a bonding to an anti bonding orbital.
i. The antibonding orbital which is associated with the excitation of σ electrons is called σ* anti bonding orbital. So σ σ* transition take place when σ (sigma) electron is promoted to antibonding (σ*) orbital. It is represented as
σ σ* transition.
ii. When a non-bonding electron gets promoted to an antibonding sigma orbital (σ*) then it represents n σ* transition.
iii. Similarly π π* transition represents the promotion of π electrons to an antibonding π* orbital.
iv. When an n- electron (non- bonding) is promoted to anti bonding π* orbital. It represents π π* transition.
1.5.2 Electronic excitation energies a) σ σ* transition
The organic compounds in which all the valence shell electrons are involved in the formation of sigma bonds do not show absorption in the normal ultraviolet region, but occur in vacuum UV region (125-135 nm).
E.g. Methane, Ethane, Propane, Cyclopropane. b) n σ* transition
This type of transition takes place in saturated compounds containing one hetero atom with unshared pair of electrons (n electrons).
E.g. Alcohol, Ethers, Amines, etc.
c) π π* transition
This type of transition occurs in the unsaturated centers of the molecule in compounds containing double or triple bonds and also in aromatics. The excitation of π electrons requires smaller energy and hence, transition of this type occurs at longer
wavelength.
E.g. Alkenes, Alkynes, Aromatic compounds, etc. d) n π* transition
In this type of transition an electron of unshared electron pair on hetero atom gets excited to π* antibonding orbital. This type of transition requires least amount of energy out of all the transitions.
1.5.3 Laws of absorption (Gurdeep R. Chatwal et al., 2007) There are two fundamental laws related to the absorption of monochromatic radiant energy by homogeneous transparent systems. These are Beer’s Law and Lambert’s Law.
1.5.4 Beer’s law
The intensity of a beam of monochromatic light decreases exponentially with the increase in concentration of the absorbing substance arithmetically.
I = I0e-kc
Where, I0 = intensity of incident light I = Intensity of emerged light 1.5.5 Lambert’s law
When a beam of light of light is allowed to pass through a transparent medium, the rate of decrease in the intensity of transmitted light with the thickness of medium is directly proportional to the intensity of the incident light.
−
From these laws, the following empirical expression – Beer and Lambert’s Law A= Єct
Where, A= Absorbance or optical density or extinction co-efficient Є = Molecular extinction co-efficient
c = Concentration of drug t = Path length
1.5.6 Limitations of Beer - Lambert’s law (Sharma, 2007)
1. When different forms of the absorbing molecules are in equilibrium as in keto-enol tautomers.
2. When fluorescence compounds are present.
3. When solute and solvent forms complex through some sorts of association. 1.5.7 Deviations from Beer’s law (Gurdeep R. Chatwal et al., 2007)
From Beer’s law it follows that if we plot absorbance against concentration, a straight line passing through the origin should be obtained. But there is usually a deviation from a linear relationship between concentration and absorbance and an apparent failure of Beer’s law may ensure. Deviations from the law are reported as positive or negative according to whether the resultant curve is concave upwards or concave downwards.
Deviations from Beer’s law can arise due to the following factors:
affect light absorption and may also alter the value of the extinction coefficient.
II. Deviations may also occur due to the presence of impurities that fluoresce or absorb at the absorption wavelength. This interference introduces an error in the measurement of absorption of radiation penetrating the sample.
III. Deviations may occur if monochromatic light is not used.
IV. Deviations may occur if the width of slit is not proper and, therefore, it allows undesirable radiations to fall on the detector. These desirable radiations might be absorbed by impurities present in the sample which would cause an apparent change in the absorbance of the sample.
V. Beer’s law cannot be applied to suspensions but the latter can be estimated calorimetrically after preparing a reference curve with known concentration. 1.6 Choice of Solvent (Gurudeep R Chatwal et al., 2007)
Solvent used of ultraviolet spectroscopy should posses the following activities
Solvent under region of investigation should not absorb radiation Polarity of solvent should not influence solute molecules.
High purity of solvent should be maintained.
1.6.1 List of Common Solvents Used in UV-Spectroscopy (Willam Kemp, 1996)
S. No. SOLVENT CUT OFF WAVELENGTH (nm)
1 Water 190
2 Ethanol 205
1.6.2 Solvent effects : The solvent
1. If absorbing substance is non polar, the effect of solvent is mainly determined by the refractive index of solvent
2. The dipole movement of the solvent is mainly responsible for the change in the position of absorption band
3. The diene systems are however independent of the solvent polarity
4. The absorption maximum for polar compounds is usually shifted with the change in the polarity of solvent.
1.7 Instrumentation
(Anonymous. 4 Hexane 5 Cyclohexane 6 Diethyl ether 7 Chloroform 8 Carbon tetra chloride
9 DMF
10 Acetone
1.6.2 Solvent effects :
The absorption maximum is also influenced by the nature of
If absorbing substance is non polar, the effect of solvent is mainly determined by the refractive index of solvent
The dipole movement of the solvent is mainly responsible for the change position of absorption band
The diene systems are however independent of the solvent polarity
The absorption maximum for polar compounds is usually shifted with the change in the polarity of solvent.
(Anonymous.www.upchurch.com.cn/images/TechInfo/hplcThumb.gif)
Hexane 210
Cyclohexane 210 Diethyl ether 220
Chloroform 245
Carbon tetra chloride 265
DMF 240
Acetone 330
absorption maximum is also influenced by the nature of
If absorbing substance is non polar, the effect of solvent is mainly
The dipole movement of the solvent is mainly responsible for the change
The diene systems are however independent of the solvent polarity
The absorption maximum for polar compounds is usually shifted with the
The following are the components of a typical UV–Visible spectrophotometer, a) Radiation source
b) Monochromator c) Sample holder d) Detector
e) Signal processor and readout
1.8 Quantitative analysis (Beckett and Stenlake, 2007) The assay of an absorbing substance may be quickly carried out by preparing a solution in a transparent solvent and measuring its absorbance at a suitable wavelength. The wavelength normally selected is a wavelength of maximum absorption (λmax), where small errors in setting the wavelength scale have little effects on the measured absorbance.
a. Assay of substances in single component samples
Quantitative analysis (assay of an absorbing substance) can be done using following methods.
i. Use of a standard absorptivity values
This method can be used for estimation of drug from formulations or raw material, when reference standard not available. The use of standard A (1 %, 1 cm) value avoids the need to prepare a standard solution of the reference substance in order to determine its absorptivity, and is of advantage in situations where it is difficult or expensive to obtain a sample of the reference substance.
ii. Use of calibration graph
of the analyte in the sample solution is read from the graph as the concentration corresponding to the absorbance of the solution. Calibration data are essential if the absorbance has a non-linear relationship with concentration, or if the absorbance or linearity is dependent on the assay conditions. In certain visible spectrophotometric assays of colorless substances, based upon conversion to colored derivatives by heating the substance with one or more reagents, slight variation of assay conditions, e.g. pH, temperature and time of heating, may rise to a significant variation of absorbance, and experimentally derived calibration data are required for each set of samples.
iii. Single or double point standardization
The single point procedure involves the measurement of the absorbance of a sample solution and of a standard solution of the reference substance. The standard and the sample solution are prepared in similar manner; ideally the concentration of the standard solution should be close to that of the sample solution. The concentration of the substance in the sample is calculated using following formula.
Ctest = A test × Cstd / Astd Where,
Ctest and Cstd are the concentration in the sample and standard solutions respectively.
Atest and Astd are the absorbance of the sample and standard solutions respectively.
(Atest – Astd1)(Cstd1-Cstd2) +Cstd1 (Astd1-Astd2) Ctest =
Astd1-Astd2 Where,
Cstd is the concentration of the standard solution.
Atest and Astd are the absorbance of the sample and standard solution respectively. Std1 and std2 are the more concentrated standard and less concentrated standard respectively.
b. Assay of substances in multi component samples
The spectrophotometric assay of drugs rarely involves the measurement of absorbance of samples containing only one absorbing component. The pharmaceutical analyst frequently encounters the situation where the concentration of one or more substances is required in samples known to contain other absorbing substances which potentially interfere in the assay. Unwanted absorption from these sources is termed irrelevant absorption and if not removed, imparts systematic errors to the assay of the drug in the sample. A number of modifications to the simple spectrophotometric procedure for single-component samples are available to the analyst, which may eliminate certain sources of interferences and permit the accurate determination of one or all of the absorbing components.
The basis of all the spectrophotometric technique for multicomponent samples is the property that at all wavelengths:
a) The absorbance of a solution is the sum of absorbances of the individual components.
The determination of the multi-component samples can be done by using the following methods,
i. Simultaneous equations method. ii. Absorbance ratio method (Q-Analysis). iii. Geometric correction method.
iv. Orthogonal polynomial method. v. Difference spectrophotometry. vi. Derivative spectrophotometry. vii. Chemical derivatisation. i. Simultaneous equation method
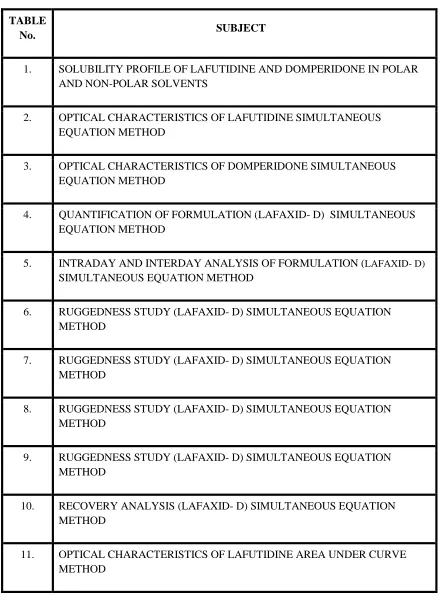
If a sample contains two, absorbing drugs (X and Y) each of which absorbs at the λmax of the other as shown in Fig, it may be possible to determine both drugs by the technique of simultaneous equations (Vierodt’s method).
The Information required is:
b) The absorptivities of Y at λ1 and λ2, ay1 and ay2, respectively
c) The absorbance of the diluted sample at λ1 and λ2, A1 and A2 respectively. Let Cx and Cy, be the concentrations of X and Y respectively in the diluted sample.
Two equations are constructed based upon the fact that at λ1 and λ2 the absorbance of the mixture is the sum of the individual absorbance’s of x and y,
At λ1 A1 = ax1bcx + ay1bcy --- (1) At λ2 A2 = ax2bcx + ay2bcy --- (2) For measurement in 1cm cells, b = 1.
Rearrange eq. (2)
Cy = A2– ax2cx ay2
Substituting for Cy in eq, (1) and rearranging gives
Cx = A2ay1 – A1ay2 (3) ax2ay1 – ax1ay2
and Cy = A1ax2 – A2ax1 (4)
ax2ay1 – ax1ay2
As an exercise we should derive modified equations containing a symbol (b) for path length, for application in situations where A1, and A2 are measured in cells other than 1 cm path length.
A2/A1 ay2/ay1 ax2/ax1 and A2/A1
satisfied only when the λmax of the two components are reasonably dissimilar. An additional criterion is that the two components do not interact chemically, thereby negating the initial assumption that the total absorbance is the sum of the individual absorbance. The additivity of the absorbance should always be confirmed in the development of a new application of this technique. The British Pharmacopoeia assay of quinine-related alkaloids and cinchonine-related alkaloids in cinchona bark is based upon this technique.
ii. Absorbance ratio method
The absorbance ratio method is a modification of the simultaneous equations procedure. It depends on the property that, for a substance which obeys Beer’s law at all wavelengths, the ratio of absorbances at any two wavelengths is a constant value independent of concentration or pathlength. For example, two different dilutions of the same substance give the same absorbance ratio A1/A2, 2.0. In the USP, this ratio is referred to as a Q value. The British Pharmacopoeia also uses a ratio of absorbances at specified wavelengths in certain confirmatory tests of identity. For example, Cyanocobalamin exhibits three λmax at 278 nm, 361 nm and 550 nm. The A361/A550 is required to be 3.30 ± 0.15 and the A361/A278 to be 1.79 ± 0.09.
iii. Geometric correction method
iv. Orthogonal polynomial method
The technique of orthogonal polynomials is another mathematical correction procedure which involves more complex calculations than the three – point correction procedure. The basis of the method is that an absorption spectrum may be represented in terms of orthogonal functions as follows:
A (λ) = p0 P0 (λ) + p1 P1 (λ) + p2 P2 (λ) . . . pn Pn (λ)
Where A denotes the absorbance at wavelength λ belonging to a set of n + 1
equally spaced wavelengths at which the orthogonal polynomials, P0(λ), P1(λ), P2(λ) . . . Pn(λ) are each defined.
v. Area under the curve method
From the spectra obtained for calculating the simultaneous equation, the area under the curve were selected at a particular wavelength range for both the drugs were each drug have its absorption. The “X” values of the drugs were determined at the selected AUC range. The “X” value is the ratio of area under the curve at the selected wavelength range with the concentration of the component in mg/ml. These “X” values were the mean of six independent determinations. A set of two simultaneous equations were obtained by using mean “X” values. And further calculations are carried out to obtain the concentration of each drug present in the sample.
vi. Derivative spectroscopic method
This method involves the conversion of the normal spectrum into first, second or higher derivative spectrum. The transformation that occurs in the derivative spectrum is understood by reference to a Gaussian band which represents an ideal absorption band.
against wavelength or a plot of dA/ dλ Vs λ1. At λ2 and λ4, the maximum positive and maximum negative slope respectively in the D°. Spectrums correspond with maximum and minimum respectively in the D1 spectrum. The λmax at λ3 is a
wavelength of zero slope and gives dA/d λ0, i.e., a cross-over point, in the D1 spectrum.
The first order derivative spectrum of absorption band is characterized by a maximum, a minimum and a cross-over at a λmax of the absorption band. These spectral transformations confer two main advantages on derivative spectrophotometry. Firstly an even order spectrum is of narrower spectral band width than its fundamental spectrum. Derivative spectrum shows better resolution of overlapping bands than the fundamental spectrum and may permit the accurate determination of λmax of the individual bands. Secondly, derivative spectroscopy discriminates in favors of the substances of narrow spectral bandwidth against broad band width substances.
1.9 INTRODUCTION TO HPLC METHODS OF ANALYSIS OF DRUGS IN
COMBINED DOSAGE FORM (Gurudeep R Chatwal et al., 2008) High performance liquid chromatography [HPLC] was developed in the late
1960’s and 1970’s it is widely accepted separation technique for both sample analysis and purification in a variety of areas including the pharmaceutical, biotechnological, environmental polymer and food industries.
HPLC instrumentation is made up of eight basic components they are mobile phase reservoir, solvent delivery system, sample introduction device, column,
detector, waste reservoir, connective tubing and a computer, integrator (or) recorder. Chromatography is defined as a method of separating a mixture of components into individual components through equilibrium distribution between two
components of a mixture move through a porous medium (stationary phase) under the influence of some solvent or gas (mobile phase).
The chromatographic method of a separation in general involves the following steps:
• Adsorption or retention of a substance or substance on the stationary phase.
• Separation of the adsorbed substance by the mobile phase.
• Recovery of the separated substance by a continuous flow of the mobile phase. The method being called elution.
• Quantitative and qualitative analysis of the eluted substance
1.9.1 Introduction to HPLC (Sharma, 2006) HPLC is a form of liquid chromatography to separate compounds that are
dissolved in solution. HPLC instrument consists of four basic parts
• The column
• Detector
• Injection system
• Mobile-phase pump system
1.9.2 Principle of separation in HPLC (Willard et al., 1986)
The principle of separation in normal phase and reverse phase mode is the adsorption. When a mixture of components is introduced in to a HPLC column, they travel according to their relative affinities towards the stationary phase. The component which has more affinity towards the adsorbent travels slower. The components which have less affinity towards the stationary phase travel faster. Since no two components have the same affinity towards the stationary phase the components are separated.
1.9.3 Modes of chromatography i. Normal phase mode ii. Reverse phase mode i. Normal phase chromatography
In normal phase mode, the stationary phase (silica gel) is polar in nature and the mobile phase is non-polar. In this technique non-polar compounds travel faster and eluted first. The silica structure is saturated with silicon groups at the end and ‘OH’ groups attached to silicon atoms are the active binding sites.
ii. Reverse phase chromatography
In reverse phase technique, a non polar stationary phase is used. The mobile phase is polar in nature hence polar components get eluted first and non-polar compounds are retained for a longer time. Since most of the drugs and pharmaceutical are polar in nature, they are not retained for a longer and eluted faster, which is advantageous. Different columns used are ODS (Octa DecylSilane) or C18, C8 and C4 etc.
1.9.4 Types of pumps
• Syringe Type Pump
• Constant Pressure Pump
1.9.5 Columns for HPLC (Willard et al., 1986)
The columns most commonly used are made from precision bore polished stainless steel tubing; typical dimensions are 10-30 cm long and 4 (or) 5 mm internal diameter. The stationary phase (or) packing is retained at each end by thin stainless steel frits with a mesh of 2 µm or less. The packing used in modern HPLC consist of small, rigid particles having a narrow particles size distribution. The types of column used in HPLC are
• Standard columns
• Radial compression columns
• Narrow Bore columns
• Short, fast columns
• Guard columns and In-line filters
1.9.6 Detectors (Ashutoshkar, 2005) The main function of the detector in HPLC is to monitor the mobile phase coming out the column, which in turn emits electrical signals that are directly proportional to the characteristics either of the solute or the mobile phase.
Basic detector requirements
An ideal LC detector should have the following properties: 1. Low drift and noise level (particularly crucial in trace analysis). 2. High sensitivity.
3. Fast response.
6. Cell design which eliminates remixing of the separated bands.
7. Insensitivity to changes in type of solvent, flow rate, and temperature. 8. Operational simplicity and reliability.
9. It should be tunable so that detection can be optimized for different compounds. On-Line Detectors
1. Refractive index.
2. UV/Vis Fixed wavelength. 3. UV/Vis Variable wavelength. 4. UV/Vis Diode array.
5. Fluorescence. 6. Conductivity.
7. Mass-spectrometric (LC/ MS). Off-Line Detector
1. FTIR spiral disk monitor. 1.10 VALIDATION
(www.askaboutvalidation.com/forum/showthread.php?t=1175)
The word “Validation” means “Assessment” of validity or action of proving effectiveness.
Types of validation
The validation is divided into different types. They are, Prospective validation
Retrospective validation
This provides trend of comparative result (i.e.) review and evaluation of existing information for comparison when historical data is sufficient and readily available. Concurrent validation
Based on information generated during implementation of a system for this extensive testing and monitoring are performed as part of initial run of the method. Re-validation
Revalidation provides the evidence that changes in a process and are the process environment, introduced either intentionally or unintentionally, do not adversely affect process characteristic and product quality.
There are two basic categories of revalidation. Revalidation in case of known change (including transfer of process from one company to another or from one site to another) Periodic revalidation carried out at scheduled intervals.
Reasons/ purpose of validation (Sethi, 2001) i. Setting standards of evaluation procedures.
ii. Taking appropriate action in case of non-compliance.
iii. Retrospective validation is useful for trend comparison of results compliance to
cGMP/ cGLP. iv. Closer interaction with pharmacopoeia forum to address analytical problems.
Enables scientist to communicate scientifically and effectively on technical matters.
1.11 ANALYTICAL METHOD VALIDATION
(Code Q2A;Q2B. ICH Guidelines1994 and 1996 )
validated or revalidated. The International Conference of Harmonization (ICH) of technical requirements for the registration of pharmaceutical for human use has developed a consensus text on validation of analytical procedures. The document includes definition for eight validation characteristics.
The parameters as defined by the ICH and by other organizations
Specificity Selectivity Precision
Repeatability
Intermediate precision Reproducibility Accuracy
Linearity Range
Limit of detection Limit of quantification Robustness
Ruggedness
SPECIFICITY
Specificity is the ability to assess unequivocally the analyte in the presence of components which may be expected to present. An investigation of specificity should
ACCURACY
The accuracy of an analytical procedure expresses the closeness of agreement between the value which is accepted either as a conventional true value or
on an accepted reference value and the value found. Assay
Assay of Active substances Assay of Medicinal products
Several methods are available to determine the accuracy
a) Application of an analytical procedure to an analyte of known purity b) Comparision of the results of the proposed analytical procedure c) Application of the analytical procedure to synthetic mixtures Impurity (Quantification)
Accuracy should be assessed on sample spiked with known amounts of impurities. It should be clear how the individual or total impurities are to be determined.
Eg: weight/weight or area percent PRECISION
The precision of an analytical procedure expresses the closeness of the agreement between a series of measurements obtained from multiple sampling of same homogeneous sample under the prescribed conditions. Validation of tests for assay and for quantitative determination of impurities includes an investigation of precision.
Repeatability (intra- assay precision)
Intermediate Precision
The extent to which intermediate precision should be established depends on the circumstances under which the procedure is intended to be used. Typical validation to be studied includes days, analysts, equipments etc.
Reproducibility
Reproducibility is assessed by means of an inter-laboratory trail. Reproducibility should be considered in case of the standardization of an analytical
procedure, for insistence inclusion of procedure in pharmacopoeias. LINEARITY
Linearity of an analytical procedure is its ability (within a given range) to obtain test results which are directly proportional to the concentration (amount) of analyte sample.
RANGE
Range of an analytical procedure is the interval between the upper and lower concentration of analyte in the sample including these concentrations for which it has been demonstrated that the analytical procedure has a suitable level of precision, accuracy and linearity.
LIMIT OF DETECTION
The detection limit is determined by the analysis of samples with known concentration of analyte and by establishing that minimum level at which the analyte
can reliably detected.
a. Based on visual evaluation b. Based on Signal-to-Noise ratio
c. Based on the standard deviation of the response and the slope
• Based on the standard deviation of blank
LIMIT OF QUANTIFICATION
The quantification limit is generally determined by the analysis of samples with the known concentrations of analyte and by establishing the minimum value at which the analyte can be quantified with acceptable accuracy and precision
a. Based on visual evaluation b. Based on Signal-to- Noise ratio
c. Based on the standard deviation of the response and the slope
• Based on the standard deviation of blank
• Based on the calibration graph ROBUSTNESS
The evaluation of robustness should be considered during the development phase and depends on the type of procedure under study. It shows the reliability of an analysis with respect to deliberate variations in the method parameters.
RUGGEDNESS
The united states of pharmacopoeia (USP) define ruggedness as the degree of reproducibility of test results obtained by the analysis of the same sample under a variety of normal test condition such as different labs, different analysis, different lots of reagents etc. Ruggedness is a measure of reproducibility of test results under normal expected operational conditions from laboratory to laboratory and from analyst to analyst.
1.12 SYSTEM SUITABILITY PARAMETERS (Anonymous USP, 1995; Sethi 2001)
that the equipment, electronics, analytical operations and samples to be analysed constitute an integral system that can be evaluated as such. FDA guidelines on “Validation of chromatographic methods” the following acceptance limits are proposed as initial criteria.
1) Capacity Factor (or) Retention (KA)
The retention of a drug with a given packing material and eluent can be expressed as retention time or retention volume, but both of these are dependent on
flow rate, column length and column diameter. The retention is best described as a column capacity ratio (K), which is independent of these factors. The column capacity ratio of a compound (A) is given as
0 0 A 0 0 A A t t t V V V
K = − = −
2) Resolution (RS)
The resolution, Rs of two neighboring peaks is defined by the ratio of the distance between the two peak maxima. It is the difference between the retention times of two solutes divided by their average peak width. For baseline separation, the ideal value of Rs is 2.0. It is calculated by using the formula,
) W W ( 5 . 0 Rt Rt R 2 1 1 2 f + − = Where,
Rt1 and Rt2 are the retention times of components 1 and 2 W1 and W2 are peak widths of components 1 and 2
3) Selectivity (αααα)
1 0 0 2 V V V V − − = α
Where, V0 is the void volume of the column and V2 and V1 are the retention volumes of the second and the first peak, respectively.
4) Column efficiency
Efficiency, (N) of a column is measured by the number of theoretical plates per meter. It is a measure of band spreading of a peak. Smaller the band spread, higher is the number of theoretical plates, indicating good column and system performance. Columns with N ranging from 5,000 to 100,000 plates/ meter are ideal for a good system. Efficiency is calculated by using the formula,
2 2 16 W Rt N =
Where, Rt is the retention time and W is the peak width. 5) Peak asymmetry factor (As)
Peak asymmetry factor, As can be used as a criterion of column performance.
The peak half width b of a peak at 10 % of the peak height, divided by the corresponding front half width a gives the asymmetry factor.
1.4PHARMACEUTICAL STATISTICS Linear regression
The equation of straight line is y = mx + c
Where, y the dependent variable is plotted as result of changing x, the independent variable.
To obtain the regression line ‘y on x’ the slope ‘m’ of the line and the intercept ‘c’ on the y axis are given by the following equation.
m = – () ()
– ()
And
C =(Σy)(Σx
) – (Σx) (Σy)
N Σx – Σ(x)
Correlation coefficient (r)
It is a procedure commonly used to characterize quantitatively the relationship between variable. Correlation is related to linear regression. To establish whether there is a linear relationship between two variables x1 and y1, use Pearson’s correlation coefficient ‘r’.
r = nΣxy− Σxy
{nΣx− (Σx)nΣy− (Σy)}/
Where n is the number of data points.
Standard deviation (SD)
It is commonly used in statistics as a measure of precision statistics and is more meaningful than is the average deviation. It may be thought of as a root-mean-square deviation of values from their average and is expressed mathematically as
Where,
S is standard deviation.
If N is large (50 or more) then of course it is immaterial whether the term in the denomination is N -1 or N
Σ = sum
x
= Mean or arithmetic average.x
-x
= deviation of a value from the meanN = Number of observations
Percentage relative standard deviation (% RSD)
It is also known as coefficient of variation (CV). It is defined as the standard deviation (S.D) expressed as the percentage of mean.
C 100 x S.D RSD % or
V = ×
Where,
S.D is the standard deviation,
x
= Mean or arithmetic average.The variance is defined as S2 and is more important in statistics than S itself. However, the latter is much more commonly used with chemical data.
Standard error of mean (SE)
Standard error of mean can be defined as the value obtained by division of standard deviation by square root of number of observations. It is mathematically expressed as
n
S.D. S.E. =
Where,
S.D = Standard deviation = number of observations.
Literature
Literature
Literature
Literature
2. LITERATURE REVIEW
2.1 DRUG PROFILE
(TheMerck Index 2006; http://www.rxlist.com/script/main/srchcont_ rxlist.asp?) LAFUTIDINE
Molecular structure
Chemical name
2-[(2-furylmethyl)sulphinyl]-N-((2Z)-4-{[4-(piperidin-1-ylmethyl)pyridin-2-yl]oxy}but-2-en-1-yl)acetamide.
Molecular formula C22H29N3O4 Molecular weight
431.55 g/mol Category
H2- Receptor antagonist, Anti- Secretory agent. Description
An off-white or white crystalline powder. Solubility
Identification 1) Melting Point
Standard Value Observed Average Value* 92.7- 94.9°C 92.5°C
*Average of five observations 2) IR Spectrum
IR Spectrum of Lafutidine and interpreted and shown in the figure 1. Mechanism of Action
Lafutidine an H2- Receptor antagonist inhibits gastric acid secretion not only in nights but also day time.
Pharmacokinetics
a) Distribution: Lafutidine is 88% bound to plasma proteins, mostly albumin. b) Metabolism: Metabolised by CYP3A4(mainly), CYP2D6.
Contraindications Lactation.
Drug Interactions and precaution
2.2 DOMPERIDONE
(The Merck Index 2006;
Molecular structure
Chemical name 5-chloro-1-[1-[3
4-yl]-1,3-dihydro-2H benzimidazole Molecular formula
C22H24ClN5O2 Molecular weight
425.91 g/mol Category
Dopamine antagonist Description
White or almost white crystalline powder. Solubility
Practically insoluble in water, slightly soluble in alcohol and methanol, soluble in DMF.
DOMPERIDONE
(The Merck Index 2006; http://www.rxlist.com/script/main/srchcont)
[3-(2-oxo-2,3-dihydro-1H-benzimidazol-1-yl)propyl] benzimidazole-2-one.
Dopamine antagonist
White or almost white crystalline powder.
Practically insoluble in water, slightly soluble in alcohol and methanol, soluble in DMF.
http://www.rxlist.com/script/main/srchcont)
Identification 1) Melting Point
Standard Value Observed Average Value* 236 - 239°C 238.8°C
*Average of five observations 2) IR Spectrum
IR Spectrum of Domperidone is compared with the standard values and principal peaks at a wave numbers were identified. IR spectrum is shown in the figure 2.
Storage Protected from light.
Mechanism of Action and pharmacology
Domperidone stimulates gastric muscle contraction by antagonizing the inhibitory effect of dopamine on post synaptic cholinergic neurons in the myenteric plexus. Dopamine effectively increases esophageal peristalisis and lower esophageal sphincter pressure, increases gastric motility and peristalisis, enhances gastroduodenal coordination and consequently facilitates gastric emptying.
Pharmacokinetics a) Absorption
Peak plasma levels of Domperidone occur within 10-30 min after i.m
injection and 30 min after oral administration. b) Metabolism
Hydroxylation and Oxidative N-dealkylation Adverse effects
2.3 REPORTED METHODS 2.3.1 FOR LAFUTIDINE :
1. Wei- Dong Chen et al. (2006), Simple, sensitive and rapid LC-ESI-MS method for the quantification of Lafutidine in human plasma- Application to pharmacokinetic studies Lafutidine and internal standard were isolated from plasma samples by liquid- liquid extraction with diethyl ether using column C18 (150mm* 2.0mm, 5µm) at the flow rate of 0.2mL\min and with gradient elution using electro spray ionization detection source.
2. Lili Wu et al. (2009), Determination of Lafutidine in human plasma by high performance liquid chromatography – electro spray ionization mass spectrometry : Application to bio – equivalence study, Determined the concentration of Lafutidine in human plasma by adding diazepam as internal standard and 1M NaoH solution to
0.5 ml of plasma sample, Lafutidine was extracted from plasma with Hexane : Isopropanol (95 : 5 % v\v) using v p ODS C18 (250 * 2.0 mm) column with
mobile phase methanol : water (20mm CH3COONH4) in the ratio 80 : 20 % v/v and electro spray ionization interface and SIM mode detection.
3. YE Xiang- fa et al. (2003), Determination of Lafutidine and its tablets by high performance liquid chromatography using ODS C18 column with mobile phase Methanol : 0.2M Ammonium acetate solution : Triehylamine in the ratio 70 : 30: 0.1 % v/v/v and the detection wavelength was set at 275 nm.
4. Ding Hong-liang et al. (2009), Determination of Lafutidine by HPLC using C18 column with mobile phase Methanol : 0.1M Sodium dihydrogen phosphate solution in the ratio 40 : 60 v/v with detection wave length set at 279 nm.
phase Methanol : Acetonitrile : 0.02M Phosphate buffer in the ratio 25 : 15 : 60 v/v/v adjusting the PH to 6.0 with Triethylamine at the flow rate 1 mL/min and the detection wavelength was set at 220 nm.
6. Onodera et al. (1999), Gastro protective mechanism of Lafutidine, a novel anti ulcer drug with histamine H2 – receptor antagonist activity. Investigated the gastro protective activity of Lafutidine by examining the effect on ammonia induced change in trans- mucosal potential difference (PD), basal gastric mucosal blood flow (GMBF) and noxious agent induced cell damage.
7. Shen Qian et al. (2007), Determination of Lafutidine concentration in human blood serum by HPLC using supercosil TM LC- 18-DB (4.6mm *250, 5µm) column with mobile phase Methanol : Sodium Acetate buffer in the ratio 1:2 at PH 4.5 using fluorescence detector at excitation wavelength at 285 nm and emission wavelength at 313 nm.
8. Zheng Heng et al. (2008), Determination of Lafutidine in human plasma by HPLC-MS. Determined by taking 10µl of Ranolazine HCl (2.0 µg/mL internal standard) was added to 0.5 ml of plasma. The plasma samples extracted with 5ml ether. The residue was dissolved in carbinol, 2 µl was injected in to ODS column with mobile phase as carbinol and the flow rate was set at 0.2 mL/min.
9. Shimatani et al. (2006), Lafutidine, a newly developed anti-ulcer, elevates post prandial intragastric PH and increases plasma Calcitonin gene related peptide and Somatostatin concentrations in humans : Comparison with Famotidine.
11. Zhen Yong et al. (2006), Reported determination of Lafutidine in serum with RP-HPLC, Determined by using c18 column with mobile phase Methanol and 0.005M Ammonium Dihydrogen phosphate at a flow rate of 1 mL/min, set a detection wavelength of 218 nm.
12. Kouzuro Ikawa et al. Pharmacokinetic and pharmacodynamic properties of Lafutidine after post prandial oral administration in healthy subjects: Comparison with famotidine.
2.3.2 FOR DOMPERIDONE
1. Lakshmana Prabu et al, (2008), Simultaneous estimation of Esomeprazole and Domperidone by U.V Spectrophotometric method, estimated by using simultaneous eqution method using methanol as solvent the wavelengths selected are 301 nm and 284 nm.
2. Priti D. trivedi et al. (2010), Estimation of Esomeprazole and Domperidone by Absorption ratio method in pharmaceutical dosage form, estimated using methanol as solvent, Isobestic point was set at 290 nm.
simultaneous equation method using cramels rule and Absorption ratio method based on measurement absorptivity at 216, 287 and 290 nm.
5. Patel et al. (2010), Development and validation of Derivative spectrophotometric method for simultaneous estimation of Domperidone and Rabeprazole Sodium in bulk and dosage form, determined by using first derivative spectrophotometry at wavelengths selected at 253 , 266.4 nm in sodium hydroxide solution.
6. Sohan S. chitlange et al. (2010), Simultaneous spectrophotometric estimation of DexRabeprazole and Domperidone in capsule dosage form, Determined by using simultaneous equation at 258.5 and 286.5 nm wavelengths and multicomponent mode
of analysis at 258 and 286.5 nm and area under curve at 263.5-253.5 and 291.5-281.5 nm using methanolic HCl (0.1) as solvent.
7. Karla Kapil et al. (2009), Spectrophotometric method for Simultaneous estimation of Paracetamol and Domperidone in tablet dosage formulation, Developed by simultaneous equation method with wavelengths selected at 250, 285 nm with methanol as solvent.
8. Venkatesh et al. (2010), Spectrophotometric method for simultaneous estimation of Paracetamol and Domperidone in tablet dosage form, Domperidone and Paracetamol were estimated by Simultaneous equation method at 284.5 nm and 244.5 nm using 1N Glacial Acetic acid as solvent.
9. Koujirou Yamamoto et al. (1988), Quantitative determination of Domperidone in rat plasma by HPLC with fluorescence detection, Determination of Domperidone in rat plasma involves Liquid- Liquid extraction followed by RP-HPLC with fluorometric detection at 282 nm for excitation and 328 nm for emission.
(150 * 4.6mm, 5µ) column with mobile phase methanol : 0.1M Ammonium acetate (PH 9) in the ratio 60 : 40 v/v at a flow rate of 1 mL/min and the detection wavelength was set at 280 nm.
11. Shozan Mondal et al. (2011), Development and validation of RP-HPLC method for the simultaneous estimation of Domperidone and Naproxen in tablet dosage form, Determined by using two LC-20 AT pump, SPD- 20A UV detector, SIL- 20A auto sampler and CTO-10 ASVP column oven with C18(250 * 4.6mm, 5µ) column and mobile phase was Phosphate buffer (PH adjusted to 3 with NaoH) : methanol in the ratio 30 : 70 v/v at a flow rate of 1 mL/min and detection wavelength was set at 280 nm.
12. Ahsanul Haque et al. (2011), Validated RP-HPLC method for estimation of Ranitidine HCl, Domperidone and naproxen in solid dosage form, Estimated in
shim-pack CLC- ODS(250 * 4.6 mm, 5µ) column with mobile phase 0.1M Orthophosphoric acid solution (PH 3): Methanol in the ratio 35: 65 v/v at a flow
rate of 1 mL/min and Uv detection was set at 280 nm.
13. Sivakumar et al. (2007), Development and validation of a RP-HPLC method for simultaneous determination of Domperidone and Pantoprazole in pharmaceutical dosage forms, Determined by using ODS analytical column with mobile phase as Methanol : Acetonitrile : Triehylamine solution ( PH 7 adjusted with 85% phosphoric acid ) in the ratio 20 : 33 : 47 v/v/v, at a flow rate of 1 mL/min and UV detection was set at 285 nm.
the ratio 40 : 30 : 30 v/v/v in an isocratic mode of elution at a flow rate of 1.5 mL/min and detection wavelength was set at 210 nm.
15. Vijaya Ratna et al. (2011), Reported RP-HPLC Method development and validation of Domperidone Maleate determined by using Luna C18 phenomenex (250 * 4.6mm,5µ) column with mobile phase methanol and water in the ratio 50 : 50 v/v, the detection wavelength was set at 285 nm.
Aim &
Plan
3.
Aim and plan of work
The combination dosage form selected for the present study contains Lafutidine and Domperidone in solid oral dosage forms, recently this combination has been approved by DCGI (Drug Controller General India)
In the view of the literature cited, method for estimation of Lafutidine and Domperidone individually and in combination with other drugs were reported, but no work is reported in the combination of both the drugs
For UV method,
1. Find the drugs solubility in various solvents
2. To determine maximum absorbance and overlaid the spectrums
3. Determining the standard absorbance for all selected wavelength for each drugs
4. Development of simple, precise, accurate and sensitive Simultaneous equations method
Area under curve method
5. Validation of developed methods as per ICH guidelines For RP-HPLC method,
1. A suitable mobile phase were selected for two drugs with proper resolution and short retention time
2. Development of chromatogram with various concentration for each drug to determine range of concentrations
Materials
&
4. MATERIALS AND METHODS
4.1. MATERIALS USED 4.1.1. DRUGS
Lafutidine and Domperidone were generously gifted by Orchid Pharmaceuticals Pvt. Ltd., Chennai and the formulation containing Lafutidine 10 mg and Domperidone 30 mg tablets were purchased from a local pharmacy with the brand name LAFAXID- D.
4.1.2. REAGENTS & CHEMICALS
All the chemicals used were of analytical grade and HPLC grade procured from Qualigens, India Ltd. The chemicals used for the study were
Acetonitrile (HPLC grade) Water (HPLC grade)
Methanol (Analytical grade) and Ammonium Acetate (Analytical grade) 4.1.3. Instruments Specifications
a) Shimadzu AX – 200 digital balance: (Shimadzu instruction manual)