3-1951
Conductances, transference numbers, and activity
coefficients of some low atomic number rare earths
in aqueous solution
F. H. Spedding Ames Laboratory Paul Edward Porter Ames Laboratory
Follow this and additional works at:http://lib.dr.iastate.edu/ameslab_iscreports Part of theChemistry Commons
This Report is brought to you for free and open access by the Ames Laboratory at Iowa State University Digital Repository. It has been accepted for inclusion in Ames Laboratory ISC Technical Reports by an authorized administrator of Iowa State University Digital Repository. For more information, please [email protected].
Recommended Citation
Spedding, F. H. and Porter, Paul Edward, "Conductances, transference numbers, and activity coefficients of some low atomic number rare earths in aqueous solution" (1951).Ames Laboratory ISC Technical Reports. 15.
Conductances, transference numbers, and activity coefficients of some low
atomic number rare earths in aqueous solution
Abstract
The conductances, transference numbers, and activity coefficients of aqueous solutions of the chlorides of lanthanum, cerium, praseodymium, and neodymium have been determined for concentrations up to 0.1 normal . The transference numbers were determined by the moving-boundary method as developed by Longsworth and MacInnes; the activity coefficients were measured by using concentration cells with
transference; and the conductances were obtained with a conventional apparatus of the type recommended by Jones and Josephs. The accuracy of all measurements was within 0.1 per cent.
Disciplines Chemistry
J ... I (
i
Al-
rsc:-JJI~
ISC-142
NUMBER RARE EARTHS IN AQUEOUS SOLUTION
By
F. H. Spedding Paul Edward Porter
March 1951
Ames Laboratory
CHEMISTRY
Reproduced direct from copy as submitted to this office.
PRINTED IN USA PRICE 40 CENTS Available from the Office of Technical Services
Department of Commerce Washington 25, D. C.
Work performed under Contract No. W-7405-eng-82.
L
UNITED STATES ATOMIC ENERGY COMMISSION
CONDUCTANCES, TRANSFERENCE NUMBERS, AND ACTIVITY COEFFICIENTS OF CHLORIDES OF SOME LOW ATOMIC
NUMBER RARE EARTHS IN AQUEOUS SOLUTION F. H. Spedding and Paul Edward Porter
March
1951
Ames Laboratory at
Iowa State College F. H. Spedding, Director
Contract W-7405 eng-82
4
ISC-142TABLE OF CONTENTS
Page
I . ABSTRACT . . 5
II. INTRODUCTION . 7
III. CONDUCTANCE 10
Af Introduction 0 • • • • o • • o • • B. Theory . . . o • • o o • " l:l o
10 10 C. History of Conductance Measurements . . . . 15 D. Experimental . . . . o . . . o o • 17 1. Preparation of solutions o o o 17 2. Apparatus . . . . . o 20 3 . Results . . o • • • ,.. • • • o o • • 22 E. Discussion of Results . . o 29
IV. TRANSFERENCE NUMBERS 34
A. B.
c.
D.E.
Introduction . • . .
Th e o ry . . . e • o • f) • • • • o History of the Method .
Experimental . . . . 1. Preparation of solutions . o • • 2. Apparatus . o o o . .
3. Results . . . . • . Discussion of Results
31+ 35 37 54 54 54 62 68
Vo ACTIVITY COEFFICIENTS 71
A. Introduction . . . o . . o • o o 71 B . The o ry o o • • • o . . o . . . 7 2 C. History of the Method 0 • o . . . 87
D. Experimental o • o 89
1. Pr-eparation of solutions . o . . 89 2. Apparatus . . o • • • • • 89 3 o Results . • . . . • 92 E. Discussion of Results . . . • . o 104
VI. SUMMARY AND CONCLUSIONS 109
VII. ACKNOWLEDGMENTS
VIII. LITERATERATURE CITED . .
. 111
112
\
CONDUCTANCES, TRANSFERENCE NUMBERS, AND ACTIVITY COEFFICIENTS OF CHLORIDES OF SOME LO\.V ATOMIC
NUMBER RARE EARTHS IN AQUEOUS SOLUTION1
F. H. Spedding and Paul Edward Porter
From the Department of Chemistry Iowa State College
I. ABSTRACT
The conductances, transference numbers, and activity coefficients of aqueous solutions of the chlorides of lanthanum, cerium, praseodymium, and neodymium have been determined for concentrations up to 0.1 normal . The
transference numbers were determined by the moving-boundary method as developed by Longsworth and Macinnes (1); the activity coefficients were measured by using concentration cells with transference; and the conductances were obtained with a conventional apparatus of the type recommended by
Jones and Josephs (2). The accuracy of all measurements was within 0.1 per cent.
The data for all four rare earths agree with the Onsager limiting law up to about 0.002 normal. A compari-son of the data with those for samarium, europium, and ytterbium chlorides recently determined at Iowa State College by Spedding and Wright
(3),
indicates that there is a regular decrease in the conductances of solutions of the rare earth chlor1Q.es with increasing atomic number beginning at about neodymium. The chlor·ides of lanthanum, cerium and praseodymium have about the same conductances, while the conductance of neodymium chloride is slightly higher. The behavior of the first four rare earths is thus anomalous in that the rare earths would be expected toshow a. regular change in properties over the whole series. A possible explanation of the observed data. is that a.
second coordination number may become possible as the ions become larger with decreasing atomic number, so that an equilibrium may be set up between two kinds of hydrated ions having different coordination numbers. Such an altera-tion in the coordinaaltera-tion numbers should produce substantial
1
6 ISC-142
changes in the effective radii of the hydrated ions which
would greatly influence their conductances. The importance
of the degree of hydration of the ions in determining the
conductance of the solution is indicated by the fact that,
in the latter part of the rare earth series, the
conduct-ances decrease with decreasing ionic radius as measured
crystallographically. The greater mobility which should
result from the smaller ion is more th~n compensated by
the effects of hydration. At the pres~nt time, insufficient
data. are available for any definite conclusions to be made;
measurements of conductances should be extended to all
members of the rare earth series not only for chlorides but
also for other salts of different anion valence types. In
addition, more crystallographic data on hydrated salts would
be useful, in order to study the coordination numbers of
the hydrated ions and to correlate them with the conductive
behavior.
The transference numbers do not merge with the
theo-retical Onsager limiting slope. This is somewhat
surpris-ing in that the conductances are in excellent agreement
with the Onsager equation and do merge with the limiting
slope at concentrations as high as 0.002 normal. It is
evident that some effect must be influencing the motion of
the ions which cancels out in the case of conductance$
but which causes a difference in the case of transference
numbers. The data presented, together with those of
Spedding and Wright (3) for samarium, europium, and
ytter-bium salts, indicate that the same effects which cause the
conductance results for the first four elements to behave
in an unexpected manner, also produce an analogous effect
in the case of transference numbers. Little change in
transference numbers is observed for the first four rare
earths; however, beginning with neodymium a. regular decrease with increasing atomic number is observed.
An effort should be made to extend the transference
number measurements to higher dilutions in order to find
an explanation for the fact that the Onsager equation is
followed for conductance, but not for transference numbers.
In addition, data for all the rare earths should be
accum-ulated, so that a more complete study can be made of the
factors entering into the ion mobilities.
The activity coefficients for all four salts agree well
with the Debye-HUckel theory. The values obtained for
a0 , the average effective ionic diameter, show no regular
aecrease 1 but do show an increase up to neod;ymium. As in
0
the case of conductances, this effect may be due to the simultaneous existence in solution of two coordination num-bers for the rare earth ions of low atomic numbero The a.0 values for all four rare earths exceed the sum of the
ionic radii of the rare earth ions with the chloride ion by apgroxima.tely the diameter of one water molecule. If the a values have physical significance, the above fact indicates that the first sheath of water molecules adheres
tightly to the rare earth iono The diameter of this sheath would undoubtedly depend largely upon the coordination
number of the central ion; hence, if an equilibrium were established between two coordination forms in solution, the magnitude of a0 , which is an average property, would depend upon the point of the equilibrium. Variations in the point of the equilibrium for the first four elements could thus possibly provide an explanation for the ob-served distances of closest a.pproa.cho
LITERATURE CITED
1. Macinnes, D. A., and Lo Go Longsworth, Chemo Rev., ~'
171-230 (
1932)
02. Jones, G., and R. Co Josephs, J . Amo Chern. Soc., 50,
1049-1092 (1928).
3.
Spedding, F H., and Jo M. Wright, unpublished work.II. INTRODUCTION
Modern theories of electrolytic solutions have achieved
great success in explaining the deviations from ideal
be-havior observed in extremely dilute solutionso At the
present time, however, the extension of the theories into
the region of higher concentrations is not entirely
satis-fa.ctory o There is a great need for additional experimental evidence of all kinds in order to correlate the various
properties of solutions and their dependence upon concen-tration. The discovery of empirical relationships often points the way to new theoretical treatments, and a fund of
experimental data. is essential to indicate the directions
8
ISC-142The valencies of the ions of an electrolyte play a
particularly prominent role in determining the extent of
deviations from the laws of ideal solutions. The ions of
higher valence type not only show g~eater deviations from
ideal behavior, but are also observed to depart fro~ the
theoretical limiting laws at lower concentrations. It
follows that a study of the properties of solutions of
polyvalent electrolytes should provide the most sensitive
indications of desirable modifications of the theories;
however, comparatively few experimental data have been
obtained for such solutions. In fact, the activity
coef-ficients for only one 3-l electrolyte have been studied
in sufficiently dilute solutions to permit a satisfactory
extrapolation of the data to infinite dilution.
The lack of data on polyvalent electrolytes results
from the fact that the common polyvalent cations are weakly
basic, so that their aqueous solutions are not only subject
to hydrolysis but also to undesirable complexing reactions.
These difficulties are avoided in using salts of the rare
earth elements since they are strongly basic and show little
tendency to hydrolyze or to complex with strongly acid
anions if reasonable care is taken in the preparation of their solutions.
The rare earth elements, together with yttrium and
scandium, are particularly valuable for studies in physical
chemistry for another reason. In the Aeries of rare earth
elements the inner 4f shell of electrons is being filled,
while the external shells of electrons are practically con~
stant for the whole group. Since the characteristics of'
the outermost electrons give rise to the observed chemical
properties of an element, the rare earth elements are
re-markably similar. The only major changes observed through
the series are a decreasing atomic radius brought about by
the increasing nuclear charge and the corresponding changes
in properties resulting from the decrease in radius. Thus,
the set of elements from lanthanum through lutetium provides
an opportunity for studying the effects of shrinking ionic
or atomic radius virtually independently of other factors.
At the same time, the inclusion of scandium and yttrium
allows a comparison of the effects of removing whole shells
of electrons; thus two methods are available for studying
the differences in properties brought about by changes in
the effective nuclear field strength in the valence shell.
Another feature of several of the rare earths is the
existence of absorption spectra. in the visible and
ultra-violet which result from electronic transitions in the
inner shells. These spectra are sensitive to the sym~etries of the fields produced by surrounding ions and molecules, but, as a first approximation, are otherwise unaffected by chemical reactions. The bands observed are very narrow and are resolved into sharp lines at low temperatures so that quantitative measurements of the energy levels of the ions are possible. The inner electrons of the rare earth elements are frequently unpaired, and thus give rise to paramagnetic properties which are also sensitive to the symmetries and magnitudes of surrounding fields . These paramagnetic proper-ties can also be used for quantitative studies of the ionic energy levels in crystals and in solutions. The information provided by the absorption spectra and magnetic susceptibil -ities can be used to study directly the short range forces which surround the ion which largely determine the devia-~ons from ideal behavior in solutions.
The principal deterrent to the use of rare earth salts has been their unavailability; however, they have recently become available through the development in the Iowa State College laboratories (1,2,3,4) of an excellent technique for the separation of the rare earths. The new separation method involves the use of columns of ion-exchange resin,
and has been used to produce multi-gram amounts of nearly all of the rare earths in a highly pure form.
The purpose of this thesis is to extend the knowledge of the electrochemical properties of 3-1 electrolytes by studying solutions of the chlorides of some rare earths of low atomic number. It is hoped thereby to supply data from which some conclusions may be drawn in regard to the range
of the validity of modern theories and the directions in which modifications may be required. It is realized that similar data. must be available for the whole rare earth series, and cross-checks must be possible with sucn informa-tion as heats of solution and dilution, partial molal
volumes, dielectric constants, etc., before a. complete study can be made. The properties chosen for the present study were conductances, transference numbers, and activity coefficients; these properties were chosen because there are well established limiting laws for them whose extension into the range of higher concentration would be highly
10 ISC-142
III. CONDUCTANCE
A, Introduction
The conductances of solutions of electrolytes have
played a very significant part in the development of present
day theories of ionic solutions. The factors leading to
changes in the mobilities of the ions, as a function of
their concentration in extremely dilute solutions, have
been expressed in the Onsager equation
(5)
which correctlypredicts the limiting behavior of electrolytes at infinite dilution. This equation, however, contains an empirical constant,
.J\
0 , which has not yet been successfully computed theoretically; the equation is also incapable of expressing the experimental data except for the most dilute solutions, The complete solution of the conductance problem is a veryworthwhile goal, but the problem can only be attacked when
a large amount of information is available. The present
work supplies such information for only a. limited number of
3-1 electrolytes. It is hoped that the general equation
for conductance will become apparent when the conductances of a. number of salts have been obtained for the whole rare
earth series, and when other electrochemical and thermal
properties have been measured,
B. Theory
When two electrodes are immersed in a solution of an
electrolyte and a. voltage is impressed across them, a. cur-rent is observed to flow through the solution. This current
under the proper conditions obeys Ohm's law so that i t is possible to measure the specific resistance and conductance
of the solution. The specific resistance is defined as the resistance of a. centimeter cube, and the specific conductance
is defined as the reciprocal of the specific resistance. The conductance of an electrolytic solution may also
be expressed in terms of the equivalent conductance or molar
conductance. The above quantities can be computed from the measured specific conductances by the equations:
in which
A
e,J1
m are equivalent and molar conductances, respectively;L is the specific conductance;
Ce is the concentration of electrolyte in equiva-lents per liter; and
em is the concentration of the electrolyte in moles: per liter.
The molar conductance of an electrolyte depends upon the number of ions into which it dissociates, the charges on the ions, and the v~locities attained by the ions in an e lect·rica.l field. Th_e general equation expressing this re-lationship is:
+ - - - - (2)
in which n1, p 2 , are the numb~rs of ions of kinds l, 2, ---- which result from the dissocia.-~ions ~f l mole of electrolyte;
u
1 ,u
2 , are the ionic mobilities, or the velocities - - of the ions per volt per em;z
1 , 2 2 , are the numbers of electronic charges on the ions; and~ is the electronic- charge.
For a. substance AJ+ B~- having a. degree of dissocia-tion, qc, the expression for
Am
becomesA
m.
=
N€0:.
hJ-+
z""' u-+
f , ) ...z u_)
in which N is the Avogardro constant.(3)
The theoretical treatment of electrolytic conductance has been very extensive, and adequate reviews are available of the history a.hd the development of the modern theories of electrolytic solutions
(6,7,8).
While the problem of the theoretical treatment of conductance is by no means solved, the limiting law of Onsa.ger (5) seems to be essen-tially correct at high dilutions and serves as an excellent extrapolation law for conduetivity data; a. number of attempts have been made to extend it into a. higher concentrationrange, but very little success has been realized.
12 ISC-142
after the dissociation theory of Arrhenius had become
generally accepted. From the beginning it had been realized that the class of strong electrolytes did not obey the
Ostwald dilution law or the law of mass action. In addition, for all electrolytes, the simple hypothesis of Arrhenius
with regard to conductance, which assumed the mobilities of the ions to be independent of concentration~ was not in agreement with the observed dependence of transference
numbers upon concentration. The explanation of this apparent anomaly was first advanced by J . J. van Laar (9) who pointed out that if ions exist in solution coulomb forces must also exist among them and must produce an effect on the osmotic pressure, conductance, and other properties. In 1904,
Noyes (10) showed that the optical behavior of solutions of colored strong electrolytes indicated that they were com-pletely dissociated ev~n at high concentrations; this observation was confirmed by a. number of other investi-gators using optical properties and other physical proper-ties of the solutions. Sutherland (11), in 1907, made the first attempt to calculate the magnitude of the effects of the ionic interactions on conductance. His calculations were only very approximate, but they showed that the coulomb forces could produce all of the observed conductance de-crease with concentration observed for strong electrolytes. Later, Milner (12) developed a mathematical theory f'Or the effects of inter-ionic attraction which was correct, but which employed statistical methods and graphical solutions.
Although his theory was too cumbersome for practical use, he was able to show that at low concentrations the devia-tions from ideal behavior should be proportion~l to the square root of the concentration. Debye and Ruckel (13) found a. mathematical device by which they could effect an integration of Milner's equations leading to a. highly
useful expression for describing the effects of inter-ionic attraction. They assumed that all of the deviations from ideal behavior observed in solutions of electrolytes re-sulted from coulomb interactions of the ions with one
another and with the molecules of the solvent. These coulomb interactions lead to the formation of an "ionic atmosphere'' around each ion in a. solution such that there will be a. slight preponderance of positive ions in the vicinity of each negative ion and vice versa.
\.
exponential expression in series and by disregarding higher terms. This relation provided an expression for the
electrostatic potential at the site of an ion, produced by its "ionic atmosphere''. This potential could then be used for calculation of the deviations of the solution from ideal behavior as a result of the charge interactions.
The fundamental assumptions involved in their theory can be summarized as follows : (1) if the electrical charges were removed from the ions, the so'lutions would show ideal behavior; (2) the medium in which the ions are immersed. is continuous, with no variation of the dielectric constant in the vicinities of the ions; (3) the Boltzman relation correctly expresses the distribution of ions in the "ionic atmosphere''; (4) the Poisson equation is valid for the system of ionic charges and solvent; (5) the net electro-static potential in the atmosphere of any ion i s small enough so that higher terms in the expansion of the ex-ponential expression of the Boltzma.n distribution may be ignored. These five assumptions are more closely met as the solution becomes more dilute; thus, the Debye-H"ucl{el expression becomes more and more valid as infinite dilu-tion is approached.
De bye and RUckel, using their ''ionic atmosphere 11 concept, developed a preliminary theory of conductance. This theory was later corrected and exten~ed by L. Onsager
(5),
whose final equation is now generaJ.ly accepted as the correct limiting law. According to the Onsager treatment, the "ionic atmosphere" of De bye and H"ucke 1 affects themobilities of the ions in two ways, which are usually called "the time of relaxation effect" and "the electrophoretic effect". The "electrophoretic effect" results from the fact that the ions of the "atmosphere" tend to drag solvent
mol~cules with them in a direction opposite to the motion o-r the central ion when an electrostatic field is impressed upon the system. This ~henomenon gives rise to a. flow of solvent past any ion which reduces its net velocity. In the Onsager theory all of the effects which produce a.
frictional drag upon an ion at infinite dilution, or in the absence of other ions, are accounted for in the empirical constant, ('... 0 ; for the ion. Thus the effect of water
dragged by~e central ion itself is considered in the /\.0
value for a salt, and only the frictional resistance ca1rm~"d by motion of the solvent produced by other ions must be
corrected for. The "time of relaxation effect" results from the fact that in an electrostatic field the "ionic atmos-phere" moves in a direction opposite to the motion of the central ion. Since it requires a finite time for the
14 ISC-142
the ion, the effect of the electrical field is to separate the ion and its "atmosphere" into a dipole. The electro-static attraction of the "atmosphere" and of this dipole Upon the central ion results in the partial cancellation of the impressed external field, with a consequent reduction in its mobilityo
The Onsager equation has not been solved for the
general case and is extremely complicated; however, certain approximations can be made and a. simple relationship can be derived as the solutions become dilute. For a. binary electrolyte, which is completely dissociated, this simpli-fied "limiting law" can be written~
L\.
=
1\.
0 -s (
L\ )
r
~
(4)
in which
Ao is the equivalent conductance at infinite dilution; T i s the iona.l concentration or
c
1z
12 -+c
2z
22 ; andin which
: l. 970 X 106
(DT)3/2
q*
D is the dielectric constant of the
T is the absolute temperature;
"Y\. is the viscosity of the solution;
* _
\Z1Z2j!\
0q,<_ ···-·'="-··· ---- 0
- ( \Zll -+ IZ21
( I
z
21
)\
1 in whichmedium;
and
..
I
2 1!?\
~)
I\~ and I\~ are the equivalent ionic conductances at
infinite dilution for ions l and 2o
In the expression for S~i\), the first term represents the "time of relaxation" eff ct;, and the second term is the "electrophoretic effect"o It must be remembered that this expression does not include effects of incomplete dissocia-tion. This effect must be separately considered if the
degree of dissociation of the electrolyte changes upon dilution. The Onsager law is the best means of
extrapo-lating experimental data to infinite dilution, since it i
n-creases in validity as the concentration approaches zero; this is not true of empirical equations which are somet imes
applied. The use of the Onsa.ger equation for making the
extrapolation will be further described in the experimental
section.
C. History of Conductance Measurements
The literature on the measurement of conductance of solutions is very extensive. Since the subject has been
adequately covered by others (14,15,16) it will not be
reviewed in detail in this thesis; however, some of the more important developments will be mentioned.
Accurate measurements of electrolytic conductances
began in 1868 when F. Kohlra.usch (17) introduced the use
of an alternating current bridge to avoid polarization effects. Kohlra.usch developed the method of measurement
to such a high degree of precision that his results are
still some of the best available. In 1916, Taylor and Acree
(18) made a thorough study of the factors entering into precision measurements. They studied various oscillators
for producing the current, and concluded that the Vreeland
oscillator was much superior to other devices. They also
studied bridge and cell design and the preparation of
solu-tions and were able to attain a reproducibility of 0.001 per cent in their measurements. Washburn (19) investigated
the design of cells and the characteristics of the telephone
receivers used as null indicator~; his work effected
con-siderable improvement. Hall and Adams (20) devised a.
suitable amplifier to be used with the detector, thus im-proving sensitivity.
!I. C. Parker (21) found that the cell constant for conductance cells in use at that time varied with the re
-sistance measured. This important effect was attributed
by him to adsorption, but was later shown by Shedlovsky
16 ISC-14-2
Morgan and Lammert (24), in 1926, discussed the problems
of measuring electrolytic conductance upon the basis of all
data available at that time. They also studied the design
and shielding of the bridge, and paid particular attention
to the characteristics of the oscillator. Jones and Josephs
(25), in 1928, made a. classic study of the conductance
bridge and accessories which is still used as the basis for
bridge design. T. Shedlovsky (26) devised a bridge
a.rrange-r:~~t capable of high accuracy, which differed only i!1 the
manner of shielding from the recommendations of Jones and
Josephs .
In recent years the work of Jones and his associates
has brough the measurement of conductance to 2. very high
degree of accuracy. Jones and Bollinger (23) and Jones and
Christian (27) studied design and use of conductivity cells;
their work was so carefully performed that this paper has
become the guide for the proper construct1on of conductance
cells.
A most important factor in the measurement of
con-ductances is the calibration of the conductance cells. By
definition, the specific conductance of a solution 1s the
reciprocal of the resistance of a centimeter cube of
solu-tion. Thus, if the electrodes of a conductance cell have
an area A, and if they are separated by a distance s, the
relationoetween the specific conductance and the measured
resistance will be:
L
=
-·
s (5)RA
In principle, each of the quantities s, A~ and R can
be measured in order to compute L; however~ i t is much
simpler in practice to set up a. secondary standard
solu-tion of known L value, and to evaluate s/A for the cell
by measurement of the cell resistance when filled with the
secondary standard. The quantity~ is called the cell
constant for the given cell. F. Kohlrausch (28) first
set up a. secondary standard by measuring the resistances
of potassium chloride solutions in a. number of conductance
cells whose
d/A
values were measured very precisely. Thesespecific con ucta.nce values were used until 1924, when the
improvements in measuring techniques required a more care-,
ful specification of the method of preparing the potassium
chloride solutions. The conductances were re-determined by
Parker and Parker (29), but their data have been superseded
by those of Jones and Bradshaw (30) and Jones and Prendergast
\
\
(31). Jones and Bradshaw used a direct comparison of the conductances of the solutions employing mercury as the primary standard. This was accomplished by using a series of conductance cells of gradually decreasing values of cell constant. In the cell having the highest constant, the
calibration was made b~ measuring the resistance when filled with pure mercury at 0 C. Since mercury at the above tem-perature is the primary standard for resistance, the cell
constant so obtained is better than could be obtained by measuring cell dimensions. The specific conductance of a strong solution of sulfuric acid was measured in the cali-brated cell, and this value was used as a secondary standard in calibrating the next cell in the series, The latter
cell was satisfactory for the measurement of a l demal potas-sium chloride solution (one gram-molecular weight of elec-trolyte per 1000 grams of solution) . The l demal potassium chloride was used to calibrate the next cell, which was then employed in standardizing a 0.1 demal solution. In this manner measurements of potassium chloride solu.tior;s were obtained for use as standards. After the entire set of ~easurements had been made at 0°C, they were extended to other temperatures; for these temperatures, the coefficients of thermal expansion for the various parts of the cells were used in calculating the cell constants. Jones and
Prendergast (31) used the above procedure3 but attempted to reproduce the solutions and temperatures initially used by Kohlrausch. Their data agree almost exactly with those of Kohlrausch, thus attesting to the high degree of accuracy attained by him with his relatively primitive apparatus.
D. Experimental
l. Preparation of solut;l..ons
The lanthanum oxide was obtained from the Lindsay Light and Chemical Corporation. The cerium oxide was prepared from a sample of cerium ammonium nitrate purchased from the G. Frederick Smith Chemical Company. The praseodymi~lm
and neodymium oxides were prepared by the rare earth group of the Ames Laboratory under the direction of Dr. F. H. Spedding. The purities of the oxides are given in Table 1. In ail cases these oxides were further purified by two
Element
Lanthanum
Cerium
Praseodymium
Neodymium
*
18
ISC-142TABLE 1
Purities of Rare Earths.
Purity*
No other rare earths or thorium detected by emission spectrography. Trace of calcium detected prior to two precipita-tions of oxalate from acid solution.
No other rare earths, thorium, or common elements detected by emission spectrog-raphy.
No other rare earths or thorium detected by emission spectrography. Faint traces of magnesium and calcium detected prior to two precipitations of oxalate from acid solution.
No other rare earths or thorium detected by emission spectrography. Faint trace of magnesium detected prior to two pre-cipitations of oxalate from acid solu-tion.
The limit of detection of rare earths was about
The freshly ignited oxides were dissolved in an excess of redistilled hydrochloric acid. Chlorine was bubbled through the solution which was boiled vigorously to remove any possible bromine contamination and finally was evaporated to a thick syrup on a hot plate. Further drying was accom-plished by placing the syrup in a pyrex tube, and heating under vacuum on a water bath until the remaining chloride crystals appeared flaky in composition. The final drying was accomplished by heating slowly in a hydrogen chloride atmosphere to a final temperature of 300-400°C. The hydro-gen chloride, hydro-generated by dropping concentrated sulfuric acid into concentrated hydrochloric acid, was dried by
passing the gas in succession through a bubbler filled with concentrated sulfuric acid; a dry ice-acetone cold trap; and a calcium chloride drying tube immersed in dry ice-acetone mixture. In the final drying step it was found to be essential to halt the temperature at several points to prevent melting of the crystals; oxychloride was formed, which was not re-converted to chloride upon further heating if the crystals were allowed to melt at any stage. Since the hexahydrates melt at about 80°C, the first halt was made below this temperature and the heating wa~ continued until no water was evolved in the hydrochloric acid stream.
The next halt was made in the vicinity of 100°C, and the
final halt at about 160°C. The furnace could then be rapidly heated to the final temperature after water had ceased to be evolved at the last temperature. After the drying had been completed, the apparatus was flushed with helium until no hydrogen could be detected in the exit gas; the sample wasthen cooled and bottled in a previously weighed weighing bottle. The sample weight was obtained by re-weighing the bottle and contents.
To prepare the solutions, the lid of the weighing bottle was carefully removed and placed in a small beaker. The
weighing bottle was inserted into a special glass apparatus t-vhich allowed the chloride to be ·slowly added to conductance water in a calibrated two-liter volumetric flask with the whole system closed~ This precuation was observed because some investigators (32) have found that rare earth chlorides tend to expel hydrochloric acid on dissolving in water.
After the transfer had been completed, the weighing bottle and attachment, as well as the lid and the beaker, were rinsed and the washings added to the flask. Finally, the solution was diluted to volume at 25°C.
20 ISC-142
Beckman model G pH meter, were from 6.4 to 6.60 The normal-ities were calculated from the weights of the chloride
added. They were ckecked by precipitation of aliquots with oxalic acid and weighing a.s oxalate; the analyses agreed within Ool per cent with the chloride weights in all cases o
Test solutions were prepared by dilution of the stock solu-tions using calibrated volumetric ware. The water employed in all cases was conductance wgter having a. specific con-ductance from 0.7 to 1.2 x 10- mho/em.
2. Apparatus
The conductivity bridge was built by Leeds and Northrup Company in accordance with the recommendations of Go Jones
(27); it is completely described by Po H. Dike (33) o The oscillator and amplifier were also purchased from Leeds and Northrup (catalog numbers 9842 and 9847) and also conform to the high standards set by Jones. A Dumont type 208B five-inch cathode ray oscilloscope was used. a.s a. null-point detector, and. was found to be a substantial improvement over the earphones normally employed..
The conductivity cells were commercially available types (Leeds and. Northrup catalog numbers 4911, 4914, and. 4915). They were pla.tinized. before use by the procedure
recommended by Jones and. Bollinger (34). The cells were ~
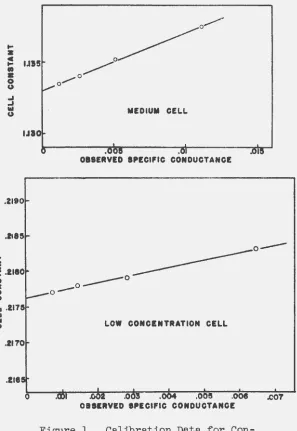
found. to have a. slight Parker effect so that they were calibrated. a.t a. number of points; plots of cell constant against observed conductance were used to determine those constants applicable to the conductivity range to be studied. These plots are shown in ·Figure 1; no plot is shown for the h1gh-concentra.tion cell since no Parker effect was observed. in this case. The potassium chloride used. for calibration was prepared by twice recrystallizing reagent grade material and fusing in nitrogen. The calibrating solutions were made up to known normalities and the equivalent conductances listed by Shedlovsky (35) were used. a.s standards.
The constant temperature bath maintained the temperature within 0.02°C a.s determined by a. thermometer marked in
...
zI!
1.11!5•
z0 ~
...
...
Ill~
IJIO
.2190
.2185
MEDIUM CELL
.OOD .01 .OI!S
OBSERVED SPECIFIC CONDUCTANCE
...
z~ .2180
•
z
0----
0---0-0
~
..I .2175
..I Ill
u
.2170
.211
0
0
-LOW CONCENTRATION CELL
.0 .OO!S .001
[image:23.566.145.442.148.579.2]OBSERVED SPECIFIC CONDUCTANCE
Figure l. Calibration Data for
Con-ductivity Cells.
22 ISC-142
3. Result~s
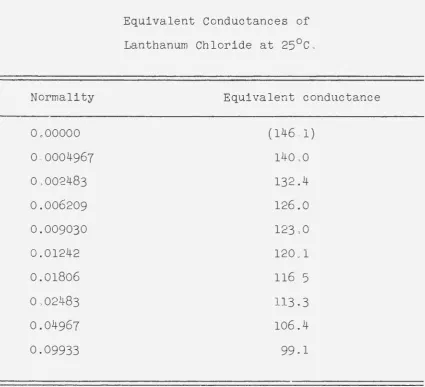
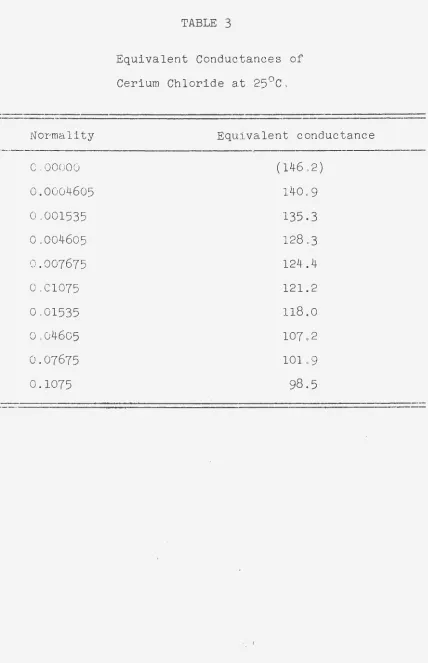
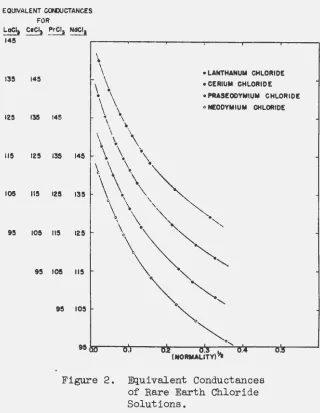
The data obtained for solut ions of lanthanum, cerium, praseodymium, and neodymium chlorides are given in Tables 2,
3, 4
and5,
and are plotted in Figure 2. The ordinates in this figure are staggered in order to separat e thefour curves.
Values of the equivalent conductance at infinite dil
u-tion were obtained by extrapolati on using the Onsager
limiting law, which for the special case of 3~1 electr o-lytes has the form:
(6)
in which
y
-1 ""'
V'o ·
75
L1
o/ /\.. o "'"
2~
0The limiting ionic conductance,
~ ~'
for the chlorideion is known to be
76.34
as calcu.latea from the trans -ference number and conductance data for hydr ochloric acid, lithium chloride, sodium chloride, and potassium chlori; e;it follows that .Ao can be expressed as a function of ~ ~
and
C{..l\
in the above equation. Thus, a.A
o value canoecalcu a ed for every experimentally deterrrllned
.J1.
valuegiven in Tables 2 tt..rough 5. These calculated / l0 values
are distinguished fr om the true values of ~o b~e use
of a prime. Since the Onsager equat ion be'C'Offi'es valid as
the concentration is reduced, a plot of
A
o against Cshould asymtotically approach the true value of
/l
o as Capproaches zero. The true
/1
0 value is a consta~for-the salt and would plot as a str•aight line parallel to the
concentnation axis; the limi ting slope of the plot must
be zero since the plot of Lj'0 against concentration approaches
this line as the solution "beComes more dilute. Thit~ fact
is an aid in making the extrapolation since the curve through the exper imental points must be so drawn that i t enters the axis of zero concentration with zero slope. The data f or
the four rare earths are plotted i n Figure
3
.
The result-ing values of ~lo are listed in Tables 2 through
5
at z.eroconcentrations-.--Normality
0.00000
0.0004967
Oo002483
0.006209
0.009030
0.01242
0.01806
Oo02483
0.04967
0.09933
TABLE ', 2
Equivalent Conductances of Lanthanum Chloride at 25°Co
Equivalent conductance
(146ol) 14000 132.4 126.0 123.0 120.1 116,5
[image:25.560.78.504.97.484.2]Nor·ma.l:i.ty
24
TABLE
3
Equivalent Conductances of
Cerium Chloride at 25°C.
Equivalent conductance
-
·
-
-·-
- - - · - - -
.
0,000000.0004605
0.001535
0,004605
0.007675
0.01075
0.01535
0,04605
0.07675
0.1075
' )
.
: ~(146.2)
140.9
135.3
128.3
12~.4
121.2
118.0
107.2
101.9
98.5
[image:26.566.66.494.61.724.2]Normality
0.00000
Oo0008972
0.001794
0.003589
Oo007177
Oo01077
0.01794
Oo05383
0.07177
0.1077
TABLE
4
Equivalent Conductances of
Praseodymium Chloride at 25°C.
Equivalent conductance
(146.0)
137o6
134.5
130.1
124.9
12L3
ll6o5
105o6
102.2
Normality
0.00000
0.0004521
0.002621
0.004521
0.007642
0.01274
0.02547
0.05095
0.07642
0.1274
26
TABLE 5
Equivalent Conductances of
Neodymium Chloride at 25°C.
ISC-142
Equivalent conductance
(146.6)
140.7
133.4
129.1
124.5
119.9
113.3
106.3
102.0
EQUIVALENT CONXJCTANCES
LoC'a 14S
13S
12~
liS
lOS
9S FOR
CtCI1 ~~ NdCI1
14S
13S
125
115
lOS
9S
~ I
,\
• LANTHANUM CHLORIDE• CERIUM CHLORIDE
.
\
• PRASEODYMIUM CHLORIDE\
\ o NEODYMIUM CHLORIDE145
.
\\
"
·
\
\
\
\
\
'13S 145 \
.
.
.
\\\\
·~
12S 13~
\
.
\
0 \ ' ~
\
\
'""
.,
liS 125
\
.
~
'lOS liS
\~~
""'~
0 '9S 105
"'-."
95 10
o ,
U.l Q.Z O.ll ~ 0.4 U.:! (NORMALITY)
[image:29.566.111.431.152.565.2]28
Calculated ~.
Far
152
150 152
148 150 152
146 148 150 152
144 146 148 150
144 146 148 e LANTHANUM CHLORIDE () CERIUM CHLORIDE ~ PRASEODYMIUM CHLORIDE
144 146 0 NEODYMIUM CHLORIDE
144o !:-_ _ _ J....__---::o:-:.o:!-::os=---.L.---~o.±ol"'o----'---;:;-!o.OI5
[image:30.560.109.426.174.534.2]NORMALITY
Figure 3. Extrapolation of Conduct-ance Data to Infinite Dilution.
Eo Discussion of Results
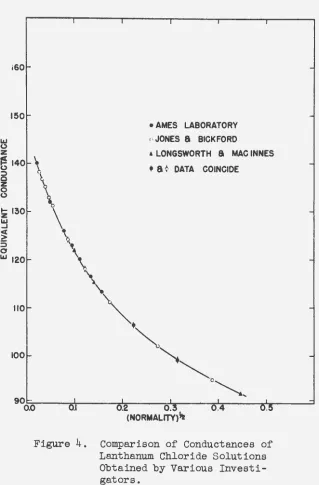
The conductances of lanthanum chloride in aqueous solu-tions at 250°C have been previously determined with high
precision by Jones and Bickford (36) and by Longsworth and Macinnes (37). The measurements were repeated in this in-vestigation as a check on the preparation of solutions and the measuring technique. The satisfactory agreement of the data of Table 2 with those of the above investigators
is shown in Figure 4o
The extent to which the Onsa.ger limitj_ng law is obeyed by solutions of the rare earth chlorides is indicated by the plots of
L1 -
L\
0 against\IQ
shown in Figure 5o Goodagreement is observed up to about Oo002No The convergences
with the expected slopes are excellent confirmations of
the validity of the limiting lawo
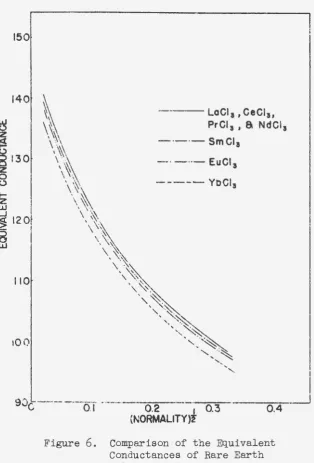
The conductances of the solutions of the chlorides of samarium, europium and ytterbium have recently been
deter-mined in the Iowa. State College laboratories (38); a.
com-parison of these data. with those reported in the present thesis is given in Figure
6
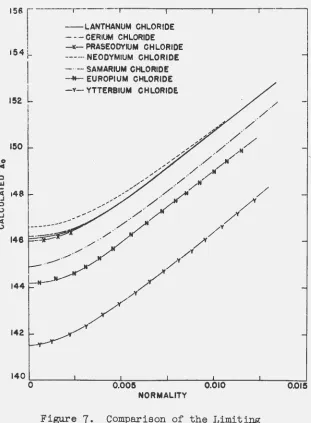
0 The differences a.1 .... e more ··clearly evident in the combined plot of
1\o
aga+nst normality in Figure 7o The rare earths, beginning-wTth neodymium,show a progressive decrease in conductan0e with atomic
number in spite of the fact that there is a progressive de~
crease in the crystallographic ionic radius for these
elementso This fact suggests that the hydration of the ions
plays a predominant role in determining the limiting mobilityo The lack of a regular decrease in conductance
for the first four elements is somewhat anomalous~ since
the rare earth series would be expected to show a. regular
change in properties over the whole series. A possible
ex-planation, in view of the apparent importance of the
hydra-tion of the ions, is that as the ion becomes larger with lower atomic number a second coordination number may become possible, so that an equilibrium may be set up between two
kinds of hydrated ions having different coordination numberso
A change of this type would undoubtedly give rise to a
change in the effective radius of the hydrated ion and in
the amount of water dragged with the ion in motion.
I I
160
150
IIOt-
lOOt-30
I I
• AMES LABORATORY
o JONES 8 BICKFORD
• LONGSWORTH
a
MAC INNES• a '¢> DATA COINCIDE
90~·~--~~~r---~~~----~~--~~r---,nr---~
0.0 0.1 0.2 0.3 0.4 0.5
(NOR~ALITY)~
Figure 4. Comparison of Conductances of Lanthanum Chloride Solutions Obtained by Various Investi-gators.
[image:32.564.117.436.109.594.2]0 ----,----·~---~r---r---r---.---~
-10
-20
•
~-30
<
-10
-20
;l-30
--t
-40
\
\
\
LANTHANUM CHLORIDEI
\.
\·
\
\
~~
\
\
\
\
CERIUM CHLORIDE\
~~
[image:33.560.128.447.115.531.2]\
Figure 5. The Agreement of' the Conductances
150
140
110
100
32
- - LaCI3 , CeCI3 , PrCI3 , 8 NdCI3
-·-·-SmCI3
--·-- ·· -EuCI3
- - - YbCI3
90c --·---o.f -·--- · 0.2 , 0.3 0.4
[image:34.560.113.428.103.567.2](NORMALITY)f
Figure
6.
Comparison of the Equivalent Conductances of Rare Earth~hloride Solutions.
ISC-142
I
15ti
1
--- - ,---r---r--- - . - - - ,I
--LANTHANUM CHLORIDEI - --CERIUM CHLORIDE
! ~-PRASEODYIUM CHLORIDE I 54
t-
---NEODYMIUM CHLORIDEI
·- ··- SAMARIUM CHLORIDE ---*-EUROPIUM CHLORIDE152
L
- Y -YTTERBIUM CHLORIDE
I
150
142
140~--~----~~~---~--~~---L---~
0 0.00~ 0.010 0.01~
[image:35.564.134.445.142.565.2]NORMALITY
34 ISC-142 same crystal. At the present time there are insufficient
data for definite conclusions to be made; more
crystallo-graphic data should be obtained for the hydrated salts, and conductance measurements should be extended to higher
concentrations.
The limits of error in the conductc;mce determinations
presented in this thesis were set by the accuracy of prepa-ration of the solutions. The errors in measuring the
re-sistances of the cells, as well as those resulting from
calibration of the cells W.ere estimated to be below 0.05
per cent, and the uncertainties in the molarities of the rare earth chloride solutions were less than 0.1 per cent.
IV. TRANSFERENCE NUMBERS
A. Introduction
The transference number of an ion in sol ution is the ratio of the migration velocity of the ion to the sum of the velocities .of the other ions in the solution. Values
of the transference number of the ions and of' the
conduct-ance of the solution, permits the calculation of absolute
ionic mobilities and furnishes a means for studying the
Onsag~r limiting law for the individual ions. A knowledge
of the individual ionic mobilities of the rare earth
series should be of partidular interest, since variations
in their ionic conductances can then be compared with such
quantities as ionic radius and coordination number without making any·arbitrary assumptions relative to the
contri-bution of the chloride ione
Measurements of the transference numbers of a salt
can be made in three ways: (1) the Hittorf method, (2) the moving-boundary method, and (3) the electromotive force
method. These "three methods will be described in detail in following sections of this thesis. The r1rst method
involves an analytical procedure which is very time-consuming and is now of historical interest only. The third method
requires the use of electrodes reversible to both ions of an electrolyte, and thus cannot be applied to the study of
rare earth salts until suitable reversible rare earth electrodes can be found. The moving-boundary method was
B, Theory
The different kinds of ions in an electrolytic solution do not migrate with the same velocities in an electrical field, but each species possesses a. characteristic mobility of its own. As a. result, the ions do not transport equal amounts of electric current during electrolysis. The frac-tion of the total current which is carried by a. particular
species of ion is called. the transference number of that
ion,
Thus~
in
tf
i - q i / Q - c i z iu
iL
cszsuss
which
tT:
l is the transference number of the ith ion;(7)
Cs
Us
is the is the trica.l
equivalent concentration of ion species ~; and velocity of the ion species, s, in an elec-field of given strength.
For a. binary electrolyte the equation becomes:
(8)
or, since for a. binary electrolyte c~z~
=
c_z_,u~
(9)
There are three kinds of transference numbers,
depend-ing upon the standard relative to which the velocities of
the ions are measured. The most useful type is the Hittorf number which measures the velocities relative to the
solvent. Another type is the Nernst number which is
some-times called the "true" transference number; it is a. measure
of velocities relative to molecules of inert solute present
in the solution which are supposedly not influenced by the
electrical field. The third type measures the velocities
ISC-142
vessels; this type of transference number is not a true
physical property of an electrolytic solution~ but combines
the characteristics of the tunic motions with the structural
characteristics of the apparatus. Therefore, when
trans-ference numbers of the third type are measured, as in the
uncorrected moving-boundary method, they are always
cor-rected to one of the other types. The differences among
the three kinds of transference numbers result from the fact that different amounts of solvent are transported by the
positive and negative ions owing to differences in their solvation and in their velocities. There is thus a net transport of solvent in the direction of one of the
elec-trodes, which produces a motion of the solution as a whole.
The resulting motion of the solution is dependent upon the
shape, size, and other characteristics of the electrolysis
vessel; this motion can be corrected for in either of two
ways. In the Hittorf method the net motion of solvent during the electrolysis is either calculated or obtained
in an analysis of the solutions; the correction is made so
that the velocities of the ions relative to the solvent are
obtained. In the Nernst method an inert solute, such as
raffinose, is added to the solution and the motion of the
solution is observed by analyzing the contents of various
parts of the cell for the inert solute after electrolysis;
the velocities of the ions are obtained relative to the
inert solute molecules. There is a small numerical
dif-ference between the two methods which, in general, becomes
larger for higher concentrations. Either the Hittorf or
the Nernst numbers can be used in thermodynamic equations;
however, the Hittorf number is more convenient for this
purpose because its use avoids any correction for solvent
transfer. When calculations are made using the Hittorf
number the solvent is considered to be stationary.
The theory of transference numbers is closely associated
with the theory of electrolytic conductance, since both phenomena depend upon the migration velocities of the ions.
Since the ionic conductances are proportional to the ionic
velocities~
(10)
The Onsager theory of conductance can be used to express
both
A.-o-
andA
as functions of concentration, and thus theconcentration-aBpendence of the transference number can be
at low concentrations it becomes:
t
=
~0 ~
s (
T')
\/C
in which
8
=
(r~
(\z.\ •
)z-1
l
-
\z.\\
~*
(
r
)
\-
(
I
z
.d
-tl
z _, )
Ll o
j
in which
in which
-28.98
(lz~l
4lz_t)3/
2'l_
(DT) l/2~ is the absolute viscosity of the solution,
D is the dielectric constant; and
Tis the absolute temperature.
(ll)
The above expression has been found to fit the
experi-mental data quite well for uni-univalent electrolytes, but
i t is not very satisfactory for ions of higher valence.
It is possible that this is due to the formation of
ion-pairs; however, if this were the case, greater deviations
would be expected from the limiting law in the case of
con-ductance than are actually observed.
c.
History of the MethodThe first evidence for the fact that the positive and
negative ions of an electrolyte do not transport the same
amount of charge during electrolysis was obtained by
Daniell
(39).
He electrolyzed a number of acids, bases and \salts in a three compartment apparatus in which the compart
-ments were separated by diaphragms of bladder. After
elec-trolysis, he analyzed the contents of the anode compartment
and cathode compartment, and found that the concentration
changes in the two solutions were different. This
phenom-enon was not explainable on the basis of the old theory of
conductance propounded by Grotthuss, but i t could be
ex-plained on the basis of unequal transport of current by the
38
ISC-142In
1853,
Hittorf(40)
began his more quantitativestudies on ion migrations using the same type of apparatus,
but under more carefully controlled conditions. He confirmed
the earlier observations and, over the period of years from
1853
to1903,
collected a large number of data on thetrans-ference numbers of electrolytes. Unfortunately, although
his methods were constantly improved and his researches laid
the groundwork for the study of transference, his data never
reached a degree of accuracy which would render them useful
today. In spite of this fact, the work of Hittorf was of
fundamental importance in the development of the law of
in-dependent ion migration advanced by Kohlrausch in
1876
andthe dissociation theory proposed by Arrhenius in
1884.
Accurate studies on transference numbers began when
the dissociation theory had been placed upon a firm
founda-tion and the essential features of the mechanism of
elec-trolytic conductance were known. Many methods of
deterrr,ina-tion were tried; however, only three of them were capable
of sufficient accuracy to warrant attention: (l) the
Hittorf method, (2) the moving-boundary method, and (3) the
electromotive force method. The first two will be
dis-cussed in the present section; the third will be discussed
in the section on activity coefficients.
The Hittorf method, or analytical method, for
deter-mining transference numbers has remained. essentially
un-changed since the initial measurements. The many
improve-ments in technique which have been made consist of
improvements in analytical methods; devices for measuring
the current; and in the arrangement of the .three
compart-ments of the electrolysis vessel. The most recent
applica-tions of this method by Macinnes and Dole (41) and by Jones
and Bradshaw (42) have reached a high degree of accuracy;
however, the painstaking care required and the amount of
time needed for such measurements have caused i t to fall
into disfavor. Since the Hittorf method is now of
histor-ical interest only, its development will not be further
considered here. A full treatment of the details of the
method is given by Macinnes
(6).
The moving-boundary method was originated by 0. Lodge
(43)
who set up an apparatus for the study of absoluteionic velocity. The apparatus consisted of two cups joined
by a horizontal tube filled with gelatin gel containing an
electrolyte having a different ion from that to be
or precipitant whose reaction with the ion to be studied would indicate depth of penetration of the ion into the gel. The ~ups were filled with a solution containing the ion whose mobility was under study; the electrodes were inserted; a voltage was impressed across the cell; and the rate at which the ion passed through the gel was measured.
In
1893,
W. C. D. Whetham (44) showed that Lodge hadnot correctly estimated the voltage gradient in his tube.
He pointed out that Ohm's law, together with the specific
resistance of the electrolyte solution in which the ion
moved, should be used in evaluating the gi'adient. Whetham
carried out experiments using an apparatus in which a liquid junction could be formed in a narrow-bore tube between two
solutions of electrolyte having one ion in common. The
salts were always chosen so that the ions not common to both were different in color so that the boundary was
visible. When a current was passed first in one direction,
and then in the other, the motion of the boundary was
ob-served and the velocities of the ions in the field were
obtained. The two solutions were always selected in such
a way that the specific resistances were nearly equal, in
order that the potential· drop should be uniform throughout
the tube.
In
1897,
the first theoretical treatment of the concen-tration changes and the motion of concentration gradientsduring electrolysis was published by Kohlrausch
(45).
Thistheory was merely an application of the equation of
con-tinuity, familiar to physicists, to the problem of ionic
migrations in an electric field. Although Kohlrausch was well aware of the facts that the ionic mobilities varied with concentration and that the charges on the ions
them-selves would cause some variations in the mobilitiesj he
chose to ignore these factors since insufficient
informa-tion about their magnitudes was available. He considered
his theory to be a limiting law which could be used to predict the factors which might enter into electrolysis
experiments. Kohlrausch applied his equation of continuity
to the case in which three species of ions are present;
he used boundary conditions for solving the equation
appro-priate to the moving-boundary experiment. He found that,
for a stable moving-boundary to be formed, the slower ion
should follow the faster and that the concentrations of
the electrolytes leading and following the boundary should be adjusted to the so~called "Kohlrausch ratio", '"( /C =