International Journal of Innovative Technology and Exploring Engineering (IJITEE) ISSN: 2278-3075,Volume-8, Issue-11, September 2019
Abstract: The web utilization by users is expanding very rapidly. Users are getting to data and administrations effectively through different media like social correspondence, sight and sound substance, web based trading, banking administrations and so forth. It winds up provoking undertaking to precisely recognize and separate typical and suspicious human behavior conduct. Every unique application need to predict user behavior to forecast and upgrade their administration quality. This work gives the examination of stock trader conduct recognition and expectation. Many Machine Learning (ML) methods and recognizable proof strategies are looked at and examined for stock trader behavior analysis. Their parameters are considered and enhancements are recommended. The proposed procedure portrays stock trader conduct discovery framework. The vital segment examination is the classification and prediction technique used to recognize and understand the typical and irregular behavior of the stock trader.
Keywords: Behavior, Sentiment, Ensemble, Machine Learning.
I. INTRODUCTION
The stock market is an aggregation of buyers and sellers of stock or is a network that provides a platform for major financial transactions across the globe. The dynamic rate of stock determines the stock value and is based on the market equilibrium. The knowledge of a stock value to the investor can result in high profits. Predicting this stock value offers simultaneous buying and selling of stocks that results in high profit has resulted in motivating many researchers in this area. This has prompted the researchers, in both academia and industry to find better, more precise solutions to problems taking into consideration the constraints like market volatility, political stability, seasonality and dependence on time, economies and other factors. Social networks have become an integral part of human life in the current generation and Gen-Next as well. The volume of information exchange happening on social media/network every single day offers an opulent data source that can be accessed rather much easily or effortlessly. This has opened up a plethora of opportunities for the researchers to analyze the user behavior using social network data. The researchers have proposed numerous methods for stock prediction based on financial news [1] [2],
Revised Manuscript Received on September2, 2019.
B. N. Shankar Gowda, Department of Computer Science and Engineering, Bangalore Institute of Technology, affiliated to VTU,
Bangalore, India. Email: [email protected]
Dr. Vibha Lakshmikantha, formerly working as Professor, Department of Computer Science and Engineering, BNM Institute of Technology,
Bangalore, India. Email: [email protected]
blogs and comments [3], tweets [4]. The stock or share of a corporation represents the ownership claims on businesses. Behavior analysis results in capturing individuals’ sentiment towards the products/commodities or even to assess the overall sentiment or opinion expressed in a piece of text. Behavior analysis also known as opinion mining or text mining refers to the use of Natural Language Processing, Tweet/ blog/text Analysis, and Computational Linguistics to systematically identify, extract, quantify, and study sentimental states and subjective information. There is a great need to differentiate between good and bad comments and label these comments with their sentiment to provide a concise summary to the readers about the general opinion regarding that entity.
A well-known behavioral economics hypothesis states that public mood and market performance are correlated. The idea being that when people are happy, joyful, optimistic, and in a good mood, they are more likely to increase investment [4]. The shareholders and corporations highly value the “customer’s opinion” about their products and services. Like data mining text mining also helps to uncover hidden patterns from the enormous data sets. Text mining process differs from the fact that it is performed on unstructured data unlike data mining. Most of the financial text mining relies on the simple textual representations in the form of bag-of-words [2]. To uncover interesting patterns in these bag-of-words, we must convert the unstructured text format to structured format that fairly describe text meaningfully. The Machine Learning (ML) techniques [5] aids in extracting the opinion or emotions of users from the social network data. They determine the mood/ opinion/ behavior of the user. Besides the more generic classification of text/ tweets/ blogs/ comments as positive, neutral or negative, ML techniques [6] allows researchers to identify the type and intensity of more distinct emotions, such as fear, joy or surprise, in written text. These emotions largely influence the shareholders to make appropriate decision to hold, sell or buy stocks.
The flow of this work is as follows: The related work is discussed in section II which highlights data extraction, pre-processing and classification of stock data. Section III deals with the experimental setup. Section IV proposes the conclusions that are drawn from the results discussed in. Section V contains the summary and directions for future enhancement.
Behavior Prophecy of Stock Trader using
Machine Learning Techniques
II. RELATED WORK
Exploration of existing strategies gives better perceiveability in the current scenario; the related work gives a basic outline of various methodologies explored for problem arrangement. Kaya et al., [1] proposed a system to predict the stock price movement using rich online textual information extracted from the financial news articles. They classified financial news articles using support vector machines method and achieved an accuracy of 61%.
Hagenau M el al., [2] designed a four step method for processing text messages and combine them with their exogenous feedback. They classified text as positive and negative messages using support vector machines method. Bhat el al., [3] combined Neural Network method for stock price prediction. Blog articles and comments collected from National Stock Exchange were used as input and they built an automatic trading system which decided when to execute the buy and sell calls for trading on next market day.
Makrehchi el al., [4] proposed training data set for supervised learning of sentiment based on significant events. They used heuristic features and feature engineering task for sentiment classification.
Vincent et al., [7] discussed the prediction of next day stock index based on the tweet data. They applied sentiment analysis and subjectivity analysis in contrast to the past studies which concentrated on large population using social network data to predict customer’s attitude towards a company.
Pranjal et al., [8] predicted the future movement of Stock market by analysing the Sentiment Analysis of Twitter Feed. They used boosted Regression Tree classifier for predicting tomorrow’s stock movement by associating it with today’s tweets.
Xiaodong et al., [9] dealt with sentimental transfer learning to solve the news-poor training problem, through a hybrid association of news rich stocks and constructing a sentimental feature space. The prediction performance is measured through three-class version of accuracy.
Rajakumar et al., [10] performed Sentimental analysis on a stock market micro blogging service. The blog posts from stocktwits.com were classified using a J48 classifier ML algorithm to build a learning model. The results show that the mined sentiment has strong analytical value for fore coming market direction.
Yassine et al., [11] used amazon dataset that resulted from the product comments for Sentiment analysis. They proposed supervised learning algorithms like Support Vector Machine, Random Forest and Random Forest Support Vector Machine algorithms (RFSVM) for generating rules in classification technique. Their result showed Random Forest Support Vector Machine algorithm seems better than the other algorithms for product comments.
Bin et al., [12] applied Sentimental Analysis on tweets extracted from Twitter and news headlines so as to generate new predictors for investment. Random samples were chosen and each tweet was defined as bullish or bearish if it contained those terms. The result displayed that the occurrence of monetary terms and Twitter sentiment indicator are statistically significant predictors of regular market returns.
Sunil et al., [13] proposed sentimental analysis in Prediction of Stock Market Investment. The data is further
classified on the basis of polarity indexes using the features joyful, up, down and rejected. The sentimental analysis of these tweets is calculated by computing the index values of each category and overall sentence level score is calculated. Phayung et al., [14] discussed text-sentiment-based stock trend prediction model composing of SVM classifier model combined with a hybrid feature selection method. Confusion matrices, precision, recall, F-measure and accuracy are used to evaluate the proposed model. The results show that the hybrid feature selection method improves the accuracy of the stock trend prediction.
The examination of existing work talked about in writing on behavior analysis has urged us to concentrate on utilizing of ML methods on stock market data. This assembles an effective framework to set up the connection and characterize the moods of traders, in like manner regarding tags describing the situation. This work centers around grouping of traders comments, which concentrates the pecking order related with constant stock variations. The result of this examination would help us to predict classify the stock traders to counteract future outcomes of the wellbeing dependent on the present wellbeing status and stay away from stupendous losses in trading. The trials in this work utilize money control web application information. The back to back segments will centers around the information utilized.
III. EXPERIMENTAL SETUP
A.Data Acquisition
The primitive step of any experiment would be acquiring data from sources. Data selection for this work was obtained from the web (www.moneycontrol.com). Money control web application is network centric application, where the traders can get information about the stock values of various organizations and also express their opinion whether to sell, buy and hold the stocks out of their past experience. Money control website is one of the best portfolio manager helping the traders by recommending whether to buy, sell or hold the stocks. The comments posted by the traders would indicate the sentiment, behaviour of the traders. These comments of the traders would help us to build a machine learning model [1] [5] to predict and classify the mood of the trader contextually. The data set is acquired based of the tag such as buy, sell and hold for different organizations. The data is harvested for last 15 years and stored in repository for further modelling.
B.Data Modelling
Data modelling is one of the primary steps of data engineering. It is based on the modelled data the ML algorithms [2] [6] can produce relevant results. Fig. 1 details the process of data modelling and experimentation. Selenium data scraper tool is used to harvest the required last 15 years data from money control web application. The investors’ comments about stocks are extracted from web using the url of enterprises. The data is
International Journal of Innovative Technology and Exploring Engineering (IJITEE) ISSN: 2278-3075,Volume-8, Issue-11, September 2019
sell and hold) mentioned in the web crawler.
The harvested data is modelled into three classes such as buy, sell and hold.
[image:3.595.48.293.161.386.2]The harvested data would also contain other features which define the state of stock. The modelled data is then transformed into Term document matrix (TDM). TDM is sparse matrix; in which first column would represent the class id and rest of the columns represent the features.
Fig.1 Data Modelling and Experimentation C.Training and Testing.
The fundamental step of any Machine Learning model is training and testing. The modeled data is split into training and testing set in the ratio of 80:20. The training model is built on 80% of the modeled data and the testing the model is built using the remaining 20% of the modeled data. The results of the classifier and predictor model are evaluated using confusion matrix and Mean Square Error (MSE)[4]. The different classifier and predictors used are Support Vector Machine (SVM), Decision Tree, Random Forest, Artificial Neural Network-( Multi-Layer Perceptron), Logistics Regression and Ensemble method etc..
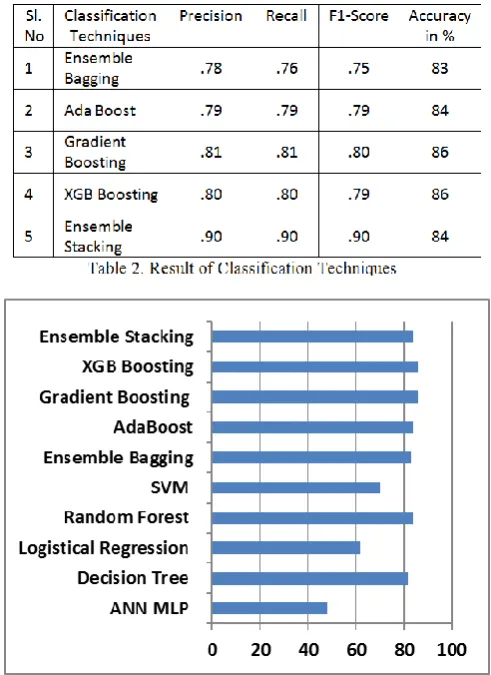
IV. RESULTS AND DISCUSSION.
The accuracy of the various classifiers is detailed in Table 1. The ML model was trained and evaluated with single classifiers.
Decision Tree and Random Forest method produces 82% and 84% percent of accuracy respectively, which is best when
related with other individual classifiers [5][6]. The outcome of the individual classifiers is unacceptable, until the model is evaluated with advanced methods.
[image:3.595.303.549.199.537.2]Ensemble methods help to improvise ML results by combining various models. This method allows the generation of more precise predictive performance when related to individual classifiers. The Ensemble methods are meta-algorithms that combine several machine learning techniques into one predictive model in order to decrease variance (bagging), bias (boosting), or improve predictions (stacking). The results of the Ensemble methods are detailed in Table 2.
Fig. 2: Accuracy of various Classification Techniques The presentation can be expanded by adjusting the learning model and with assistance of a theory space and a best-performing model is picked. With this it is conceivable to distinguish the AI model that fits the unique circumstance, we are managing.
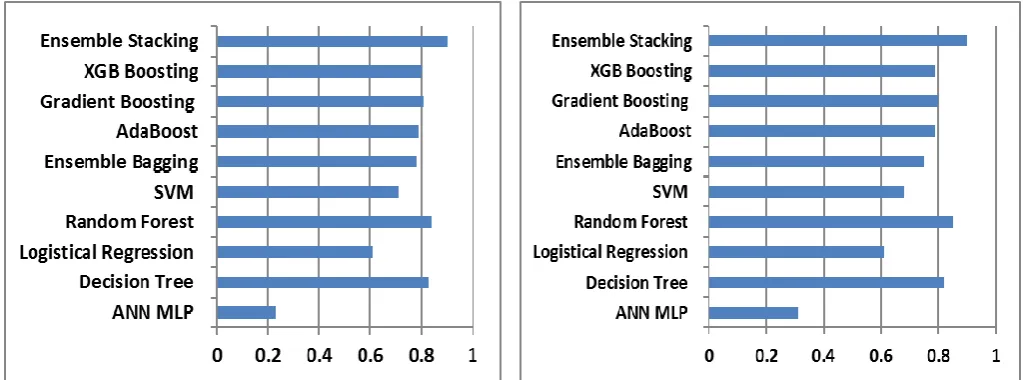
Fig. 3: Precision of Classification Techniques Exactness is given by the proportion of positive perceptions accurately anticipated to the all-out positive perceptions anticipated. Fig. 3 delineates the normal exactness of different classifiers.
[image:4.595.45.557.50.240.2]Review is given by the proportion of positive perceptions effectively anticipated for all perceptions in genuine classes. Fig. 4 portrays the normal review of different classifiers. Accuracy and Recall scores are spoken to by F1 scores. Unequivocally F1score is the normal loads of Recall and Precision. Both false positive and false negative are thought about during this assessment. At the point when precision is weighed against F1 score last demonstrates to be progressively valuable. Especially for an uneven class appropriation, F1 score assumes crucial job. Precision has high ground when both false positives and false negatives have associated expense [13][14]. On the contrary, when the expense of false positives and false negatives are unique Recall and Precision are alluded. Different classifiers' normal review is portrayed in Fig. 4.
Fig. 4: Recall of Classification Techniques The derivation is that slope boosting and XGB boosting procedure delivers the most noteworthy exactness of 86 % and it is apparent from the Table-1, and is demonstrated in a large portion of the cases. Troupe models have demonstrated to be steady and in this manner guarantee better execution for larger part of the experiments.
Fig. 5: F1-score of Classification Techniques
V. CONCLUSION
The focal point of our exploratory work is to fabricate an instrument for conceptualizing the behaviour of shareholder contemplating their mood. In this work, we have exploited the money control web information remarkably because of its vailibility. The information is extricated and rebuilt for stock data due to accessibility of enormous example of records, as larger part of the populace. ML techniques were then connected to set up the relationship amongst records and other narrative comments of the traders. The analysis was directed utilizing different order strategies to group the experiment to buy, sell or to hold the stock based on the importance of events. The model was assessed utilizing the disarray framework. The measurements, for example, F1 score, accuracy, review were considered for assessment. After exhaustive examination it was obvious that inclination boosting procedure a sort of troupe method creates the most noteworthy exactness of 86%. Outfit models display soundness and power, in this manner guaranteeing better execution for larger part of experiments. The principle overhead of this methodology is time. Thus it is not appropriate for ongoing applications.
[image:4.595.46.293.480.660.2]International Journal of Innovative Technology and Exploring Engineering (IJITEE) ISSN: 2278-3075,Volume-8, Issue-11, September 2019
REFERENCES
1. M. I. Kaya and M. E. Karsligil, “Stock Price Prediction Using Financial News Articles,” in proc. of 2nd IEEE International Conference on Information and Financial Engineering (ICIFE), pp. 478– 482, 2010.
2. M. Hagenau, M. Liebmann, M. Hedwig, and D. Neumann,
“Automated News Reading: Stock Price Prediction Based on Financial News Using Context-Specific Features,” in proc. of 45th Hawaii International Conference on System Science (HICSS), pp. 1040–1049, 2012.
3. A. Bhat and S. S. Kamath, “Automated Stock Price Prediction And
Trading Framework For Nifty Intraday Trading,” in the proc. of Fourth International Conference on Computing, Communications and Networking Technologies, doi:10.1109/icccnt.2013.6726675.
4. M. Makrehchi, S. Shah, and W. Liao, “Stock Prediction Using
Event-Based Sentiment Analysis,” in the proc. IEEE/WIC/ACM International Joint Conferences on Web Intelligence (WI) and Intelligent Agent Technologies (IAT), vol. 1, pp. 337–342, 2013.
5. Mohan Kumar K. N., S.Sampath, Mohammed Imran,
“Classification of Diagnostic Codes of Chronic Condition and Performance Evaluation of Various Approaches”, IJRTE, Volume-8, Issue-1, May 2019.
6. Mohan Kumar K N, S.Sampath, Mohammed Imran “An Overview
on Disease Prediction for Preventive Care of Health Deterioration”, IJEAT, Volume-8, Issue-5S, May 2019.
7. Vincent Martin, ”Predicting the French Stock Market using Social
Media Analysis”, in the Proc. of 8th
International Workshop on semantic and social media adaption and Personalization, pp. 3-7, IEEE, 2013.
8. Pranjal chakraborthy, Ummay sani Pria, Md. Rashad Al Hasan
Rony, Mahbub Alam Majumdar, “Predicting Stock Movement Using Sentiment Analysis of Twitter Feed”, in the proc. of Seventh International Symposium in Computational Medical and Health Technology (ICIEV-ISCMHT) doi:10.1109/iciev.2017.8338584.
9. Xiaodong Li, Haoran Xie, Tak-Lam Wong and Fu Lee Wang,
“Market Impact Analysis via Sentimental Transfer Learning”, in the proc. of IEEE International Conference on Big Data and Smart Computing (BigComp). doi:10.1109/bigcomp.2017.7881754.
10. M.P. Rajakumar, Dr.V.Shanthi, “A Comparison of Stock Trend
Prediction Using Accuracy Driven Neural network variants”, in the Proc. of Int. Conf. on Control, Communication and Power Engineering, pp.73-79, 2013.
11. Yassine AL AMRANI, Mohamed LAZAAR, Kamal Eddine EL
KADIRI, “Random Forest and Support Vector Machine based Hybrid Approach to Sentiment Analysis”, in the proc. of Procedia
Computer Science, 127, 511–520.
doi:10.1016/j.procs.2018.01.150.
12. Bin Wen, Wenhua Dai and Junzhe Zhao, “Sentimental
Classification Based on Semantic Comprehension”, in the Proc. of International Symposium on ISICS, pp. 458-461, 2012.
13. Sunil Kumar Khatri, Himanshu Singhal and Prashant Johri,
“Sentimental Analysis to Predict Bombay Stock Exchange Using Artificial Neural Network”, in the Proc. of ICRITO, pp. 380-384, 2014.
14. Phayung Meesad, Jiajia Li, “Stock Trend Prediction Relying on
Text Mining and Sentiment Analysis with Tweets”, in the Proc. of Fourth World congress on Information and Technology, pp.257-262, 2014.
AUTHORS PROFILE
B. N. Shankar, Research Scholar Gowda is currently working as Associate Professor in Department of Computer Science and Engineering, Bangalore Institute of Technology, affiliated to VTU, Karnataka. He received Masters’ Degree in Information Technology from Queensland University of Technology, Brisbane, Australia. Received Bachelor of Engineering Degree from UVCE, Bangalore University, Bengaluru. He has presented one paper each in ACM and Elsevier International Conference, one publication in ACM International Journal, and three papers presented in National Conference.
Dr. Vibha Lakshmikantha obtained her Bachelor’s of Engineering Degree and also Master’s Degree in Electronics and Communication from University Visvesvaraya College of Engineering, Bangalore University, Bengaluru. She was awarded Ph. D. in Computer Science from Dr. MGR