DYNAMIC WETTING ON MOVING SURFACES: A MOLECULAR DYNAMICS STUDY
Konstantinos Ritos∗
Department of Mechanical & Aerospace Engineering University of Strathclyde
Glasgow G1 1XJ UK
Email: [email protected]
Nishanth Dongari Yonghao Zhang Jason M. Reese
Department of Mechanical & Aerospace Engineering University of Strathclyde
Glasgow G1 1XJ UK
ABSTRACT
We report molecular dynamics (MD) simulations of the dy-namic wetting of nanoscale droplets on moving surfaces. The dynamic water contact angle and contact angle hysteresis are measured as a function of capillary number on smooth silicon and graphite surfaces. The hydrogen bonding and density profile variations are also reported, and the width of the water depletion layer is evaluated for droplets on three different static surfaces: silicon, graphite and a fictitious super-hydrophobic surface. Our results show that molecular displacements at the contact line are mostly influenced by interactions with the solid surface, while the viscous dissipation effects induced through the movement of surfaces are found to be negligible, especially for hydrophobic surfaces. This finding is in contrast with the wetting dynamics of macroscale droplets, which show significant dependence on the capillary number. This study may yield new insight into surface-wettability characteristics of nano droplets, in particular, devel-oping new boundary conditions for continuum solvers for liquid flows in micro- and nanoscale devices.
INTRODUCTION
Wetting phenomena play an important role in diverse pro-cesses in physics, chemistry, and biology [1–3]. A thorough understanding of solid-liquid interactions at a molecular level is
crucial to both fundamental research and technological applica-tions. Examples include surface coating, emulsions, oil recov-ery, and in microfluidic and nanofluidic applications [4–7]. The key experimental parameter describing the degree of wetting is the equilibrium contact angleθo, measured through the liquid L placed in contact with a solid S, at the contact line. The extent to which a liquid wets a given solid, i.e. the wettability, is im-portant in many natural and industrial processes. The wettability determines the equilibrium configuration of the system: ifθois
zero, then the liquid is said to wet the solid completely and the solid surface is fully hydrophilic; if it is 180o, then the system is said to non-wet the solid and the surface is fully hydrophobic.
During the dynamic wetting process, in which the contact line moves across the solid surface, several different channels of dissipation may come into play. For partially-wetting and non-wetting Newtonian liquids (and leaving aside dissipations within the main bulk of the liquid) the principal losses are viscous ones due to flow very near the contact line and contact-line friction associated with the creation (or loss) of the solid-liquid inter-face [8]. The actual physics that governs the wetting dynamics at the liquid-solid interface and predicting such processes in prac-tice, still remains pootly understood [9, 10]. One reason for this is that the dynamics is dictated by physical phenomena taking place on different length scales. The large-scale dynamics are typically governed by hydrodynamic theory, while the movement of the contact line is determined by processes on (or just) above
Proceedings of the ASME 2012 10th International Conference on Nanochannels, Microchannels, and Minichannels ICNMM2012 July 8-12, 2012, Rio Grande, Puerto Rico
molecular length scales. Another reason that dynamic wetting has remained mysterious is that experiments are quite difficult, with a large span in length scales and very rapid time scales [11]. There exist three principal theories for the description of dy-namic wetting phenomena, namely, the molecular-kinetic theory [8, 9] the hydrodynamic theory [12, 13] and the phase field the-ory [14–17]. Molecular-kinetic thethe-ory describes dynamic wet-ting as the disturbance of adsorption equilibria at the contact line. The movement of the contact line is determined by the statistical dynamics of the molecular motion within the three phase zone, where the solid, liquid and gas phases meet. Hydrodynamic the-ories are built on a continuum description and typically use the lubrication approximation involving either a microscopic cut-off length beyond which the solution is truncated or a postulated re-gion of local-slip between the liquid and solid. Another way to handle moving contact lines without violating the no-slip bound-ary condition is the phase field theory, which enables the contact line motion by diffusive interfacial fluxes. Its theoretical frame-work stems from a thermodynamic formulation [17], based on a description of the free energy in the system. Although all three theoretical formulations have been applied with some success, the models involve adjustable parameters that need to be deter-mined through fitting experimental data. In addition, the appli-cability of these models for nanoscale droplets is questionable, as the exact nature of hydrophobic and hydrophilic interactions at the nanoscale remains elusive and controversial [2, 4–6].
Molecular dynamics (MD) simulations have also been ex-tensively used to study surface wetting phenomena of nanoscale droplets [18–22]. Microscopic equivalence of the contact angle has been casually applied to nanometer-scale droplets on a wide variety of surfaces, such as polymers, cellulose, silica, graphite and carbon nanotubes among others, in order to establish a con-nection between microscopic calculation and macroscopic wet-ting properties of the surfaces. Sometimes the contact angle has been used as a reference in order to tune the intermolecular in-teraction parameters. In most cases, the surfaces have been held fixed during these simulations in order to save computation time, or for the lack of proper interaction parameters.
Here we investigate the interactions of water droplets at a nanometer length scale with moving silicon and graphite sur-faces, by using the molecular dynamics simulation method. Two different surfaces are studied and their velocities are varied in order to gain insights into the correlations between the surface movement and the hydrophobic and hydrophilic interactions at a molecular level. A fictitious super-hydrophobic surface is also studied under static conditions. Previous MD studies on dynamic wetting often focused on the behavior of water droplets of fixed size on stationary surfaces, while paying less attention to the movement of solid surfaces. Here, the dynamic contact angle and the contact angle hysteresis measurements are obtained at different velocities of surfaces. The structure of the nanoscale droplets is studied by looking at the water density profiles, water
depletion layers and hydrogen bonding near both the hydropho-bic and hydrophilic surfaces. The structure of the water density profiles at the interface with solid surfaces has been a topic of great interest and controversy over the past few decades. The ex-istence of a vapor-like depletion layer of water molecules near a superhydrophobic surface is discussed.
METHODOLOGY
To study the dynamic wetting of water on moving surfaces, a series of MD simulations of water droplets on smooth graphite and silicon are performed. Silicon is a hydrophilic material while graphite is neutral. In the following, the MD simulation tech-nique is described, along with the details on how the dynamic contact angle, contact angle hysteresis, density profiles, hydro-gen bond distribution and line tension are measured from the nu-merical experiments.
Molecular Dynamics Simulations
The rigid TIP4P/2005 water model [23] is used to model the interactions between individual water molecules. Studies have shown that this model can reproduce major water proper-ties more accurately than other commonly-used rigid models, such as the SPC/E, TIP3P, and TIP4P [24]. It consists of a O-O Lennard-Jones interaction withεOO=0.7749kJ mol−1and
σOO=3.1589 ˚A, and a smoothly truncated Coulomb potential acting between partial point charges on the fourth massless M site (−1.1128e) and hydrogen(0.5564e)atoms. In this study Hamilton’s quaternions [25] are used in order to retain the fixed geometry of the water molecule, with a O-H distance of 0.9572 ˚A
and an H-O-H angle of 104.52◦.
A series of at least 4 simulations are performed for each solid material in a range of capillary numbers (Ca), from 0.01 to 1.0, where
Ca=µUs
γ , (1)
silicon wall is constructed as a uniform crystallite. This silicon model is adapted to represent the fictitious hydrophobic mate-rial by altering the interaction parameter. The thickness of the surfaces are intentionally kept small as additional layers of solid material are not expected to have a significant influence on the water due to the employed cutoff radius of 12 ˚A. Periodic bound-ary conditions are applied in all directions of the simulation box, which in practice means that the droplet lies on a surface of infi-nite extent.
In all our simulations the water-wall interaction is solely based on a Lennard-Jones potential between the oxygen atom of the water molecule and the carbon or silicon atoms of the wall. The values of σCO=3.19 ˚A and σSiO=3.23 ˚A are em-ployed for all our simulations, following the Lorentz-Berthelot mixing rules and previous studies [22, 26, 27]. The interac-tion parametersεCO=0.427kJ mol−1,εSiO=2.36kJ mol−1and
εf iO=0.139kJ mol−1have been chosen in order to reproduce the
macroscopic static contact angle of the simulated water model on the selected surfaces, namely 86◦for graphite [28], 43◦for sili-con [29], and 150◦for the fictitious hydrophobic material.
Our simulations are performed using OpenFOAM v1.7 [30–32], which contains a parallelised non-equilibrium MD solver, that is open-source and available to download from www.openfoam.org. All simulations are carried out for a problem-time of 1ns, with an integration step of 2f sand a cut-off radius of 12 ˚A. An initial equilibration time of 200psis per-formed before sampling begins. During the equilibration time the system is coupled to a Berendsen thermostat at a tempera-ture of 300K, which is then removed for the latter part of the simulation. The sampling is performed in the microcanonical ensemble (NVE) of constant number of atoms, constant vol-ume, and constant energy. The water molecules are initially placed on a rectangular lattice with dimensions 5.8×6.2×1.6nm
which contains 2000 water molecules for the graphite surface or a 6.3×3.8×6.3nmrectangular lattice which contains 5000 wa-ter molecules for the silicon surface, respectively. Samples of the trajectory and measured values are stored every 0.2ps. Sim-ulations typically took 5 days using 4 or 8 cores on a parallel machine for the graphite and silicon surfaces, respectively.
Measurement Techniques
Water density isochore profiles are obtained from the MD simulation trajectories. The volume around the water droplet is divided into bins in the radial direction from the center of mass of the droplet, and also in the direction perpendicular to the solid surface. This results in a cylindrical binning with the center of mass of the water droplet as the reference axis. The bins have equal volume, and the average bin height is 0.5 ˚A. In order to capture the dynamic contact angle, the cylindrical binning is fol-lowing the center of mass of the water droplet at every timestep. In each bin the water density is calculated. In addition, the
bin-ning cylinder is divided into two parts, one for the advancing part of the droplet and one for the receding part, depending on the di-rection of the imposed velocity of the wall. With the resulting contour plots a two step procedure is followed in order to calcu-late the advancing (θ) and receding (φ) contact angles, similar to
the one described in [33]. First, the liquid-vapor interface con-tour line is chosen as the one with half the density of bulk water. Second, a circular best fit is applied on these points and is extrap-olated to the solid surface, where the contact anglesθandφare
then measured. It should be noted that points a distance less than 8 ˚Afrom the solid surface are not taken into account during the fitting. This ensures that any fluctuations at the liquid-solid in-terface do not affect the measurements. It was shown in previous studies that the choice of this distance has negligible effect on the measured contact angles. Moreover, the difference between the two measured angles represents the contact angle hysteresis (H). All density values and lengths presented in the following figures are in reduced units, with a reference density of 952.03kg/m3, and a reference length of 3.154 ˚A.
The hydrogen bonds (HB) distribution in the droplet is cal-culated using a similar binning procedure as for the water density described above. The geometrical criterion of Luzar and Chan-dler [34] is used to count the HB. Two water molecules are con-sidered to be hydrogen bonded if the oxygen and the hydrogen that form the HB are less than 3.5 ˚A apart and if the oxygen-oxygen oxygen-oxygen-hydrogen bond angle is less than 30◦.
Size effects are important when the contact angle measure-ment is considered. The modified Young’s equation [35] corre-lates the microscopic contact anglesθandφto the macroscopic
ones,θ∞andφ∞respectively. In the following figures and results
we always refer to the microscopic contact angles.
RESULTS AND DISCUSSION
sim-a
[image:4.612.60.268.69.467.2]c
b
FIGURE 1. TYPICAL SNAPSHOTS OF WATER DROPLETS AT THEIR EQUILIBRIUM STATE ON THREE DIFFERENT SUR-FACES: (a) SILICON, (b) GRAPHITE, AND (c) ARTIFICIAL HY-DROPHOBIC WALL. THE ATOMS COMPROMISING THE WA-TER MOLECULES ARE SHOWN IN RED (OXYGEN) AND WHITE (HYDROGEN), WHILE THE SOLID SURFACE ATOMS ARE IN BROWN (SILICON), GREY (GRAPHITE), AND GREEN (ARTIFI-CIAL HYDROPHOBIC SURFACE).
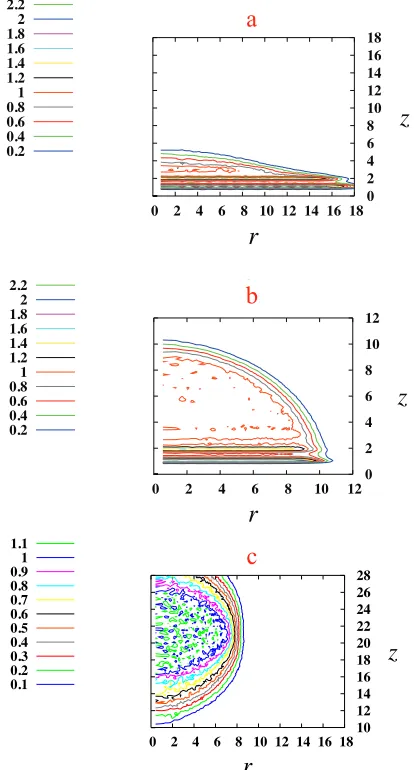
ulation of the silicon surface, while the droplet becomes more mobile laterally as the hydrophobicity increases. Using the den-sity contours (Fig. 2), equilibrium microscopic contact angles are evaluated for silicon, graphite and artificial hydrophobic surfaces as 26.8◦, 88.8◦and 180◦, respectively.
In Fig. 3, we show the density profiles of water droplets on three different surfaces along the direction normal to the sur-face (z-direction). The nanoscale droplet completely spread on
a
c
b
!" !# !$ !% !& !'" !'#!" !# !$ !% !& !'" !'#
!" !"()!' !'()!# !#()!* !#(#
!!!!# !'(& !'(% !'($ !'(# !!!!' !"(& !"(% !"($ !"(#
!
"
b
!" !# !$ !% !& !'" !'# !'$ !'% !'&!" !# !$ !% !& !'" !'# !'$ !'% !'&
!" !"()!' !'()!# !#()!* !#(#
!!!!# !'(& !'(% !'($ !'(# !!!!' !"(& !"(% !"($ !"(#
!
"
a
0 2 4 6 8 10 12 14 16 18 10 12 14 16 18 20 22 24 26 28
0 0.2 0.4 0.6 0.8 1 1.2 1.4 1.1
1 0.9 0.8 0.7 0.6 0.5 0.4 0.3 0.2 0.1
r
z
c
a
c
b
FIGURE 2. DENSITY CONTOURS OF WATER DROPLETS AT
THEIR EQUILIBRIUM STATE FOR (a) SILICON, (b) GRAPHITE, AND (c) ARTIFICIAL HYDROPHOBIC SURFACES. EQUILIB-RIUM CONTACT ANGLES ARE EVALUATED WHEN THE SOLID SURFACES ARE AT REST.
[image:4.612.344.551.79.464.2]the molecules. For the case of the strongly hydrophobic surface water molecules are not observed up toz=3nm, and for higher values ofzthe density increases monotonically to reach its bulk value.
0.0 0.5 1.0 1.5 2.0 2.5 3.0
0 5 10 15 20 25
*
z
[image:5.612.40.287.146.321.2]Graphite Silicon Artificial
FIGURE 3. WATER DENSITY PROFILES AS A FUNCTION
OF THE DISTANCE FROM THE SURFACE (Z-DIRECTION) THROUGH THE CENTER OF MASS OF THE DROPLET, FOR DIF-FERENT SURFACES RANGING FROM HYDROPHILIC TO HY-DROPHOBIC. DENSITYρ∗ AND LENGHTzARE IN REDUCED UNITS, WITH A REFERENCE DENSITY OF 952.03kg/m3AND A REFERENCE LENGTH OF 3.154 ˚A
The water depletion layer, which we define as the region be-tween the surface and the position where the water density falls below half the bulk density, can also be evaluated from Fig. 3. The width of the water depletion layer is negligible, less than 0.3 nm for both the silicon and graphite surfaces (around the size of two water molecules). This is consistent with the results of other recent studies showing that the thickness of the depletion zone can be a few angstroms for both hydrophilic and neutral surfaces [36]. The presence of the water depletion layer is sig-nificant for the hydrophobic surface and is around 4 nm in width. This depletion layer causes liquid droplets to effectively slip over hydrophobic surfaces, and is observed experimentally [37]. In general, the existence of a vapor layer near the interface is more likely for a hydrophobic surface. This is primarily because the structure of water molecules next to a hydrophobic surface is less ordered than in the bulk phase, while the cohesive strength of water may be significantly reduced. This is also consistent with Fig. 4 below, where the number of hydrogen bonds per water molecule formed close to hydrophobic surface are zero. Once the nucleation barrier exceeded, either the incipient depletion layer formed on the solid surface or in more realistic conditions,
gas molecules may be trapped in the gap between the liquid and solid layers. This effect acts to prevent the liquid from being directly exposed to the wall surface. In such cases, the liquid is not likely to experience the presence of the wall directly and may smoothly sail over the intervening depletion layers, instead of being in proximate contact with the wall.
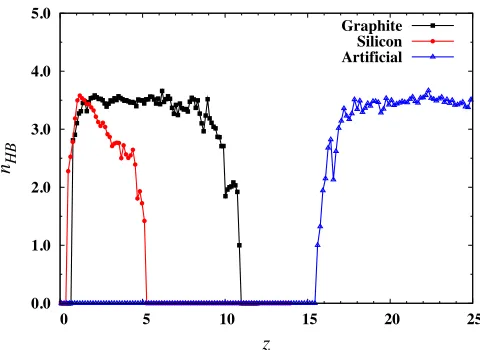
Figure 4 illustrates the average number of hydrogen bonds per water molecule along the direction normal to the surface, for the different surfaces. A closer look at the profiles for silicon and graphite surfaces reveals that the first peak for the number of hydrogen bonds per water molecule is located between the first and the second peak for the water density profile. The number of hydrogen bonds drops quickly near the surface as the very first layer of water molecules interfacing with the surface cannot form hydrogen bonds in the direction towards the surface. The rise in the number of hydrogen bonds between the first and second layer of water molecules means a locally tight structure of these two water layers through the extra hydrogen bonds in the region. For the hydrophobic surface, the profile increases monotonically before reaching its constant bulk value.
0.0 1.0 2.0 3.0 4.0 5.0
0 5 10 15 20 25
nHB
z
Graphite Silicon Artificial
FIGURE 4. THE AVERAGE NUMBER OF HYDROGEN BONDS
PER WATER MOLECULE ALONG THE DIRECTION NORMAL TO THE SURFACE, FOR DIFFERENT SURFACES RANGING FROM HYDROPHILIC TO HYDROPHOBIC.
[image:5.612.328.568.339.514.2]b
a
84 86 88 90 92 94 96
0.01 0.10 1.00 10.00
eD
!
Ca
Advancing angle Receding angle Static contact angle 18
20 22 24 26 28 30
0.01 0.10 1.00 10.00
eD
!
Ca
[image:6.612.52.282.76.415.2]Advancing angle Receding angle Static contact angle
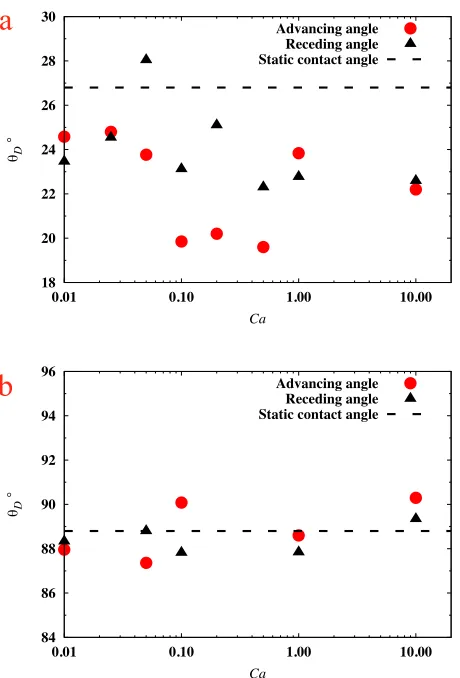
FIGURE 5. VARIATION OF THE DYNAMIC CONTACT ANGLE (θD) AS A FUNCTION OF THE CAPILLARY NUMBER (Ca), OF WATER DROPLETS ON MOVING SURFACES: (a) SILICON, AND (b) GRAPHITE.
are lower than the static one. Moreover, forCabetween 0.1 and 0.5 we observe that the advancing angle is reduced significantly. Figure 6 shows the contact angle hysteresis as a function of capillary number (Ca), for water droplets on moving surfaces. Unlike static surfaces, moving surfaces do not have equal ad-vancing and receding contact angles. Such deviations from the static equilibrium state result in a phenomenon called contact-angle hysteresis. This is defined as the difference between the advancing (θa) and receding (θr) contact angles, H=θa−θr. Hysteresis values for the graphite surface are roughly constant and close to 0◦, with small fluctuations. A stronger deviation from the static measurements is observed for the silicon surface, especially forCabetween 0.05 and 0.5.
For the silicon surface, Figs. 5 and 6 convey that we can classify theCa range into three distinctive regimes. The first for Casmaller than 0.05, the second for values between 0.05
-6 -4 -2 0 2 4 6
0.01 0.10 1.00 10.00
H
°
Ca
[image:6.612.321.566.77.250.2]Silicon Graphite
FIGURE 6. CONTACT ANGLE HYSTERISIS VERSUS CAPIL-LARY NUMBER (Ca), OF WATER DROPLETS ON MOVING SIL-ICON AND GRAPHITE SURFACES
and 0.5, and a third for all the higherCa values. In the first regime surface tension forces are dominant, while in the second regime viscous stresses, which are induced through the boundary moments, play a key role. In the third regime, inertial forces are significant compared to the other two effects.
CONCLUSIONS AND FUTURE WORK
We have presented molecular dynamics results of nanoscale water droplets on different moving surfaces. Silicon, graphite and an artificial material were chosen to model hydrophilic, neutral and hydrophobic surfaces, respectively. Water density and hydrogen bonding profiles were measured, and the effect of solid-liquid interactions on the formation of water depletion layers and the cohesive strength of water molecules were dis-cussed. In addition to the solid-liquid interaction effects, the vis-cous dissipation effects were also considered through the move-ment of the solid surfaces. It has been found that for nanoscale droplets the solid-liquid interactions play a vital role in deter-mining the wetting dynamics, while viscous dissipation effects induced through the movement of the surface are found to be negligible, especially on hydrophobic surfaces. These observa-tions are not consistent with the wetting dynamics of macroscale droplets, which show significant dependence on the capillary number.
It is imperative not to draw too strong conclusions based on these few test cases for nanoscale droplets. The present results motivate us to carry out the following work for a future paper : (i) obtain measurements for more capillary numbers in the range of 0.01 and 1 for all surfaces.
range of capillary numbers, in order to investigate size effects. (iii) apply the molecular kinetic theory to our MD data to enable us to extract the coefficient of contact line frictionζ, the molec-ular jump frequencyκ0 and the molecular jump lengthλ. The effect of droplet size on the measured properties can also be re-ported as a function of liquid-Knudsen number [16], which is the ratio of the molecular jump length to the characteristic macro-scopic length.
ACKNOWLEDGMENT
The authors would like to thank Dr. Matthew Borg for help with the MD methodology. The research leading to these results has received funding from the Engineering and Physical Sci-ences Research Council under grant EP/I011927/1. ND would like to thank the European Community’s Seventh Framework Programme FP7/2007-2013 for support through grant agreement ITN GASMEMS no215504.
REFERENCES
[1] de Gennes, P. G., 1985. “Wetting: statics and dynamics”.
Reviews of Modern Physics, 57(3), pp. 827–863.
[2] Lum, K., Chandler, D., and Weeks, J. D., 1999. “Hydropho-bicity at small and large length scales”.Journal of Physical
Chemistry B, 103(22), pp. 4570–4577.
[3] Stillinger, F. H., 1973. “Structure and aqua solutions of nonpolar solutes from the standpoint of scaled-particle the-ory”.Journal of Solution Chemistry, 2(2-3), pp. 141–158. [4] Huang, D. M., Chandler, C., Horinek, D., Netz, R. R., and
Bocquet, L., 2008. “Water slippage versus contact angle: A quasiuniversal relationship”. Physical Review Letters,
101(22).
[5] Janecek, J., and Netz, R. R., 2007. “Interfacial water at hy-drophobic and hydrophilic surfaces: Depletion versus ad-sorption”.Langmuir, 23(16), pp. 8417–8429.
[6] Chandler, D., 2007. “Physical chemistry: Oil on troubled waters”.Nature, 445, pp. 831–832.
[7] Dongari, N., 2011. “Liquid slip/stick over hydropho-bic/hydrophilic surfaces and their implications in coating processes”. Chemical Engineering and Processing, 50, pp. 450–453.
[8] Duviver, D., Seveno, D., Rioboo, R., Blake, T. D., and Con-inck, J., 2011. “Experimental evidence of the role of vis-cosity in the molecular kinetic theory of dynamic wetting”.
Langmuir, 27(21), pp. 13015–13021.
[9] Blake, T. D., 2006. “The physics of moving wetting lines”.
Journal of Colloid Interface Science, 299(1), pp. 1–13.
[10] Ren, W., and E, W., 2007. “Boundary conditions for the moving contact line problem”. Physics of Fluids,
19(022101).
[11] Bird, J. C., Mandre, S., and Stone, H. A., 2008. “Short-time dynamics of partial wetting”.Physical Review Letters,
100(234501).
[12] Huh, C., and Scriven, L. E., 1971. “Hydrodynamic model of steady movement of solid/liquid/fluid contact line”.
Journal of Colloid Interface Science, 35(1), p. 85.
[13] Voinov, O. V., 1976. “Hydrodynamics of wetting”. Fluid
Dynamics, 11(5), pp. 714–721.
[14] Jacqmin, D., 2000. “Contact-line dynamics of a diffuse fluid interface”.Journal of Fluid Mechanics, 402, pp. 57– 88.
[15] Cahn, J. W., and Hilliard, J. E., 1958. “Free energy of a nonuniform system. I. Interfacial free energy”. Journal of
Chemical Physics, 28(2), pp. 258–267.
[16] Carlson, A., Do-Quang, M., and Amberg, G., 2009. “Mod-eling of dynamic wetting far from equilibrium”.Physics of
Fluids, 21, p. 121701.
[17] Chakraborty, S., 2008. “Generalization of interfacial elec-trohydrodynamics in the presence of hydrophobic interac-tions in narrow fluidic confinements”.Physical Review
Let-ters, 100, p. 097801.
[18] Cruz-Chu, E. R., and Shulten, K., 2006. “Water-silica force field for simulating nanodevices”. Journal of
Phys-ical Chemistry B, 110, pp. 21497–21508.
[19] Hirvi, J. T., and Pakkanen, T. A., 2006. “Molecular dy-namics simulations of water droplets on polymer surfaces”.
Journal of Chemical Physics, 125(144712).
[20] Lundgren, M., Allan, N. L., and Cosgrove, T., 2003. “A molecular dynamics of study of wetting of a pillar-surface”.
Langmuir, 19, pp. 7127–7129.
[21] Schneemilch, M., and Quirke, N. J., 2007. “Effect of oxida-tion on the wettability of poly(dimethylsiloxane) surfaces”.
Journal of Chemical Physics, 127(114701).
[22] Werder, T., Walther, J. H., Jaffe, R. L., Halicioglu, T., and Koumoutsakos, P., 2003. “On the water-warbon interaction for use in molecular dynamics simulations of graphite and carbon nanotubes”.Journal of Physical Chemistry B, 107, pp. 1345–1352.
[23] Abascal, J. L. F., and Vega, C., 2005. “A general purpose model for the condenced phases of water: TIP4P/2005”.
Journal of Chemical Physics, 123(234505).
[24] Vega, C., and Abascal, J. L. F., 2011. “Simulating water with rigid non-polarizable models: a general perspective”.
Physical Chemistry Chemical Physics, 13, pp. 19663–
19688.
[25] Rapaport, D. C., 2004. The art of molecular dynamics
sim-ulation. Cambridge University Press, ch. 8, pp. 199–245.
[26] Cygan, R. T., Liang, J.-J., and Kalinichev, A. G., 2004. “Molecular models of hydroxide, oxyhydroxide, and clay phases and the development of a general force field”.
Jour-nal of Physical Chemistry B, 108, pp. 1255–1266.
D. J., and Cummings, P., 2011. “Simulations of the Quartz(1011)/Water Interface: A Comparison of Classical Force Fields, Ab initio Molecular Dynamics, and X-ray Re-flectivity Experiments”. Journal of Physical Chemistry C,
115, pp. 2076–2088.
[28] Fowkes, F. M., and Harkins, W. D., 1940. “The state of monolayers adsorbed at the interface solid-aqueous so-lution”. Journal of American Chemical Society, 62, pp. 3377–3386.
[29] Hermansson, K., Lindberg, U., Hok, B., and Palmskog, G., 1991. “Wetting properties of silicon surfaces”.
Interna-tional Conference on Solid-State Sensors and Actuators,
June, pp. 193–196.
[30] Macpherson, G. B., and Reese, J. M., 2008. “Molecular dy-namics in arbitrary geometries: parallel evaluation of pair forces”.Molecular Simulation, 34(1), pp. 97–115. [31] Macpherson, G. B., Nordin, N., and Weller, H. G., 2009.
“Particle tracking in unstructured, arbitrary polyhedral meshes for use in CFD and molecular dynamics”.
Com-munications in Numerical Methods in Engineering, 25(3),
pp. 263–273.
[32] Borg, M. K., Macpherson, G. B., and Reese, J. M., 2010. “Controllers for imposing continuum-to-molecular bound-ary conditions in arbitrbound-ary fluid flow geometries”.
Molecu-lar Simulation, 36(10), pp. 745–757.
[33] de Ruijter, M. J., Blake, T. D., and Coninck, J., 1999. “Dy-namic wetting studied by molecular modeling simulations of droplet spreading”.Langmuir, 15, pp. 7836–7847. [34] Luzar, A., and Chandler, D., 1996. “Hydrogen-bond
kinet-ics in liquid water”.Nature, 379, pp. 55–57.
[35] Wang, J. Y., Betelu, S., and Law, B. M., 2001. “Line tension approaching a first-order wetting transition: Experimental results from contact angle measurements”.Physical Review
E, 63(031601).
[36] Kashimoto, K., Yoon, J., Hou, B., Chen, C. H., Lin, B., Arotono, M., Takiue, T., and Schlossman, M. L., 2008. “Structure and depletion at fluorocarbon and hydrocar-bon/water liquid/liquid interfaces”. Physical Review
Let-ters, 101(076102).
[37] Tretheway, D. C., and Meinhart, C. D., 2002. “Apparent fluid slip at hydrophobic microchannel walls”. Physics of