City, University of London Institutional Repository
Citation: Raoufi, N. (2014). Development of wavelength dependent pH optical sensor
using Layer-by-Layer technique. (Unpublished Doctoral thesis, City University London)This is the unspecified version of the paper.
This version of the publication may differ from the final published
version.
Permanent repository link: http://openaccess.city.ac.uk/3668/
Link to published version:
Copyright and reuse: City Research Online aims to make research
outputs of City, University of London available to a wider audience.
Copyright and Moral Rights remain with the author(s) and/or copyright
holders. URLs from City Research Online may be freely distributed and
linked to.
City Research Online: http://openaccess.city.ac.uk/ [email protected]
Development of wavelength dependent pH optical
sensor using Layer-by-Layer technique
By
Nahid Raoufi
Thesis submitted for the degree of
Doctor of Philosophy
April 30, 2014
Instrumentation and Sensors Research Center (ISRC) School of Engineering and Mathematical Sciences
Page | 1
Table of Figures ... 6
Table of Tables ... 16
Acknowledgement... 17
List of Publication ... 19
Declaration ... 20
Abstract ... 21
Abbreviations ... 22
1. Introduction ... 24
1.1 Background ... 24
1.2 Aims and Objectives ... 25
1.3 Structure of the thesis ... 28
References ... 30
2. Overview of Thin Film Deposition Techniques ... 32
2.1 Introduction ... 32
2.2 Sol-Gel processing ... 35
2.2.1 Sol-gel chemistry ... 37
2.2.2 Surface sol-gel ... 41
2.2.3 Optical sensors based on sol-gel films ... 43
2.2.4 Advantages and disadvantages of the sol-gel process ... 45
2.3 Langmuir-Blodgett technique ... 46
2.3.1 Deposition of Langmuir-Blodgett films ... 51
2.3.2 Advantages and disadvantages of LB technique ... 60
Page | 2
2.4 Layer-by-layer self-assembly technique ... 62
2.4.1 Layer-by-layer deposition ... 64
2.4.2 Advantages of LbL technique ... 65
2.4.3 Disadvantages of LbL technique ... 67
2.5 Summary ... 68
References ... 70
3. Chemicals and Instrumentation ... 81
3.1 Introduction ... 81
3.2 Chemicals ... 83
3.2.1 pH indicator ... 83
3.2.2 Polymers ... 89
3.2.3 Types of chemicals ... 91
3.2.4 pH buffer solutions ... 91
3.3 Devices and components ... 92
3.3.1 Optical fibre ... 92
3.3.2 Connections and connectors ... 97
3.3.3 The light source ... 98
3.3.4 The detector ... 100
3.4 Preliminary operations of the sensor preparation ... 105
3.5 Experimental setup and data analysis ... 107
3.6 Summary ... 114
References ... 115
4. Principles of Layer-by-Layer Deposition Technique ... 118
4.1 Introduction ... 118
Page | 3
4.2.1 Substrate ... 120
4.2.2 Polyelectrolytes ... 121
4.2.3 Control of thickness ... 126
4.2.4 Dipping time (deposition time) ... 127
4.2.5 The concentration of the polyelectrolyte solution ... 128
4.2.6 Effect of pH of the polyelectrolyte solution ... 129
4.2.7 Effect of adding salt... 131
4.2.8 Number of bilayers ... 136
4.2.9 Influence of drying ... 138
4.2.10 Stability ... 140
4.3 Materials and method ... 142
4.3.1 Dipping Time and Washing time ... 144
4.3.2 Rinsing method ... 144
4.3.3 Number of bilayers (n) ... 145
4.3.4 The concentration of the polyelectrolytes ... 145
4.3.5 Drying and method of drying ... 148
4.3.6 Adding salt to the solution ... 152
4.4 Summary ... 152
References ... 154
5. pH Indicator Selection ... 164
5.1 Introduction ... 164
5.2 Materials and method ... 166
5.2.1 Materials ... 166
5.2.2 Methodology... 172
Page | 4
5.3 Results and discussion ... 186
5.4 Summary ... 188
References ... 190
6. Enhanced Sensitivity of a Fibre Optic pH Sensor Coated with Brilliant Yellow ... 193
6.1 Introduction ... 193
6.2 Materials and methods ... 196
6.2.1 Materials ... 196
6.2.2 Fabrication of the sensors ... 197
6.2.3 Experiments ... 198
6.3 Results and discussion ... 201
6.3.1 Number of layers ... 203
6.3.2 Shape of the probe ... 214
6.3.3 Concentration of BY solution ... 217
6.3.4 Fibre core diameter ... 220
6.4 Summary ... 221
References ... 224
7. Stabilization and Reusability ... 228
7.1 Introduction ... 228
7.2 Materials and methods ... 232
7.2.1 Chemicals ... 232
7.2.2 Procedures ... 233
7.2.3 Experiments ... 235
7.2.4 Heat treatment ... 237
Page | 5
7.2.6 Use of APTMS and silica nanoparticles... 246
7.2.7 Reusability and aging ... 251
7.3 Results and discussion ... 254
7.4 Summary ... 258
References ... 260
8. Conclusions and Future Work ... 264
8.1 Conclusion and overview of the work ... 264
8.2 Future work ... 269
Page | 6
Table of Figures
Fig 2-1 Typical configurations of optical fibre chemical sensors. In A and B the fibre is used to direct light; in C and D the sensor phase modifies the transmission characteristics of the fibre. The indicator can be placed on the tip of the fibre (A and B) or on the side (C); part of the cladding can be removed and leave the fibre core exposed to the chemical interaction
medium (D) [17]. ... 34 Fig 2-2 Sol gel technologies and their products [36]. ... 37 Fig 2-3 An example of sol-gel processing conditions on film
formation [35]. ... 39 Fig 2-4 Examples of deposition methods; (a) dip coating; (b) spin
coating and (c) spray coating [42]. ... 40 Fig 2-5 Schematic illustrations of three types of layer-by-layer
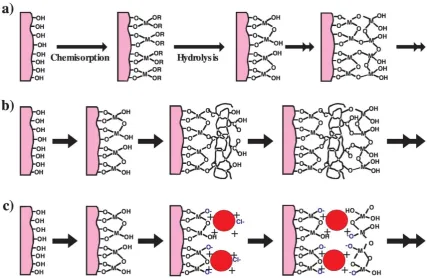
adsorption based on the surface sol–gel process. Stepwise adsorption of metal alkoxides (a), alternate adsorption of metal alkoxides and polyhydroxyl compounds (b), and alternate adsorption of metal alkoxide and cationic
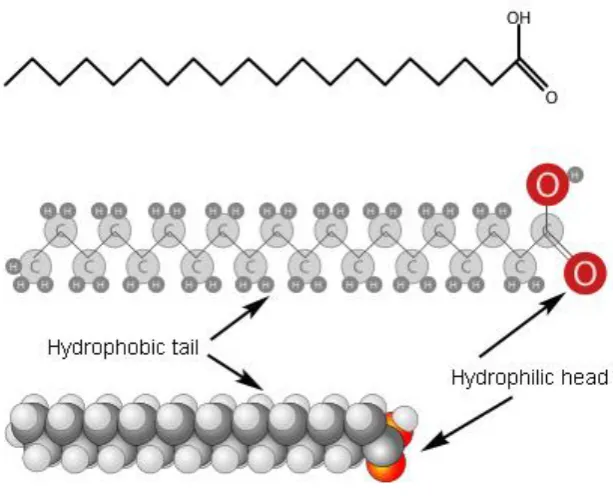
compounds (c) [47]. ... 42 Fig 2-6 The general chemical structure of an amphiphilic molecule. ... 47 Fig 2-7 Schematic diagram of a filter paper Wilhelmy plate. The
water makes contact with the paper with contact angle = 0. The water exerts a force on the plate equal to L, where is the surface tension and L is the length of the contact line of
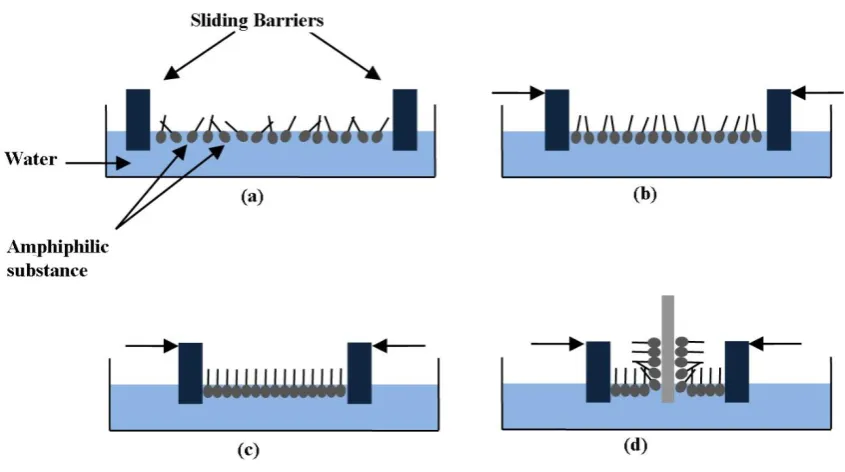
the water with paper [68]. ... 48 Fig 2-8 Surfactant molecules at different phases during monolayer
compression a) Spreading of an amphiphile solution at the air/water interface so-called gas phase; b) compressing of the monolayer after solvent evaporation to a desired surface pressure, so-called liquid phase; c) The monolayer
undergoes different phase transitions, so –called solid phase and d) Transfer of the Langmuir monolayer at a solid
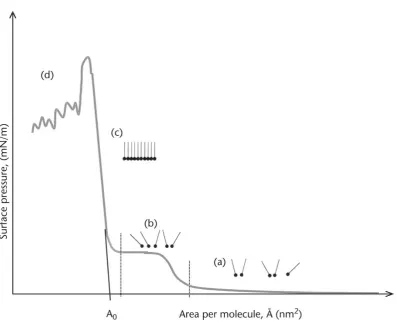
substrate by vertical dipping – Langmuir-Blodgett film [33]. ... 49 Fig 2-9 Typical π-A diagram of the Langmuir monolayer. (a) Gas
phase; (b) liquid phase; (c) solid phase; and (d) monolayer
Page | 7
Fig 2-10 Schematic of Langmuir-Blodgett setup. ... 52
Fig 2-11 KSV NIMA Trough equipped with a Langmuir-Blodgett trough [77]. ... 52
Fig 2-12 Principles of LB deposition on hydrophilic substrate: (a) Y-type deposition and (b) Z-Y-type deposition [3]. ... 55
Fig 2-13 Different types of LB film deposition: Y-type, alternative layers (ABAB…), X-type, and ... 56
Fig 2-14 Scheme of the LS technique. ... 58
Fig 2-15 Schematic of the fibre optic sensor of Flannery et al. [87]. ... 58
Fig 3-1 The main components of a fibre optic chemical sensor. The transducer: is an indicator immobilised on the optical fibre. Measurand: H+ concentration (supplied from pH buffer solutions). Light source is a tungsten halogen light. The detector: a spectrophotometer. ... 82
Fig 3-2 Variation of the % formation of a monoprotic acid, AH, and its conjugate base, A−, with the difference between the pH and the pKa of the acid [1]. ... 85
Fig 3-3 Chemical structure of some pH indicators e.g. Neutral Red (NR), Brilliant Yellow (BY), Litmus, Thiazol yellow G, Cyanidin and Thymol blue (TB). ... 90
Fig 3-4 The chemical structure of PAA (poly (acrylic acid)) and PAH (poly (allylamine hydrochloride)). ... 91
Fig 3-5 Types of optical fibres (a) step-index multimode, (b) graded-index multimode and (c) single-mode optical fibre [23]. ... 93
Fig 3-6 The full acceptance angle and max in an optical fibre. ... 95
Fig 3-7 Transmission profile of the multimode fibres used [25]. ... 96
Fig 3-8 The cross section of the bundle of 6 fibres grouped together. ... 97
Fig 3-9 The structure of the connections of a sensor device. ... 97
Fig 3-10 Emission spectra of light sources used in sensors. (a) white light sources and (b) LEDs/lasers light sources [21]. ... 100
Fig 3-11 Absorption of light by dyes. ... 101
Page | 8 Fig 3-13 The photograph of the prepared optical sensor probe
compared to 1 pence coin. ... 107 Fig 3-14 The experimental setup for a fibre optic chemical sensor
(The photo was taken by Jie Cao). ... 108 Fig 3-15 Comparison between spectroscopy of deposited glass slide
and the optical fibre in presence of buffer solution. ... 110 Fig 3-16 Dose-Response curve fitting model sample. ... 113 Fig 3-17 Degree of ionization versus pH for two kinds of indicators.
The slope is positive for the indicator with negative functional group and is negative for the indicator with
positive functional group. ... 113 Fig 4-1 The sequence of layer-by-layer electrostatic deposition. ... 119 Fig 4-2 Some standard polyions frequently used for multilayer
fabrication by LbL deposition technique ... 124 Fig 4-3 Schematic of globular conformation of a polymer chain with
low charge density (right) is shown in comparison with a polymer chain with high charge density (left). Polymer chains with lower charge density form globular
conformations and so thicker layers [58]. ... 127 Fig 4-4 Complete pH matrix showing the average incremental
thickness contributed by a PAH/PAA bilayer as a function of
dipping solution pH [55]. ... 130 Fig 4-5 The effect of salt in polyelectrolyte multilayers structure [9]... 131 Fig 4-6 The effect of salt on a polyelectrolyte molecule in solution in
high and low concentration of salt [89]. ... 133 Fig 4-7 Thickness of (PDADMA/PSS)10 built from 10 mM
PDADMA and PSS solutions at various salt concentration
on Si wafers [81]. ... 134 Fig 4-8 The root-mean-square roughness of (PDDA/PSS)10 deposited
from different NaCl concentrations. The error bars represent
standard deviations [91]. ... 134 Fig 4-9 The film thickness versus number of layers for three sets of
experiments of (PSS/PAH)n deposition in different salt
Page | 9 Fig 4-10 Thickness as a function of the number of layers for a
(PSS/PDADMAC)n multilayer deposited on silicon wafer
from 1.0 M NaCl(aq). polymer concentration 1 mM [52]. ... 137
Fig 4-11 Film thickness with increasing numbers of bilayers for single anion/ cation in deposited films [66]. ... 137
Fig 4-12 Wet sample versus dried sample [100]. ... 139
Fig 4-13 The heat treatment effect on the layers coated on the surface i.e the chemical reaction in PAH/PAA multilayer assemblies after heat treatment [112]. ... 141
Fig 4-14 Neutral red chemical structure. ... 142
Fig 4-15 The absorbance spectra (up) and the peak wavelength (down) versus number of bilayers of (NR/PAA)n coated on the glass slide while the concentration of the dye solution was 2 mM. ... 146
Fig 4-16 The effect of concentration of the solutions on the peak wavelength (up) and the absorbance (down) for (NR/PAA)n in the various number of bilayers. ... 147
Fig 4-17 The effect of concentration of the solutions on the absorbance spectra for (NR/PAA)n. ... 148
Fig 4-18 Comparison the maximum absorbance (up) and the peak wavelength changes (down) for the glass slides coated by (NR/PAA)n at three different drying conditions by N2 gas: without drying, drying after washing and drying after each stage. ... 150
Fig 4-19 Comparison the glass slides coated by (NR/PAA)20 at three different drying conditions: without drying, drying after washing, drying after each stage. ... 151
Fig 4-20 The effect of salt concentration on the appearance of the coated glass. ... 152
Fig 4-21 Different drying methods have different effect on the deposited glass slide. ... 152
Fig 5-1 Neutral Red’s chemical structure. ... 167
Fig 5-2 Absorbance Spectra for NR at different pH buffer solutions ... 167
Page | 10 Fig 5-4 Absorbance spectra for Brilliant Yellow in different pH
buffer solutions. ... 168 Fig 5-5 Chemical structure of Alizarin Red S. ... 169 Fig 5-6 Absorbance spectra for ARS in different pH buffer solutions. ... 169 Fig 5-7 Suggested chemical structure for Litmus. The repeating unit
consists of a substituted phenoxazone and two orcinol
residues [21]... 170 Fig 5-8 Orcinol(left) and Phenoxizone (right) chemical structures. ... 170 Fig 5-9 Chemical structure of Poly (aniline). ... 171 Fig 5-10 Absorbance spectra for Poly (aniline) in different pH buffer
solutions [22]. ... 171 Fig 5-11 Chemical structure of Congo Red. ... 172 Fig 5-12 Absorbance spectra for Congo Red at different pH buffer
solutions [23]. ... 172 Fig 5-13 The sensor part is a coated core which ended by a silver
mirror. ... 175 Fig 5-14 The peak wavelength value and absorbance changes when
adding bilayers on the surface for (PAH/BY)n deposited on
the glass slide. ... 177 Fig 5-15 The absorbance spectra for a probe coated with
(PAH/BY)20. The concentration of BY and PAH solutions
was 0.25 mM and 2.5 mM respectively. (Probe code: OFBY) ... 177 Fig 5-16 The peak wavelength as a function of the pH value of the
buffer solution for a probe coated with (PAH/BY)20 (Probe
code: OFBY). ... 178 Fig 5-17 The peak wavelength value and absorbance changes when
adding bilayers on the surface for (NR/PAA)n deposited on
the glass slide. ... 179 Fig 5-18 The optical fibre coated with NR in different pH buffer
solutions from pH 3 to pH 10. The concentration of NR and PAA solutions was 0.25 mM and 2.5 mM respectively.
(Probe code: OFNR) ... 179 Fig 5-19 The peak wavelength for each spectrum in respect to pH for
Page | 11 Fig 5-20 The peak wavelength value and absorbance changes when
adding bilayers on the surface for (PAH/ARS)n deposited on
the glass slide. ... 181 Fig 5-21 The optical fibre coated with ARS in different pH buffer
solutions from pH 3.0 to pH 9.0. The concentration of ARS and PAH solutions was 0.5 mM and 2.5 mM respectively.
(Probe code: OFARS) ... 181 Fig 5-22 The peak wavelength for each spectrum in respect to pH for
Fibre OFARS. (a) for range of pH from 3.0 to 9.0 (b) for low
pHs (c) for high pHs. ... 182 Fig 5-23 The wavelength value and absorbance changes when
adding bilayers on the surface for (PAH/(ARS+BY))n
deposited on the glass slide. ... 182 Fig 5-24 Absorbance spectra for the optical fibre coated with
(PAH/(ARS+BY))20 in different pH buffer solutions from
pH 6.0 to pH 9.0 (Probe code: OFABY). ... 183 Fig 5-25 The optical fibre coated with (PAH/(ARS+BY))20 in
different pH buffer solutions from pH 6.0 to pH 9.0. (Probe
code: OFABY) ... 184 Fig 5-26 The absorbance spectra for the optical fibre coated with
((PAA+NR)/ARS)20 in different pH buffer solutions from pH 6.0 to pH 9.0. The concentration of ARS, NR and PAH solutions was 0.5 mM, 0.5 mM and 2.5 mM respectively.
(Probe code: OFANR) ... 185 Fig 5-27 The optical fibre coated with ((PAA+NR)/ARS)20 in
different pH buffer solutions from pH 6.0 to pH 9.0. (Probe
code: OFANR) ... 185 Fig 5-28 Dark and fine spots on the surface of the coated glass slide
with (NR/PAA)15 while the surface coated with (PAH/BY)16
is totally homogenous. ... 187 Fig 6-1 Schematic of the U-bend and straight probes. ... 199 Fig 6-2 The experimental set up for straight probes (up) and U-bend
probes (down). ... 200 Fig 6-3 Absorbance spectra for the straight optical fibre coated using
Page | 12 Fig 6-4 Absorbance spectra for the straight optical fibre coated using
5.5 bilayers of (PAH/BY) in different pH buffer solutions. ... 205 Fig 6-5 Absorbance spectra for the straight optical fibre coated using
6 bilayers of (PAH/BY) in different pH buffer solutions. ... 205 Fig 6-6 Absorbance spectra for the straight optical fibre coated using
7.5 bilayers of (PAH/BY) in different pH buffer solutions. ... 206 Fig 6-7 Absorbance spectra for the straight optical fibre coated using
8 bilayers of (PAH/BY) in different pH buffer solutions. ... 206 Fig 6-8 Absorbance spectra for the straight optical fibre coated using
9.5 bilayers of (PAH/BY) in different pH buffer solutions. ... 207 Fig 6-9 The peak wavelength for each spectrum with respect to pH
for probes with different number of bilayers. ... 207 Fig 6-10 The peak wavelength for each spectrum with respect to pH
for probes with different number of bilayers. ... 208 Fig 6-11 The peak wavelength for each spectrum with respect to pH
for probes with different number of bilayers. ... 208 Fig 6-12 The peak wavelength for each spectrum with respect to pH
for probes with different number of bilayers. ... 209 Fig 6-13 The average wavelength shift for a sample of 0.2 pH units
at each measurement from pH 7 to pH 9 for the probes with 600 micron core diameter and 0.25mM of BY solution and
different number of bilayers. ... 209 Fig 6-14 The value of pKa for each probe versus number of layers. ... 212 Fig 6-15 The peak wavelength for each spectrum with respect to pH
for probes with different shapes when concentration of BY
solution.is 0.5 mM. ... 213 Fig 6-16 The peak wavelength for each spectrum with respect to pH
for probes with different shapes when concentration of BY
solution.is 0.25 mM. ... 214 Fig 6-17 The average wavelength shift for a sample of 0.2 pH units
at each measurement from pH 7 to pH 9 for the probes
coated with (PAH/BY)6 and variable properties. ... 215 Fig 6-18 The value of pKa for each probe versus shape of the probes
Page | 13 Fig 6-19 The peak wavelength for each spectrum with respect to pH
in different concentrations of brilliant yellow solutions for
big U-bend sensors. ... 218 Fig 6-20 The peak wavelength for each spectrum with respect to pH
in different concentrations of brilliant yellow solutions for
small U-bend sensors. ... 219 Fig 6-21 The peak wavelength for each spectrum with respect to pH
in different concentrations of brilliant yellow solutions for
straight sensors... 219 Fig 6-22 The peak wavelength for each spectrum with respect to pH
for probes with different core diameter. The wide fibre (P12)
and the narrow one (P05). ... 221 Fig 7-1 Chemical structure of (a) APTMS, (b) Poly (allylamine)
hydrochloride [PAH] and (c) brilliant yellow. ... 233 Fig 7-2 The maximum value of the relative absorbance (up) and the
peak wavelength (down) versus pH for the consecutive measurements of the pH solutions for (PAH/BY)8 on the glass slide. No heat treatment or drying was used in the
process. (The sample is designated GS01) ... 236 Fig 7-3 The maximum value of the relative absorbance (up) and the
peak wavelength (down) versus pH for the consecutive measurements of the pH solutions for (PAH/BY)16 on the glass slide. The sample was cured at 120°C for 4 hours. (The
sample is designated GS02) ... 238 Fig 7-4 The maximum value of the relative absorbance (up) and the
peak wavelength (down) versus pH for the consecutive measurements of the pH solutions for (PAH/BY)6 on the glass slide. The sample was cured at 120°C for 4 hours. (The
sample is designated GS03) ... 239 Fig 7-5 The maximum value of the relative absorbance (up) and the
peak wavelength (down) versus pH for the consecutive measurements of the pH solutions for
(PAH/BY)6(PAH/SiO2)2 on the glass slide. (The sample
designated as GS04) ... 241 Fig 7-6 The maximum value of the relative absorbance (up) and the
Page | 14 (PAH/BY)6(PAH/SiO2)2 on the glass slide. The sample was
cured at 130°C for 7 hours. (The sample designated as
GS05) ... 242 Fig 7-7 The maximum value of the relative absorbance (up) and the
peak wavelength (down) versus pH for the consecutive measurements of the pH solutions for
(PAH/BY)6(PAH/SiO2)2 on the glass slide. The sample was cured at 130°C for 7 hours and exposed to UV light for 20
minutes. (The sample designated as GS06) ... 243 Fig 7-8 The maximum value of the relative absorbance (up) and the
peak wavelength (down) versus pH for the consecutive measurements of the pH solutions for (PAH/(BY+SiO2))6 on the glass slide. The sample was cured at 120°C for 4 hours.
(The sample designated GS07) ... 245 Fig 7-9 APTMS is polymerized in aqueous solution after hydrolysis. ... 247 Fig 7-10 Two possibilities reaction between molecules of APTMS
and silica nanoparticles. ... 247 Fig 7-11 The maximum value of the relative absorbance (up) and the
peak wavelength (down) versus pH for the consecutive measurements of the pH solutions for
(PAH/BY)6(APTMS/SiO2)2 on the glass slide. The sample was cured at 120°C for 4 hours. (The sample designated
GS08) ... 248 Fig 7-12 The maximum value of the relative absorbance (up) and the
peak wavelength (down) versus pH for the consecutive measurements of the pH solutions for
(PAH/BY)6(APTMS/SiO2)2 on the glass slide. The sample was cured at 120°C for 4 hours and examined after a week.
(The sample designated GS09) ... 249 Fig 7-13 The maximum value of the relative absorbance (up) and the
peak wavelength (down) versus pH for the consecutive measurements of the pH solutions for (PAH/BY)6APTMS on the glass slide. The sample was cured at 120°C for 4 hours.
(The sample designated GS10) ... 250 Fig 7-14 The spectra for the coated glass slides with (PAH/BY)6
Page | 15 GS11), Down: pH 8 (The sample is designated GS12). The
samples were cured at 120°C for 4 hours. ... 252 Fig 7-15 The spectra for the coated glass slides with
(PAH/BY)6(APTMS/SiO2)2 dipped into the fresh buffer solution for three times and each time for 60 minutes. Up: pH 6 (The sample is designated GS13), Down: pH 8 (The sample is designated GS14). The samples were cured at
Page | 16
Table of Tables
Table 3-1 pH indicators and their colour with respect to pH range
[166, 167]. ... 88 Table 4-1 The effect of dipping time on the absorbance for the glass
slide coated with (NR/PAA)5. ... 144 Table 4-2 The effect of rinsing method on the absorbance for the
glass slide coated with (NR/PAA)6. ... 144 Table 4-3 The effect of presence of NaCl in the polyelectrolyte
solutions on the absorbance for (NR/PAA)6. ... 151 Table 4-4 The effect of drying method (gas and oven) on the
absorbance and wavelength for (NR/PAA)6. ... 151 Table 5-1 The parameters for curve fitting based on Dose-Response
model for the created probe. A1 and A2 are lowest and highest values of peak wavelength respectively, p is the slope factor, pKa is the acid dissociation constant and Y is
curve gradient in the inflection point. ... 186 Table 5-2 Cross comparison of the prepared sensors. ... 186 Table 6-1 Dose-Response curve properties for the prepared probes. ... 202 Table 7-1 The peak wavelength for two times consecutive
measurements for the glass slides, designated GS04, GS08 and GS09 in pH solutions from 6 to 9 and then from
Page | 17
Acknowledgement
I would like to express my sincere and deep gratitude to my advisor, Professor Muttukrishnan Rajarajan for his thoughtful guidance, steady encouragement and support. His style of supervising also allowed me to pursue a number of interesting subjects, which were quite beneficial to me. Additionally, I appreciate that he allowed me to support my daughter during my research.
I am also deeply indebted to Professor Tong Sun for letting me work in her laboratory. I greatly benefited from her comments on my presentations and her advice academically and personally. Working with her has been the most rewarding experience of my professional life.
Special thanks to Professor Kenneth Grattan for his advice, suggestions and support about my experiments as well as his important comments on my papers.
I would like to say my utmost gratitude to Dr Frederic Surre. It was he who introduced the Layer-by-Layer technique to me. I owe him a great deal for his constructive suggestions and ideas. I appreciate his invaluable help and encouragement throughout the completion of this research.
I would also like to thank Dr Ahad Bagherzadeh, Vice-Chancellor of Azad University in Oxford for his unlimited support.
Page | 18 I wish to thank all the researchers and students at Instrumentation and Sensors Research Center (ISRC) who have kindly assisted me through out this research through helpful comments and technical discussions, including Dr Jie Cao, Dr Shanika Lourdes Alwis, Mr Hieu Tu, Dr Thillainathan Venugopalan, Dr Ewan Galbraith, Dr Matthias Fabian, Dr Mohammad Uthman, Mr Fei Li, Ms Afrouz Farshad Mehr and Ms Labiba Gilani for their cheerful assistance and friendship.
Very especial thanks to my parents, for their endless encouragement, love and support both emotionally and financially.
I also wish to thank my husband Nasser and my daughter Alieyeh for their boundless love, hope and for always standing with me through all the ups and downs.
The staff of City University London and Azad University in Oxford especially Jim Hooker, Nathalie Chateline, Shekoufeh Tahmasebi and Mr Arfaei for being accommodating to my queries.
Page | 19
List of Publication
1. Raoufi, N.; Surre, F.; Sun, T.; Grattan, K.T.V. and Rajarajan, M.; Selection of optimized pH indicator for coating on optical fibre using the layer-by-layer technique, under preparation for Sensors and Actuators B: Chemical
2. N. Raoufi, F. Surre, M. Rajarajan, T. Sun and K.T.V. Grattan, Optical sensor for pH monitoring using a layer-by-layer deposition technique emphasizing enhanced stability and re-usability, Sensors and Actuators B: Chemical, Volume 195, May 2014, Pages 692–701
3. N. Raoufi, F. Surre, M. Rajarajan, T. Sun and K.T.V. Grattan, Fibre Optic pH Sensor Using Optimized Layer-by-Layer Coating Approach, Sensors Journal, IEEE, 14 (2014) 47 – 54, DOI: 10.1109/JSEN.2013.2280283. 4. N. Raoufi, F. Surre, T. Sun, M. Rajarajan and K.T.V. Grattan, Wavelength
dependent pH optical sensor using the layer-by-layer technique, Sensors and Actuators B: Chemical, 169 (2012) 374-381, DOI: 10.1016/j.snb.2012.05.024.
5. Raoufi, N.; Surre, F.; Sun, T.; Grattan, K.T.V. and Rajarajan, M.; Improvement of Optical Properties of pH- sensitive Nanolayers Coating Deposited using Layer-by-Layer Technique, IEEE Sensors 2012, DOI: 10.1109/ICSENS.2012.6411515
6. Nahid Raoufi , Frederic Surre, Tong Sun, Rajarajan Muttukrishnan, Kenneth T. V. Grattan, Optimisation of the design of fibre optic pH sensor based on layer-by-layer coating, SPIE Photonics Europe 2012 , [8439-93]
Page | 20
Declaration
Page | 21
Abstract
Stable and reliable operation of an optical sensor for pH monitoring is important for many industrial applications. This dissertation reports a series of studies on the development of novel and highly sensitive fibre optic sensors which are based on wavelength, instead of intensity changes and the development of thin film optical fibre working combinations for effectively enhancing the durability and value of the sensor probe.
Several novel optical fibre sensors were fabricated and evaluated in this work. In order to measure the pH of a solution using optical methods, the sensor probes were prepared using layer-by-layer deposition techniques, a simple and versatile method to deposit a sensitive thin film i.e. active pH indicators on such optical fibre-based devices.
In further work, the selection of a charged and water-soluble pH indicator which introduces the highest wavelength shift, while varying the pH of the media, was investigated since the wavelength shift was considered as the basis of the sensitivity index. Brilliant yellow (BY) was applied as an indicator because of its greater wavelength shift with pH change compared to the use of other indicators. Poly (allylamine hydrochloride) (PAH) was also used as a cross-linker. To this end, the layers of BY/PAH were deposited on the bare silica core optical fibre using the layer-by-layer technique.
The research was then developed to optimize the design factors that have an important effect on the sensitivity of the device. Utilizing U-shaped fibre with small radius which coated six bilayers of (BY/PAH) prepared from a polyion solution of low concentration was seen to provide a sensor with wider range of sensitivity which presents a highly sensitive device working over a smaller pH range offering higher resolution.
In a further study, covering the sensitive thin film with two layers of silica nanoparticles was seen to improve the wavelength stability and enhance the device shelf life. The particular result is that the peak wavelength continued to remain constant for a pH; however, the layers were destroyed during the course of several measurement events.
Page | 22
Abbreviations
A1 Lowest value of peak wavelength in Dose-Response model
A2 Highest value of peak wavelength in Dose-Response model
APTMS Aminopropyl-trimethoxy silane ARS Alizarin red S
BY Brilliant yellow
ci Molar concentration of ion i
CVD Chemical vapour deposition ESA Electrostatic Self-Assembly
I Ionic strength
Ka Acid dissociation constant
LB Langmuir - Blodgett LbL Layer-by-Layer
LD Laser diodes
LED Light emitted diode LS Langmuir-Schaefer
NA Numerical aperture
nair Refractive index of air
nclad Refractive index of the cladding
ncore Refractive index of the core
NR Neutral red
p Slope factor
Page | 23 PAH Poly (allylamine hydrochloride)
PSS Poly (sodium styrenesulfonate)
SPR Surface Plasmon Resonance
UV Ultra violet
zi Charge number of ion i
acceptance Acceptance angle
π Surface pressure
σ Surface tensions of water covered by LB monolayer
Page | 24
1.
Introduction
1.1
Background
Page | 25 water [8]. It also has an important role in environmental monitoring [9]. However, optical pH sensors have been considered more widely than other types of pH sensors in recent times, due to the demand for fast, reliable and high resolution sensors. Fibre optic techniques present many advantages that made such a technology a suitable candidate for real time pH point-sensing.
1.2 Aims and Objectives
New thin-film materials and devices with specific optical, chemical, electronic, mechanical and other properties are required for applications as sensors and measurement tools, in areas such as solar and photovoltaic cells, biocompatibility systems, microelectronic devices, communication systems, information storage, display systems, environmental treatment/purification systems and in many other fields.
The sensitivity of a pH sensor is, a measure of the degree of change in the sensor output with change in the solution pH. For example in optical sensors this transduction effect (that can then be related to the measurand) can be absorbance [10-12], reflected optical power [13, 14], transmitted power [15], or the wavelength at maximum absorbance [16]. Therefore, the sensitivity of the device will depend in part on the optimum choice of this transduction mechanism.
Page | 26 reading independent of source variation or any perturbation other than pH change.
In order to achieve optical recognition in the sensor device, active indicators must be used as sensitive films. Hence active indicators like azo dyes (for colourimetric purposes) should be immobilized on the optical fibres in the sensor device. Changing the optical properties of sensitive films by changing the analyte concentration is the basis of the recognition technique used. In this work the H+ concentration is the main parameter that has been measured through a pH monitoring. To date, reports of a limited number of pH indicators, such as neutral red, methylene blue and prussian blue which have been deposited onto optical fibres to create pH sensors have been published [11, 17-21]. In the present study, in order to identify a very suitable pH indicator which shows better performance based on wavelength change with narrow intervals based on colourimetric measurements, several indicators would be examined and their characteristics monitored and compared with each other and the indicator with the highest wavelength shift would be seen as very promising.
Page | 27 This thesis aims to develop a suite of pH optical sensors which work based on the wavelength shift principle and show high accuracy and stability.
The major objectives of the work reported in this thesis are:
To review critically the key literature associated with thin film deposition and self-assembly techniques as well as to create a comparison between these techniques and the layer-by-layer technique and thus to use the information developed in the design of devices.
To carry out a series of experiments to identity the most important parameters and the best process conditions for the preparation of the multilayer thin films to be used to coat the optical fibres used and thus create these novel optical fibre sensors.
To identify and select the most appropriate pH indicators which demonstrate stable and reproducible wavelength shifts with pH change. To create and optimize fibre optic pH sensor designs based on the results
of a series of experiments, thus leading to the most suitable values of different parameters for optimum sensor devices.
To monitor and optimize the stability of the films deposited on the optical fibres in order to enhance the stability of the sensors for use in continuous measurement and to create re-usable sensors with stable performance in terms of wavelength change.
Page | 28 based on the wavelength shift with a narrow pH change that will be a highly effective device in the field of fibre optic sensors.
1.3
Structure of the thesis
This thesis has aimed to pioneer better pH optical fibre sensor design, operating through as a precise function of wavelength, with high resolution. The layer-by-layer process was employed as a method for creation of reliable optical thin films. The thesis consists of eight Chapters reporting on work undertaken to achieve the objectives set out above.
Chapter 1 begins with a brief overview of the necessity for pH sensing and the use of self-assembly multilayers, comprising a short introduction to the aims, objectives and structure of the work.
Chapter 2 describes a review of the literature showing published techniques to create a self-assembly multilayer coatings covering different techniques and their pros and cons and thus providing a basis for the design of a new optical sensor system.
Chapter 3 reviews the key details of the materials and components, utilized to prepare and apply to creating a fibre optic chemical sensor using the layer-by-layer deposition technique.
Page | 29 based on the layer-by-layer technique to optimize the fabrication process for use in optical fibre devices for recognizing purposes.
Chapter 5 reports on an investigation of the functions of a number of pH indicators, to identify the most suitable pH indicator, which shows the optimum wavelength shift whilst the pH changes over very narrow pH intervals and based on colourimetric measurements, making comparison with the use of other indicators.
Chapter 6 is structured to report a detailed study carried out on the effects of different parameters on fibre optic pH sensors prepared as discussed above. This chapter investigates influential factors in the key sensing properties i.e. number of bilayers, thickness of the layers and number of molecules constituted the layers resulting from changing the concentration of the polyelectrolyte solution and also the shape of the probe; straight and/or U-bend with a view to optimizing the performance of the device.
Chapter 7 presents an overview of the variety of techniques studied to improve the stability of the films and to obtain a sensor with stable wavelength, independent on the length of usage and thus with optimized performance.
Page | 30
References
[1] A. S. Jeevarajan, S. Vani, T. D. Taylor, and M. M. Anderson, "Continuous pH monitoring in a perfused bioreactor system using an optical pH sensor," Biotechnology and Bioengineering, vol. 78, pp. 467-472, May 2002.
[2] P. Harms, Y. Kostov, and G. Rao, "Bioprocess monitoring," Current Opinion in Biotechnology, vol. 13, pp. 124-127, Apr 2002.
[3] S. A. Grant and R. S. Glass, "A sol–gel based fiber optic sensor for local blood pH measurements," Sensors and Actuators B: Chemical, vol. 45, pp. 35-42, 1997.
[4] S. A. Grant, K. Bettencourt, P. Krulevitch, J. Hamilton, and R. Glass, "In vitro and in vivo measurements of fiber optic and electrochemical sensors to monitor brain tissue pH," Sensors and Actuators B: Chemical,
vol. 72, pp. 174-179, 2001.
[5] E. J. Netto, J. I. Peterson, M. McShane, and V. Hampshire, "A fiber-optic broad-range pH sensor system for gastric measurements," Sensors and Actuators B: Chemical, vol. 29, pp. 157-163, 1995.
[6] F. Baldini, P. Bechi, S. Bracci, F. Cosi, and F. Pucciani, "In vivo optical-fibre pH sensor for gastro-oesophageal measurements," Sensors and Actuators B: Chemical, vol. 29, pp. 164-168, 1995.
[7] O. A. Young, R. D. Thomson, V. G. Merhtens, and M. P. F. Loeffen, "Industrial application to cattle of a method for the early determination of meat ultimate pH," Meat Science, vol. 67, pp. 107-112, 2004.
[8] A. Dybko, W. Wroblewski, J. Maciejewski, R. Romaniuk, and Z. Brzozka, Fiber optic probe for monitoring of drinking water vol. 3105. Bellingham: SPIE - Int Soc Optical Engineering, 1997.
[9] G. Marinenko and W. F. Koch, "A critical review of measurement practices for the determination of pH and acidity of atmospheric precipitation," Environment International, vol. 10, pp. 315-319, 1984. [10] J. Lin, "Recent development and applications of optical and fiber-optic
pH sensors," Trends in Analytical Chemistry, vol. 19, pp. 541-552, 2000. [11] J. Goicoechea, C. R. Zamarre˜no, I. R. Mat´ıas, and F. J. Arregui,
"Optical fiber pH sensors based on layer-by-layer electrostatic self-assembled Neutral Red," Sensors and Actuators B: Chemical vol. 132, pp. 305-311, 2008.
Page | 31 [13] I. D. Villar, I. R. Matias, and F. J. Arregui, "Fiber-optic chemical
nanosensors by electrostatic molecular self-assembly," Current Analytical Chemistry, vol. 4, pp. 341-355, 2008.
[14] I. D. Villar, I. R. Matías, F. J. Arregui, and R. O. Claus, "ESA-based in fiber nanocavity for hydrogen peroxide detection," IEEE Transactions On Nanotechnology, vol. 4, pp. 187-193, 2005.
[15] I. R. Matias, F. J. Arregui, J. M. Corres, and J. Bravo, "Evanescent field fiber-optic sensors for humidity monitoring based on nanocoatings,"
IEEE Sensors Journal vol. 7, pp. 89-95, 2007.
[16] C. R. Zamarre˜no, M. Hernáez, I. D. Villar, I. R. Matías, and F. J. Arregui, "Optical fiber pH sensor based on lossy-mode resonances by means of thin polymeric coatings," Sensors Actuat B-Chem vol. 155, pp. 290-297, 2011.
[17] J. Goicoechea, C. R. Zamarre˜no, I. R. Matias, and F. J. Arregui, "Utilization of white light interferometry in pH sensing applications by mean of the fabrication of nanostructured cavities," Sensors and Actuators B: Chemical vol. 138, pp. 613-618, 2009.
[18] J. Goicoechea, C. R. Zamarreño, I. R. Matías, and F. J. Arregui, "Study on White Light Optical Fiber Interferometry for pH Sensor Applications," in IEEE Sensors Conference, 2007.
[19] F. J. Arregui, l. L. l. R. Matias, and R. Claus, "An optical fiber pH sensor based.on the electrostatic self-assembly method," IEEE Sensors Journals, pp. 107-110, 2003.
[20] Y. Egawa, R. Hayashida, and J.-i. Anzai, "Multilayered assemblies composed of brilliant yellow and poly(allylamine) for an optical pH sensor," Analytical Sciences vol. 22, pp. 1117-1119, 2006.
Page | 32
2.
Overview of Thin Film
Deposition Techniques
2.1
Introduction
Page | 33 One of the important applications of thin film deposition is its use to functionalize an optical fibre for optical recognition purposes [9]. Optical sensors, sometimes called optrodes, represent a group of chemical sensors in which electromagnetic radiation in the optical part of the spectrum is used to generate the analytical signal in a transduction element. These sensors can be based on various optical principles (absorbance, reflectance, luminescence and fluorescence), covering different regions of the spectra (UV, visible, IR, NIR) and allowing the measurement of the degree of change in the sensor output which can be absorbance [10-12], reflected optical power [13, 14], transmitted power [15] and the wavelength at maximum absorbance [16], for instance. Optical fibres are commonly employed in this type of sensors to transmit the electromagnetic radiation to and from a sensing region that is in direct contact with the sample. The most common are distal-type sensors, in which the indicator chemistry is immobilized at the tip of a single or bifurcated optical fibre. Alternatively, the sensing chemical reagent can be immobilized along a section of the core of the optical fibre to make an evanescent field sensor as illustrated in Fig 2-1.
Page | 34 Fig 2-1 Typical configurations of optical fibre chemical sensors. In A and B the fibre is used to direct light; in C and D the sensor phase modifies the transmission characteristics of the fibre. The indicator can be placed on the tip of the fibre (A and B) or on the side (C); part of the cladding can be removed and leave the fibre core exposed to the chemical interaction medium (D) [17].
Langmuir-Page | 35 Blodgett, sol-gel and layer-by-layer approaches. This section explores these techniques and their characteristic and has provided an overview of the literature on thin film deposition techniques and recommendation for future designs, taking advantage of the gaps identified in current activity in the field.
2.2
Sol-Gel processing
The sol-gel technique is a deposition method widely used in materials science to prepare nanomaterials, especially composites [18-20]. The sol-gel method initially applied for ceramic fabrication. Later this method was successfully adopted for the processing of a wide variety of materials, from monolithic ceramic and glasses, to fine powders, thin films, ceramic fibres, microporous inorganic membranes, and extremely porous aerogel materials [18, 21-28]. The most widespread use of sol-gel is in coatings devices such as in antireflective coatings, optical or infra-red absorbing coatings, electrically conductive coatings and coating that protects against scratch, oxidation and erosion on all types of materials [18, 29-32].
Page | 36 and hence different products such as organic-inorganic hybrid materials [20, 22].
In the typical procedure, the precursor is mixed with water and a co-solvent (usually ethanol or methanol), yielding a homogeneous sol. Hydrolysis and polycondensation can be accelerated by employing an appropriate acid or base catalyst. As the reactions proceed, gradual increase of the solution's viscosity occurs and a rigid, porous, interconnected gel is formed. This gel is a bi-phasic system containing both a liquid phase (solvent) and a solid phase (integrated network, typically polymer network). After aging and drying at room temperature, a xerogel is obtained, which may be further densified at high temperatures if a non-porous material is intended. Thin xerogel films (in the range of 100 nm) can be formed on the solid substrates by dip coating, spin coating, or spraying of the solution. Heating of the xerogel completely removes solvent molecules which lead to further aggregation of inorganic clusters and the formation of solid materials, either bulk or in the form of thin films. Subsequent repeating of the routine allows the formation of thicker multilayered film [2, 20, 33, 34]. Sol-gel technologies and their products that are available at present are illustrated in Fig 2-2.
Page | 37 Fig 2-2 Sol gel technologies and their products [36].
2.2.1
Sol-gel chemistry
Page | 38 The sol-gel reaction, initiated by a catalyst, starts with the hydrolysis of alkoxides in the water-alcohol mixed solution, in which an alkoxide ligand replaces with a hydroxyl ligand as shown in the scheme below [20, 38]:
(Hydrolysis) M(OR)x + H2O → M(OR)x-1(OH) + ROH
Once hydrolysis has occurred the sol can react further and condensation (polymerisation) occurs.
(Alcohol condensation) 2M(OR)x-1(OH) → (RO)x-1M-O-M(OR)x-2OH + ROH
(Water condensation) 2M(OR)x-1(OH) → (RO)x-1M-O-M(OR)x-1 + H2O
It is these condensation reactions that lead to gel formation. In condensation two hydrolyzed fragments join together and either an alcohol or water is released. Condensation occurs by either nucleophilic1 substitution or nucleophilic addition.
The hydrolysis can be triggered by changes in pH of the solution. Acidic solutions are typically transparent, but become opaque at alkaline pH. This critical pH value indicates a transition point, when the reaction of hydrolysis becomes irreversible, and the sol-gel process begins. Fig 2-3 shows the effect of pH on the structure of produced thin films [35, 40].
1 A molecule or group having a tendency to donate electrons or react at electron-poor sites such as
Page | 39 Fig 2-3 An example of sol-gel processing conditions on film formation [35].
Sol-gel films can be deposited by spraying, dip coating or spin coating [35]. This process is very often performed in the dip-coating regime, in which the solid substrate is slowly pulled out from the solution containing the required
chemicals. The reaction known as gelation (i.e. sol-gel transition of the solution
in contact with the atmosphere) takes place in a thin liquid layer wetting the
substrate. The xerogel coating obtained requires additional annealing to remove
the residual solvent. The thickness of the resulting inorganic layer depends on
the viscosity of the solution, the withdrawal speed, and the wetting conditions of
the substrate (i.e., the contact wetting angle between the solution and the
substrate) [2].
Page | 40 is then spun rapidly about its axis. The drop is then driven by two competing forces: centrifugal forces cause the material to be thrown radially outwards, whereas surface tension and viscous forces will work against this spreading. Larger centrifugal forces creates thinner coating film. As the film thins, the solvent evaporates and the solution viscosity increases, reducing the radial flow. Eventually, the viscosity becomes so large that relative motion virtually ceases and the process is completed by evaporating the residual solvent [41]. Spin coating is commonly used in manufacturing microelectronic devices or magnetic storage discs.
Fig 2-4 Examples of deposition methods; (a) dip coating; (b) spin coating and (c) spray coating [42].
Page | 41 optical quality coatings can only be deposited on flat or weakly bent substrates [44].
For sol–gel coatings, the most popular deposition technique is the dip coating process, as it is easy to perform and results in high quality thin films.
The final stage of the formation of thin solid films prepared by the sol-gel route
is annealing. Two processes occur during annealing: (1) final evaporation of
solvent from the film matrix, and (2) further aggregation and sintering of
nanoclusters. The resulting films are typically polycrystalline, with the grain
size ranging from 10 to 20 nm [2].
The physico-chemical properties of the obtained gel and consequently the product depend on the parameters of the process. Factors such as the type of precursor, the pH, the nature and concentration of the catalyst, H2O:Si molar ratio (R), the type of additives, mechanical agitation, temperature, method and extension of drying, the presence of doping substances, or even the chemical nature of the gelation vessel may have a strong influence on the kinetics, growth reactions, hydrolysis, and condensation reactions as well as on the product characteristics such as porosity, surface area, refractive index, thickness and mechanical properties.
2.2.2
Surface sol-gel
Page | 42 groups is immersed in the alkoxide solution, rinsed with adequate organic solvent and the chemisorbed alkoxides are hydrolysed, as shown in Fig 2-5 (a). At this stage, hydroxyl groups are regenerated on the film surface, which can be employed for further chemisorption of metal alkoxides. This process, which is named the surface sol–gel process, is applicable to various alkoxides of titanium, zirconium, aluminium, silica, indium, tin, and vanadium metals [45].
Fig 2-5 Schematic illustrations of three types of layer-by-layer adsorption based on the surface sol–gel process. Stepwise adsorption of metal alkoxides (a), alternate adsorption of metal alkoxides and polyhydroxyl compounds (b), and alternate adsorption of metal alkoxide and cationic compounds (c) [47].
Page | 43 polyhydroxyl compounds as illustrated in Fig 2-5 (b) [46]. For example, by repeating chemisorption of titanium butoxide (Ti(OnBu)4) and poly(acrylic acid) (PAA), alternating layers of 1 nm thick TiO2-gel and PAA have been formed on the substrate by Ichinose et al. [46]. Similar multilayer assemblies are obtainable from various combinations of metal alkoxides and polyhydroxy compounds. This methodology has been utilized to incorporate organic dyes, protected amino acids, and sugar compounds into metal oxide gel films to conduct molecular imprinting techniques [47-49].
2.2.3
Optical sensors based on sol-gel films
The sol-gel deposition of thin films of a large number of materials for various
sensor applications has been reported so far. The use of the sol-gel process to produce materials for optical chemical sensors and biosensors is continuing to attract considerable interest. In most optical sensors, the chemical transducer (analyte1-sensitive) consists of immobilized chemical reagents e.g. organic and inorganic dyes, enzymes, proteins and so on, placed in the sensing region of the optical fibre either by direct deposition or by encapsulation in a polymeric matrix. The choice of the polymer support may influence the performance of the sensor, namely its selectivity and response time, and is governed by parameters like mechanical stability, permeability to the analyte and suitability for reagent immobilization [17, 50, 51]. Porous glass-like materials obtained by the sol–gel
Page | 44 method present several properties that make them attractive for use in optical chemical sensing applications [52-54].
Paula et al. in literature [17] have presented a comprehensive overview of the sol–gel thin films-based optical sensors. Applications reviewed include numerous sensors for determination of pH, gases, ionic species and solvents, as well as biosensors. Their survey clearly illustrates the growing interest on the sol–gel process to develop optical sensors.
As mentioned earlier, in order to obtain effective sensor devices, the chemical or biological transducer can be added to the sol during different steps of the process. The nature of the sol-gel process and the chemical inertia of sol–gel glass make the system ideal for the immobilization of numerous organic, organometallic and biological molecules. These combinations yield advanced materials that exhibit the flexibility and functionality of organics and many of the useful properties of inorganics, including stability, hardness and chemical resistance. For example, the fabrication of integrated optics devices1 using sol– gel precursors and photo-curable polymers coatings [55-57] allows the fabrication of a range of sensor configurations on planar substrates with higher sensitivity and photo-stability than dispersed dye molecules in a matrix which carries the problem of leaching [17, 51].
Page | 45
2.2.4
Advantages and disadvantages of the
sol-gel process
Although potential applications of sol-gel processing are numerous, the actual number of successful applications is rather few. There are many advantages and disadvantages in sol-gel processing in creating coatings for sensors. Thin films benefit from most of following advantages [2, 17, 20, 50, 58, 59]
High purity
High chemical homogeneity with multicomponent systems.
Relatively low temperature of preparation (usually 200-600°C).
Preparation of ceramics and glasses with novel compositions.
Ease of fabrication for special products such as films, powder and fibres.
Straightforward chemistry.
Smaller particle size and morphological control in powder synthesis.
Leading to inorganic-organic hybrid materials.
The adjustment of appropriate viscosities for coating.
The composition can be highly controllable.
Despite its advantages, the sol-gel technique rarely arrives at its full industrial potential due to several critical issues that need to be considered [17, 20, 26, 28, 35, 51, 59] such as those shown below:
Weak bonding
Expensive and hazardous raw materials.
Page | 46
High permeability.
Difficult controlling of porosity.
The trapped organics with the thick coating often result in failure during thermal process.
The present sol-gel technique is very substrate-dependent.
The coating suffers from contraction and cracking.
Leaching of reagent materials in sensing devices.
Diffusion-limited response time in sensors.
Limited life time usage as a sensor.
Instable sensitivity.
Unable repeatability of measurement in sensing devices.
2.3
Langmuir-Blodgett technique
Page | 47 orient themselves on the water surface with the polar “head” of each molecule in contact with the water and the chain tilted at a more or less steep angle with the plane of the water surface [2, 66].
Fig 2-6 The general chemical structure of an amphiphilic molecule.
Monolayer formation is made by the forces of self-assembly on insoluble molecules at the surface of the liquid and can be characterized by the parameter of the surface pressure (π), defined as the difference between the surface tensions of pure water (σ0) (i.e. 72-73 mN/m at room temperature [67]) and of water covered by the monolayer (σ) :
Page | 48 partially submerged in the water. If the contact angle of the water with the plate is θ, then the force exerted on the plate by the water is
[image:50.595.172.460.246.468.2]F = L cos Eq where L is the perimeter of the cross section of the plate. The Wilhelmy plates used can be a filter paper, for which the contact angle is zero, leaving F = L.
Fig 2-7 Schematic diagram of a filter paper Wilhelmy plate. The water makes contact with the paper with contact angle = 0. The water exerts a force on the plate equal to L, where is the surface tension and L is the length of the contact line of the water with paper [68].
Page | 49 interaction between the molecules [70]. This process takes several phases as can be seen from Fig 2-8 (a-d).
Fig 2-8 Surfactant molecules at different phases during monolayer compression a) Spreading of an amphiphile solution at the air/water interface so-called gas phase; b) compressing of the monolayer after solvent evaporation to a desired surface pressure, so-called liquid phase; c) The monolayer undergoes different phase transitions, so –called solid phase and d) Transfer of the Langmuir monolayer at a solid substrate by vertical dipping – Langmuir-Blodgett film [33].
Page | 50 state the molecules are densely packed and in which the molecules form an ordered array. The deposition of the film on a substrate is then performed by dipping the substrate through the thus formed monolayer [3, 33, 62, 70, 71]. This can be seen schematically in Fig 2-8 (d).
Fig 2-9 Typical π-A diagram of the Langmuir monolayer. (a) Gas phase; (b) liquid phase; (c) solid phase; and (d) monolayer collapse.
[image:52.595.126.524.207.533.2]Page | 51 (reducing the surface area by means of a moving barrier) at a constant rate while continuously monitoring the surface pressure. Depending on the material being studied, repeated compressions and expansions may be necessary to achieve a reproducible trace [65, 71-74]. The water subphase is temperature-controlled throughout the entire process [75].
2.3.1 Deposition of Langmuir-Blodgett films
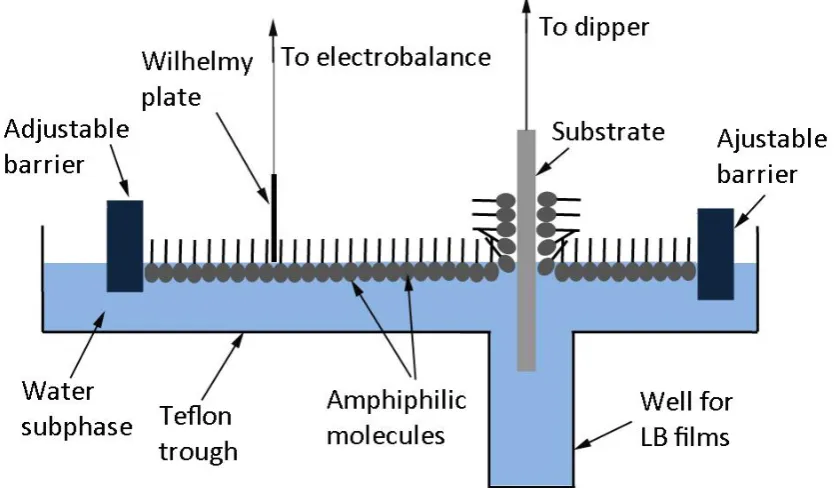
Page | 52 Fig 2-10 Schematic of Langmuir-Blodgett setup.
Page | 53 In the case of hydrophobic substrate, the deposition process starts from dipping. Some materials such as glass, quartz, silicon, etc. can be made hydrophobic by surface silanization [78]. Silicon becomes hydrophobic after treatment by hydrofluoric acid (HF) (but for few minutes). For silanization of the surface the substrate is dipped into solution of dimethyldichlorosilane ((CH3)2SiCl2) in hexane (5%) for 15 to 20 minutes and then into hexane, acetone and again hexane for 3- 5 minutes for each. Finally, washing with soap (mechanically) and with distilled water [3, 78]. The following reaction happens during the silanization of the surface:
Highly hydrophilic substrate can be prepared by surface treatment with acids, alkalines or solution of hydrogen peroxide [3, 78].
It should be noted that only selected compounds from the fatty acids family, having a number of carbon atoms between 14 and 24, are suitable for LB film deposition [71].
Page | 55 There are several parameters that affect on the type of LB film which can be produced. These are the nature of the spread film, the subphase composition and temperature, the surface pressure during the deposition and the deposition speed, the type and nature of the solid substrate and the time the solid substrate is stored in air or in the subphase between the deposition cycles [4, 63, 74, 79, 80]. Moreover, there are many external factors affecting the successful film transfer, and thus the quality of LB films, relating to issues such as water contamination, surface contamination, dust contamination and vibration [2, 3].
Page | 56 Fig 2-13 Different types of LB film deposition: Y-type, alternative layers (ABAB…), X-type, and Z-type [2].
The Langmuir-Blodgett films may be produced from fatty acid bivalent metal salts, which can be formed on the water surface according to the following reaction:
M2+ + 2(R- COOH) → (R- COO) 2M
[image:58.595.102.539.70.400.2]Page | 57 molecules, and thus yield much better quality LB films [62, 63]. The speed with which a film attaches itself to the solid substrate is governed by three factors, pH, salt concentration, and temperature of the water subphase [60, 83].
A Langmuir-Schaefer film is an alternative way to deposit the monolayer on a solid substrate and is very similar to Langmuir-Blodgett film. It is a film formed by one or several Langmuir films deposited onto a solid surface by horizontal dipping the solid substrate from the air towards water or from water through to the air as illustrated in Fig 2-14.
The immobilization of globular protein molecules onto different solid substrates by LB technique practically is often problematic. Because the majority of proteins are not amphiphilic, but soluble in water, they cannot form stable monolayers on the water surface. Therefore, proteins dissolved in the aqueous subphase can be electrostatically attached to the phospholipid monolayer on the air-water interface. The transfer of such phospholipid/protein complexes onto the solid substrate can be done by Langmuir-Schaeffer (LS) method [84].
Page | 58 Fig 2-14 Scheme of the LS technique.
The LB technique has been used for a number of fibre optic sensor applications [85-87]. For example, Flannery et al. [87] used Langmuir-Blodgett (LB) films deposited directly onto the polished region of an optical fibre to form a single-mode planar waveguide, evanescently coupled to a side- polished single-single-mode fibre for pH sensing. They could control the film thickness to 3 nm as shown in Fig 2-15.
Fig 2-15 Schematic of the fibre optic sensor of Flannery et al. [87].
Page | 59 achieved by spreading the acid from dilute chloroform solutions onto the pure water subphase of one compartment of a Nima Technology Model 2410A LB trough, leaving for 10 min at ~20C, and then being compressed at 0.5 cm2s-1 (~0.1% of total surface area). Deposition was then done at a surface pressure of 30 mN/m and a transfer rate of 10 mm/min. The fibre was oriented such that the dipping direction was aligned with the long axis of the fibre and it was alternately dipped and withdrawn through the floating monolayer at the air– water interface. Multiple layers had produced a Y-type structure. The film thickness was then determined by the product of the number of layers and the thickness of each molecular layer (2.6 nm). Choi et al. [88] developed a fibre optic biosensor using alcohol dehydrogenase (ADH)-immobilized Langmuir-Blodgett (LB) films for the measurement of ethanol concentration. The enzyme was immobilized on the lipid monolayers by adsorption from the aqueous subphase solution. From the measurement of the surface pressure-area isotherm and retained enzyme activity for the four types of lipids, they determined that negatively charged arachidic1 acid (its molecular structure shown in Fig 2-6) was the most suitable for adsorption of ADH, based on its electrostatic force as well as hydrophobicity, compared to other lipids they applied (the full-text of this literature was not accessible). Caseli et al. reported in their work [89] on the construction of a new phytic2 acid biosensor on the basis of the Langmuir-Blodgett (LB) technique. Phytase was inserted in the subphase solution of
1 Arachidic acid, also called eicosanoic acid, is the saturated fatty acid with a 20-carbon chain. It is as a
minor constituent of peanut oil and corn oil.
2 A saturated cyclic acid, is the principal storage form of phosphorus in many plant tissues, especially
Page | 60 dipalmitoylphosphatidylglycerol (DPPG) Langmuir monolayers, and its incorporation to the air-water interface was monitored with surface pressure measurements. Phytase was able to be incorporated into DPPG monolayers even at high surface pressures, of 30 mN/m, under controlled ionic strength, pH, and temperature conditions. Tao et al. [90] used the Langmuir−Blodgett technique to assemble monolayers (with areas over 20 cm2) of aligned parallel silver nanowires which could be used as substrates for deposition of sensitive layers for sensing devices.
2.3.2 Advantages and disadvantages of LB technique
Although the LB technique is one of the oldest methods for deposition of thin films, it offers several advantages over other techniques The most important advantages of multilayers created by means of LB technique are as follows [67, 68, 91-94]:
High uniformity of the film combined with mutual orientation of the molecules and functional groups composing the film.
The possibility of precise controlling of film thickness to an accuracy of a single molecule.
A useful tool to fabricate monolayer and/or multilayer films with controllable structure in the molecular level.
Page | 61
The possibility of varying the chemical nature of the film by varying the nature of the amphiphile or by creating mixed monolayers.
It has a high potential to use in a variety of industrial applications.
The deposition process can be carried out in low temperature and normal pressure.
There are several disadvantages of the LB film technique which are as follow
[62, 65, 70, 79, 95-98]
Poor mechanical and thermal stability of LB films because the resultant films formed are held together by Van der Waals forces.
LB films are poorly adhesive, too soft and fragile, and therefore can be
easily damaged during preparation and exploitation.
Lack of flexibility in shape and size of the substrate. It enables to align layers for only flat panels.
In addition to the poor thermostability of films built from aliphatic compounds, there have been reports of changes in film properties with time.
Lack of flexibility in choosing molecules of different structures and functions. It can only be used for molecules that are water-insoluble and have surfactant-like properties.

![Fig 2-2 Sol gel technologies and their products [36].](https://thumb-us.123doks.com/thumbv2/123dok_us/1523827.104961/39.595.116.522.104.367/fig-sol-gel-technologies-products.webp)
![Fig 2-3 An example of sol-gel processing conditions on film formation [35].](https://thumb-us.123doks.com/thumbv2/123dok_us/1523827.104961/41.595.112.526.68.284/fig-example-sol-gel-processing-conditions-film-formation.webp)
![Fig 2-4 Examples of deposition methods; (a) dip coating; (b) spin coating and (c) spray coating [42]](https://thumb-us.123doks.com/thumbv2/123dok_us/1523827.104961/42.595.117.511.368.570/fig-examples-deposition-methods-coating-coating-spray-coating.webp)