Architecture for Scalable, Distributed Database
System built on Multicore Servers
Kangseok Kim1, Rajarshi Guha3, Marlon E. Pierce1, Geoffrey C. Fox1, 2, 3, 4,
David J. Wild3, Kevin E. Gilbert3
1Community Grids Laboratory, Indiana University, Bloomington, IN 47404, USA
2Department of Computer Science, Indiana University, Bloomington, IN 47404, USA
3School of Informatics, Indiana University, Bloomington, IN 47404, USA
4Physics Department, College of Arts and Sciences, Indiana University, IN 47404, USA
{kakim, rguha, marpierc, gcf, djwild, gilbert}@indiana.edu
Abstract—
Many scientific fields routinely generate huge datasets. In many cases, these datasets are not static but rapidly grow in size. Handling these types of datasets, as well as allowing sophisticated queries necessitates efficient distributed database systems that allow geographically dispersed users to access resources and to use machines simultaneously in anytime and anywhere. In this paper we present the architecture, implementation and performance analysis of a scalable, distributed database system built on multicore systems. The system architecture makes use of a software partitioning of the database based on data clustering, termed the SQMD (Single Query Multiple Database) mechanism, a web service interface and multicore server technologies. The system allows uniform access to concurrently distributed databases over multicore servers, using the SQMD mechanism based on the publish/subscribe paradigm. We highlight the scalability of our software and hardware architecture by applying it to a database of 17 million chemical structures. In addition to simple identifier based retrieval, we will present performance results for shape similarity queries, which is extremely, time intensive with traditional architectures.1. INTRODUCTION
In the last few years, we have witnessed a huge increase in the size of datasets in a variety of fields (scientific observations for e-Science, local (video, environmental) sensors, data fetched from Internet defining users interests, and so on [35, 41]). This trend is expected to continue and future datasets will only become larger. Given this deluge of data, there is an urgent need for technologies that will allow efficient and effective processing of huge datasets. With the maturation of a variety of computing paradigms such as grid computing [14, 22], mobile computing [34], and pervasive computing [30], and with the advance of a variety of hardware technologies such as multicore servers [29], we can now start addressing the problem of allowing geographically dispersed users to access resources and to use machines simultaneously in anytime and anywhere.
The problems of effectively partitioning a huge dataset and of efficiently alleviating too much computing for the processing of the partitioned data have been critical factor for scalability and performance. In today’s data deluge the problems are becoming common and will become more common in near future. The principle “Make common case fast” [26] (or “Amdahl’s law” which is the quantification of the principle) can be applied to make the common case faster since the impact on making the common case faster may be higher, while the principle generally applies for the design of computer architecture.
This paper is organized as follows. Section 2 presents the problem and our general approach to a solution. We discuss related work in Section 3. Section 4 presents the architecture of our scalable, distributed database system built on multicore servers. Section 5 briefly describes the properties of the Pub3D, a database of 3D chemical structures, which we use as a case study for our architecture. Section 6 presents experimental results to demonstrate the viability of our distributed database system. Finally we conclude with a brief discussion of future work and summarize our findings.
2. PROBLEM STATEMENT
With the advances in a variety of software/hardware technologies and wire/wireless networking, coupled with large end-user populations, traditionally tightly-coupled client-server systems have evolved to loosely-coupled three-tier systems as a solution for scalability and performance. The workload of the server in two-tier system has been offloaded into the middleware in three-tier system in considering bottlenecks incurred from: increased number of service requests/responses, increased size of service payload, and so on. Also with the explosion of information and data, and the rapid evolution of Internet, centralized data have been distributed into locally or geographically dispersed sites in considering such bottleneck as increased workload of database servers. But in today’s data deluge, too much computing for the processing of too much data leads to the necessity of effective data fragmentation and efficient service processing task. For instance, as the size of data increases, the response time of database server will increase by its increasing workload. One solution to the problem is to effectively partition large databases into smaller databases. The individual databases can then be distributed over a network of multicore servers. The partitioning of the database over multicore servers can be a critical factor for scalability and performance. The purpose of the multicore’s use is to facilitate concurrent access to individual databases residing on the database server with independent threads of execution for decreasing the service processing time. We have already encountered the scalability problems with a single huge dataset – a collection of 3D chemical structures [6] during our research work. We believe that the software and hardware architecture described in Section 4 will allow for effective data fragmentation and efficient service processing resulting in a scalable solution.
3. RELATED WORK
The middleware in a three-tier distributed database system also has a number of bottlenecks with respect to scalability. We do not address the scalability issues for middleware in this paper since our system can be scaled well in size by a cluster (or network) of cooperating brokers [1, 18]. In this paper we focus on the issue related on data scalability. For data scalability, other researchers showed a database can be scaled across locally or geographically dispersed sites by using such fragmentation methods as vertical partitioning, horizontal partitioning, heuristic GFF (Greedy with First-Fit) [11], hash partitioning [5], range/list/hash partitioning [21], and so on. On the other hand, we address the problem of partitioning a database over multicore servers, based on data clustering [10] such that intra-cluster similarity (using the Euclidean metric) is greater than inter-cluster similarity. The use of data clustering in general has been explored in the field of data mining. We performed the clustering using algorithms developed by the SALSA project [35] at the CGL [8]. The details of the clustering method are described in [45]. Also in our work we utilized multicore servers which enable multithreading of executions to provide scalable service to our distributed system. The utilization of the hardware device to aid data scalability was not addressed yet. The partitioning of the database over the multicore servers have emerged from a necessity for the new architectural design of the distributed database system from scalability and performance concerns against coming data deluge. Our architecture is similar in concept to that of SIMD (Single Instruction stream, Multiple Data stream) [42], in that a single unit dispatches instructions to each processing unit. The SMMV (Single Model Multiple Views) collaboration model (to build applications as web services in M-MVC (Message-based Model-View-Controller) architecture) which generalizes the concept of SIMD is used for collaborative applications such as shared display [15]. The difference between SQMD and SMMV is direct communication between front-end (or view) and back-end (or model). In the SQMD architecture, the front-end always communicates with back-end through middleware (or controller), where the view in the SMMV architecture can communicate directly with the model. Therefore the back-ends (or distributed databases) are transparent to the front-ends (or end-users) in SQMD. The SQMD uses the data parallelism in a manner similar to that of SIMD, via a publish/subscribe mechanism. In this paper we discuss data scalability in the distributed database system with the software and hardware architecture, using a collection of more 17 million 3D chemical structures.
4. ARCHITECTURE FOR SCALABLE DISTRIBUTED DATABASE SYSTEM BUILT ON MULTICORE BASED SYSTEMS
Our hardware (using multicore machines) and software (with web service, SQMD using publish/subscribe mechanism, and data clustering program) architecture concentrates on increasing scalability with increased size of distributed data, providing high performance service with the enhancement of query/response interaction time, and improving data locality. The purpose of the software/hardware’s use in our architecture is to provide a basis for data scalability, high performance query service, and data locality. In order to decrease the processing time and to improve the data locality of a query performed as the size of data increases, we used MPI (Message Passing Interface) [28] style multi-threading on a multicore machine by clustering data through clustering program developed by CGL and associating the clustered data (put into databases) with each of threads generated within the database agent. But the threads do not communicate with each other as MPI does. The multithreading within the database agent multitasks by concurrently running multiple databases, one on each thread associated with each core.
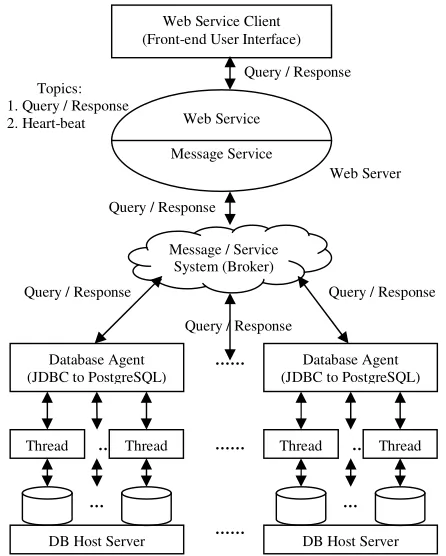
Figure 1: Scalable, distributed database system architecture is composed of three tiers: web service client (front-end), web service and broker (middleware), and agents and a collection of databases (back-end).
Our message and service system, which represents a middle component, provides a mechanism for simultaneously disseminating (publishing) queries to and retrieving (subscribing) the results of the queries from distributed databases. The message and service system interacts with a web service which is another service component of the middleware, and database agents which run on multicore machines. The web service acts as query service manager and result aggregating service manager for heterogeneous web service clients. The database agent acts as a proxy for database server. We describe them in each aspect in the following subsections.
4.1. Web Service
A web service is a software platform to build applications running on a variety of platforms as services [43]. The communication interface for web service is described by XML [13] that follows SOAP (Simple Object Access Protocol) standard [36]. Other heterogeneous systems can interact with the web service through a set of descriptive operations using SOAP. For web services we used the open-source Apache Axis [2] library which is an implementation of the SOAP specification. Also we used WSDL (Web Service Description Language) [44] to describe our web service operations. A web service client reads WSDL to determine what functions are available for database service: one service is query request service and the other is reliable service which detects whether database servers fail.
……
…… ……
Topics: 1. Query / Response 2. Heart-beat
Web Server
Query / Response Query / Response
Query / Response
Query / Response Query / Response
Web Service Client (Front-end User Interface)
Web Service Message Service
Message / Service System (Broker)
…
…
Database Agent (JDBC to PostgreSQL)
DB Host Server
Thread Thread …
…
Database Agent (JDBC to PostgreSQL)
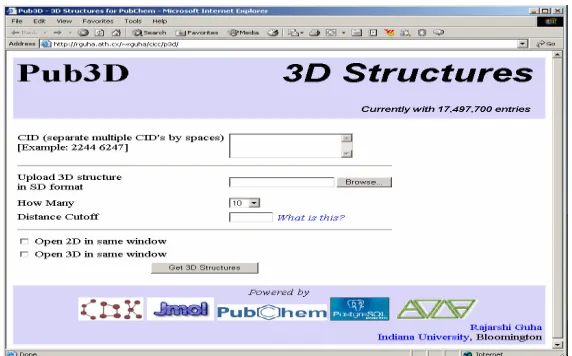
[image:3.612.200.423.176.454.2]Figure 2: A Screenshot of the Web Page Interface (front-end user interface) to Pub3D Database.
4.2. Web Service Client (front-end)
Web service clients can simultaneously access (or query) the data in several databases in a distributed environment. Query requests from clients are transmitted to the web service, disseminated through the message and service system to database servers via database agents which reside on multicore servers. The well known benefits of the three-tier architecture results in the web service clients do not need to know about the individual distributed database servers, but rather, send query requests to a single web service that handles query transfer and response. Figure 2 shows an example web service client (front-end user interface) for Pub3D [33] service developed by the ChemBioGrid (Chemical Informatics and Cyberinfrastructure Collaboratory) project [6] at Indiana University. The web service user interface allows one to either specify compound ID’s or upload a 3D structure as a query molecule. If the user uploads a 3D structure as a query molecule, we evaluate the shape descriptors (described in Section 5.2) for the query molecule via a chemoinformatics web service infrastructure [12]. We then construct the query described (in e.g. Figure 4) and return the list of molecules, whose distance to the query is less than the specified cutoff.
4.3. Message and service middleware system
For communication service between the web service and middleware, and the middleware and database agents which run on multicore servers in which distributed database servers are placed, we have used NaradaBrokering [19, 31, 37, 38] for message and service middleware system as overlay built over heterogeneous networks to support group communications among heterogeneous communities and collaborative applications. The NaradaBrokering from Community Grids Lab (CGL) [8] is adapted as a general event brokering middleware, which supports publish/subscribe messaging model with a dynamic collection of brokers and provides services for TCP, UDP, Multicast, SSL, and raw RTP clients. The NaradaBrokering also provides the capability of the communication through firewalls and proxies. It is an open source and can operate either in a client-server mode like JMS [23] or in a completely distributed peer-to-peer mode [40]. In this paper we use the terms “message and service middleware (or system)” and “broker” interchangeably.
4.4. Database Agent
4.5. Database Server
A number of data partitions split by data clustering program are distributed into PostgreSQL database servers. The partitioned data is assigned to a database which is associated with a thread generated by database agent that is running on multicore server for high performance service. According to the number of cores supported by multicore servers, multiple threads can be generated to maximize high performance service. Another benefit of database servers based on the three-tier architecture is that they do not concern about a large number of heterogeneous web service clients but need to only process queries and return results of the queries. We used the open source database management system PostgreSQL [32]. With such an approach using open management system, we can build a sustainable high functionality system taking advantage of the latest system technologies with appropriate interface between layers (agents and database host servers) in a modular fashion.
5. PUBCHEM
PubChem is a public repository of chemical information including connection tables, properties and biological assay results. The repository can be accessed in a variety of ways including property-based searches and substructure searches. However, one aspect of chemical structure that is not currently addressed by PubChem is the issue of 3D structures. Given a set of 3D structures one would then like to be able to search these structures for molecules whose 3D shape is similar to that of a query. To address the lack of 3D information in PubChem and to provide 3D shape searching capabilities we created the Pub3D database.
5.1. Pub3D Database
Creating a 3D structure version of the PubChem repository requires a number of components. First, one must have an algorithm to generate 3D structures from the 2D connection table. We developed an in-house tool to perform this conversion and have made the program freely available [39]. Second, one must have an efficient way to store the 3D coordinates and associated information. For this purpose, we employ a PostgreSQL database. Third, one must be able to perform 3D searches that retrieve molecules whose shape is similar to that of a query molecule. This is dependent on the nature of shape representation as well as the type of index employed to allow efficient queries. We employ a 12-D shape representation coupled with an R-tree [17] spatial index to allow efficient queries. The current version of Pub3D stores a single 3D structure for a given compound.
5.2. Storing 3D Structure
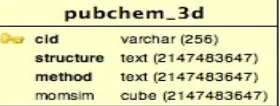
[image:5.612.242.382.501.554.2]Each 3D structure is stored in the SD file format [9], which lists the 3D coordinates as well as bonding information. We then store the 3D structure files in a PostgreSQL database as a text field. The schema for the 3D structure table is shown in Figure 3. We store the 3D structure file simply for retrieval purposes and do not perform any calculations on the contents of the file within the database. In addition to storing the 3D coordinates, we store the PubChem compound ID (cid), which is a unique numeric identifier provided by PubChem, which we use as a primary key. The remaining field (momsim) is a 12-D CUBE field. The CUBE data type provided by PostgreSQL is used to represent n-D hypercubes. We use this data type to store a reduced description of the shape of the molecule. More specifically, we employ the distance moment method [4] which characterizes the molecular shape by evaluating the first three statistical moments of the distribution of distances between atomic coordinates and four specified points, resulting in 12 descriptors characterizing a molecules shape. Thus, each molecule can be considered as a point in a 12-D shape space.
Figure 3: The schema for the table used to store the 3D structure information.
5.3. Searching the 3D Database
SELECT cid, structure FROM pubchem_3d WHERE cube_enlarge ( COORDS, R, 12 ) @> momsim
Here COORDS represents the 12-D shape descriptor of the query molecule, R is the user specified distance cutoff and cube_enlarge is a PostgreSQL function that generates the bounding hypercube from the query point as described above. The “@>” operator is a GiST [20] operator that indicates that the left operand contains the right operator. In other words, find all rows of the database for which the 12-D shape descriptor lies in the hypercubical region defined by cube_enlarge.
6. PERFORMANCE ANALYSIS
In Section 4 we showed the architecture of our distributed database system built on multicore systems. In this section we show experimental results to demonstrate the viability of our hardware/software architectural approach with a variety of performance measurements. First, we show the latency incurred from query/response interaction between a web service client and a centralized Pub3D database via a middleware and an agent. Then we show the viability of our architectural approach to support efficient query processing in time among distributed databases into which the Pub3D database is split, with horizontal partitioning method and data clustering method respectively. The horizontal partitioning method in our experiments was chosen due to such convenience factors as easy-to-split and easy-to-use. In our experiments we used the example query shown in Figure 4 as a function of the distance R from 0.3 to 0.7. The choice of the distance R between 0.3 and 0.7 was due to excessively small size of the result sets (0 hits for R=0.1 and 2 hits in R=0.2) for small values of R and the very large result sets, which exceeded the memory capacity (for the aggregation web service running on Windows XP platform with 2 GB RAM) caused by the large numbers of responses in the values bigger than 0.7. Table 1 shows the total number of hits for varying R, using the query of Figure 4. In Section 6.1 we show overhead timing considerations incurred from processing a query in our distributed database system. In Section 6.2 we show the performance results for query processing task in a centralized (not fragmented) database. In Section 6.3 we show the performance of a query/response interaction mechanism between a client and distributed databases. The query/response interaction mechanism is based on SQMD using publish/subscribe mechanism. A web service client’s single query request is disseminated to all the databases via a broker and agents. The same query is executed simultaneously by all the databases over multicore servers. An operation for serially aggregating responses from all the databases is performed in web service component of middleware. The aggregated result is transmitted to the request client.
Figure 4: An example query used in our experiment, varying R from 0.3 to 0.7, where the R means some distance cutoff to retrieve those points from the database whose distance to the query point, described in more detail in section 5.3.
Distance R 0.3 0.4 0.5 0.6 0.7
The number of hits 495 6,870 37,049 113,123 247,171
[image:6.612.59.553.537.577.2]Size in bytes 80,837 1,121,181 6,043,337 18,447,438 40,302,297 Table 1: The total number of response data occurred with varying the distance R in the query of Figure 4.
6.1. Overhead timing considerations
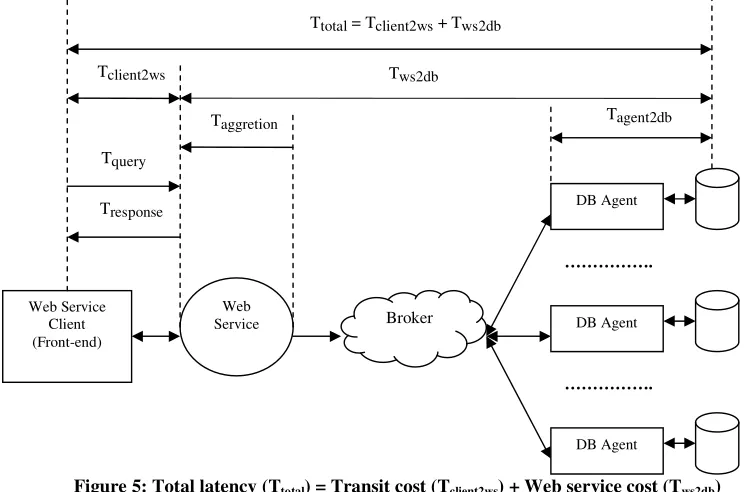
Figure 5 shows a breakdown of the latency for processing SQMD operation between a client and databases in our distributed database system which is a network of eight PostgreSQL database servers that reside on eight multicore servers respectively. The cost in time to access data from the databases distributed over multicore servers has four primary overheads. The total latency is the sum of transit cost and web service cost.
Figure 5: Total latency (Ttotal) = Transit cost (Tclient2ws) + Web service cost (Tws2db)
• Transit cost (Tclient2ws) – The time to transmit a query (Tquery) to and receive a response (Tresponse) from the web service
running on web server.
• Web service cost (Tws2db) – The time between transmitting a query from a web service component to all the databases
through a broker and agents and retrieving the query responses from all the databases including the corresponding execution times of the middleware and agents.
• Aggregation (Taggregation) cost – The time spent in the web service for serially aggregating responses from databases.
• Database agent service cost (Tagent2db) – The time between submitting a query from an agent to and retrieving the responses
of the query from a database server including the corresponding execution time of the agent.
6.2. Performance for query processing task in a centralized (not fragmented) database
In this section we show the performance results of latency incurred from processing a query between a web service client and a centralized (not fragmented) database. Note that the results are not to show better performance enhancement but to quantify the performance for a variety of latencies induced with the centralized database. The quantified results will be used as a reference of the experimental results of the performance measurements used in the following section. In our experiments, we measured the round trip time in latency involved in performing queries (accessing data) between a web service client and database host servers via middleware (web service and broker) and database agents. The experiment results were measured from executing a web service client running on Windows XP platform with 3.40 GHz Intel Pentium and 1 GB RAM connected to Ethernet network, and executing a web service and a broker running on Windows XP platform with 3.40 GHz Intel Pentium and 2 GB RAM connected to Ethernet network. Agents and PostgreSQL database servers ran on each of eight 2.33 GHz Linux with 8 core / 8 GB RAM connected to Ethernet network as well. The client, middleware, agents, and database servers are located in Community Grids Lab at Indiana University.
Figure 6 show the mean completion time to transmit a query and to receive a response between a web service client and a database host server including the corresponding execution time of the middleware (web service and broker) and agents, varying the distance R described in section 5.3. As the distance R increases, the size of result set also increases, as shown in Table 1. Therefore as the distance R increases, the time needed to perform a query in the database increases as well, which is shown in the figure and thus the query processing cost clearly becomes the biggest portion of the total cost. We can reduce the total cost by making the primary performance degrading factor (query processing cost (Tagent2db)) faster. To make the primary
degrading factor (or frequent case in today’s data deluge) faster, the result which motivated our research work will be used as a baseline for the speedup measurement of the experiments performed in the following section.
Tresponse
Taggretion
Tclient2ws Tws2db
Tagent2db
Broker
Web Service
DB Agent
DB Agent
DB Agent
Ttotal = Tclient2ws + Tws2db
……….
……….
Web Service Client (Front-end)
Mean query response time in a centralized (not fragmented) database
0 5000 10000 15000 20000 25000 30000
0.3 0.4 0.5 0.6 0.7
Distance R
M
e
a
n
t
im
e
i
n
m
ill
is
e
c
o
n
d
s Network cost
[image:8.612.182.429.63.228.2]Aggregation cost Query processing cost
Figure 6: Mean query response time between a web service client and a centralized database host server including the corresponding execution time of the middleware (web service and broker) and agents, varying the distance R.
6.3. Performance for query processing task in distributed databases (Data clustering vs. Horizontal partitioning vs. Data clustering + Horizontal partitioning) over multicore servers
The Pub3D database is split into eight separate partitions (or clusters) by horizontal partitioning method and data clustering method developed by SALSA project at CGL. Each of partitions of the database is distributed across eight multicore physical machines. Table 2 shows the partitioned data size in number by the data clustering method. Note that the data partitioned by horizontal partitioning method have almost the same size in number.
Segment number
Dataset size in number
Segment number
Dataset size in number
1 6,204,776 5 2,302,272
2 616,133 6 4,634,860
3 507,209 7 785,232
[image:8.612.176.433.366.434.2]4 2,018,281 8 163,017
Table 2: The data size (in number) in the fragmentations into which the Pub3D database is split by clustering method. (Note that each database in the fragmentations by horizontal partitioning method has about 2,154,000 dataset in number).
S R
1 2 3 4 5 6 7 8
0.3 1 0 0 0 494 0 0 0
0.4 87 0 30 0 6,753 0 0 0
0.5 1,868 0 570 0 34,611 0 0 0
0.6 12,926 0 2,720 0 97,477 0 0 0
D
0.7 44,388 0 6,571 0 196,212 0 0 0
0.3 75 82 77 62 45 27 49 78
0.4 863 1,133 978 893 667 498 780 1,058
0.5 4,667 5,686 5,279 4,746 3,615 3,031 4,361 5,664
0.6 14,089 16,749 15,782 14,650 11,369 9,756 13,559 17,169
H
0.7 30,920 35,558 33,862 32,277 25,207 22,268 29,620 37,459
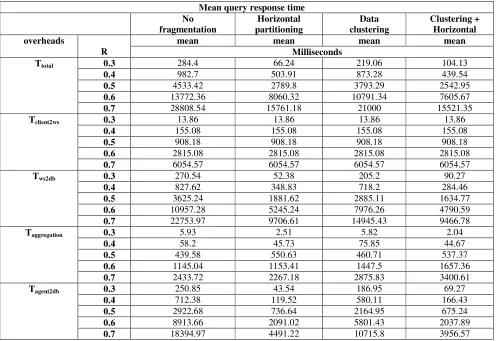
[image:8.612.59.553.501.634.2]Examining overhead costs and total cost, we measured the mean overhead cost for 100 query requests in our distributed database system built on multicore based systems. For measuring the overhead costs, we tested three different cases with two different partitioning methods: data clustering vs. horizontal partitioning vs. data clustering and horizontal partitioning, varying the distance R in the example query which is shown in Figure 4. The results are summarized in Table 4 with the mean completion time of a query request in the considerations of overhead timings between a client and databases.
Mean query response time No
fragmentation
Horizontal partitioning
Data clustering
Clustering + Horizontal
mean mean mean mean
overheads
R Milliseconds
0.3 284.4 66.24 219.06 104.13
0.4 982.7 503.91 873.28 439.54
0.5 4533.42 2789.8 3793.29 2542.95
0.6 13772.36 8060.32 10791.34 7605.67
Ttotal
0.7 28808.54 15761.18 21000 15521.35
0.3 13.86 13.86 13.86 13.86
0.4 155.08 155.08 155.08 155.08
0.5 908.18 908.18 908.18 908.18
0.6 2815.08 2815.08 2815.08 2815.08
Tclient2ws
0.7 6054.57 6054.57 6054.57 6054.57
0.3 270.54 52.38 205.2 90.27
0.4 827.62 348.83 718.2 284.46
0.5 3625.24 1881.62 2885.11 1634.77
0.6 10957.28 5245.24 7976.26 4790.59
Tws2db
0.7 22753.97 9706.61 14945.43 9466.78
0.3 5.93 2.51 5.82 2.04
0.4 58.2 45.73 75.85 44.67
0.5 439.58 550.63 460.71 537.37
0.6 1145.04 1153.41 1447.5 1657.36
Taggregation
0.7 2433.72 2267.18 2875.83 3400.61
0.3 250.85 43.54 186.95 69.27
0.4 712.38 119.52 580.11 166.43
0.5 2922.68 736.64 2164.95 675.24
0.6 8913.66 2091.02 5801.43 2037.89
Tagent2db
[image:9.612.59.555.125.466.2]0.7 18394.97 4491.22 10715.8 3956.57
Table 4: Mean query response time between a web service client and a centralized database host server (or distributed database servers) including the corresponding execution times of the middleware (web service and broker) and agents, varying the distance R.
By comparing the total costs for the three different cases with the total cost incurred from a centralized database system, we computed the speedup (similar to Amdahl’s Law) gained by the distribution of data with the use of multicore devices in our distributed database system:
Speedup = Ttotal (1db) / Ttotal (8db) = (Tclient2ws (1db) + Tws2db (1db)) / (Tclient2ws (8db) + Tws2db (8db)) --- (1)
= 1 / ((1 – (Tagent2db (1db) / Ttotal (1db))) + ((Tagent2db (1db) / Ttotal (1db)) / (Tagent2db (1db) / Tagent2db (8db)))) --- (2)
Where (1db) means a centralized database and (8db) means a distributed database.
messages arriving into web service component in middleware for global aggregation of responses. As expected, there was a difference between the durations. The difference is due to network overhead between web service component and agents, and the global aggregation operation overhead in web service that degrades the performance of the system since the web service has to wait, blocking the return of the response to a query request client until all database servers send the response messages. From the results with the example query in our distributed database system, using horizontal partitioning is faster than using data clustering since fragments partitioned by the data clustering method can be different in the size of data as shown in Table 2. Then obviously as the responses occurred in performing a query in a large size of cluster increase, the time needed to perform the query in the cluster increases as well, which is shown in the graph in Figure 8. But the responses hit by a query may not be occurred from all the distributed databases (fragments), then the data clustering method will benefit more, increasing data locality while resulting in high latency. Therefore there may be unnecessary query processing with some databases distributed by the data clustering method, using the SQMD mechanism as shown in Table 3. To eliminate the unnecessary query processing, we should consider the query optimization that allows a query to localize into some specific databases in future work – SQSD (Single Query Specific Databases) mechanism which is similar in concept to SISD (Single Instruction stream, Single Data stream) [42]. We thus identified the problems, data locality and latency, from our experimental results. To reduce the latency with increasing data locality in using the data clustering method, we combined the data clustering method with the horizontal partitioning method to maximize the use of multicore with independent threads of execution by concurrently running multiple databases, one on each thread associated with each core in a multicore server. Figure 9, 10 and 11 show the experimental results with data clustering, horizontal partitioning, and the combination of both methods respectively. Our experimental results show there is a data locality vs. latency tradeoff. Compare the query processing time in Figure 9 with that in Figure 10, with Table 3. Also while the figures show that the query processing cost increases as the distance R increases, the cost becomes a smaller portion of overall cost than the transit cost in the distribution of data over multicore servers, with increasing data locality and decreasing query processing cost as shown in Figure 11. This result shows our distributed database system is scalable with the partitioning of database over multicore servers by data clustering method for increasing data locality, and with multithreads of executions associated with multiple databases split by horizontal partitioning in each cluster for decreasing query processing cost, and thus the system improves overall performance as well as query processing performance.
Speedup
0 0.5 1 1.5 2 2.5 3 3.5 4 4.5 5
0.3 0.4 0.5 0.6 0.7
Distance R
S
p
e
e
d
u
p
Data clustering + Horizontal partitioning Horizontal partitioning
[image:10.612.177.457.362.543.2]Data clustering
Mean query processing time in each cluster (Tagent2db)
(R = 0.5)
0 500 1000 1500 2000 2500
1 2 3 4 5 6 7 8
Cluster number M e a n t im e i n m ill is e c o n d
s Data clusteringHorizontal partitioning
Data clustering + Horizontal partitioning
Figure 8: Mean query processing time in each cluster (Tagent2db), in the case of the distance R=0.5.
Mean query response time in databases distributed by data clustering
0 5000 10000 15000 20000 25000
0.3 0.4 0.5 0.6 0.7
Distance R M e a n t im e i n m ill is e c o n d
s Network costAggregation cost Query processing cost
Figure 9: Mean query response time between a web service client and databases distributed by data clustering including the corresponding execution times of the middleware (web service and broker) and agents, varying the distance R.
Mean query response time in databases distributed by horizontal
partitioning 0 2000 4000 6000 8000 10000 12000 14000
0.3 0.4 0.5 0.6 0.7
Distance R M e a n t im e i n m ill is e c o n d
s Network costAggregation cost
Query processing cost
Figure 10: Mean query response time between a web service client and databases distributed by horizontal partitioning including the corresponding execution times of the middleware (web service and broker) and agents, varying the distance R.
Mean query response time in databases distributed by data clustering
and horizontal partitioning
0 2000 4000 6000 8000 10000 12000 14000 16000
0.3 0.4 0.5 0.6 0.7
Distance R M e a n t im e i n m ill is e c o n d
s Network costAggregation cost
[image:11.612.329.542.58.225.2]Query processing cost
Figure 11: Mean query response time between a web service client and databases distributed by data clustering and horizontal partitioning including the corresponding execution times of the middleware (web service and broker) and agents, varying the distance R.
7. SUMMARY AND FUTURE WORK
[image:11.612.69.293.59.226.2] [image:11.612.81.527.313.487.2]responses from distributed database servers since the web service performs poorly when the workload for aggregating the results of a query in the web service increases, and since the web service has to wait until all database servers send the response messages as well. In future work we will consider the use of Axis2 web service [3] to provide asynchronous invocation web service and also redesign our current distributed database system with MapReduce [25] style data processing interaction mechanism by moving the computationally bound aggregating operation to a broker since the number of network transactions between web service and broker, and the workload for the aggregating operation are able to decrease. CGL has been developing such a data processing interaction mechanism capable of integrating into Naradabrokering. In future work, we will show that the architectural design with the Map-Reduce style data processing interaction mechanism is more scalable, and the scalable distributed database system performs better for query processing as well. The second problem was found in extra hits that our current approach generates. We will investigate the use of the M-tree index [7] which has been shown to be more efficient for near neighbor queries in high-dimensional spaces such as the ones being considered in this work. Furthermore, M-tree indexes allow one to perform queries using hyperspherical regions. This would allow us to avoid the extra hits we currently obtain due to the hypercube representation. The third problem was found in unnecessary query processing with some databases distributed by the data clustering method, using the SQMD mechanism. To eliminate the unnecessary query processing, we should consider the query optimization that allows a query to localize into some specific databases in future work – SQSD (Single Query Specific Databases) mechanism which is similar in concept to SISD (Single Instruction stream, Single Data stream) [42].
In future work we will extend the Pub3D database to the multi-conformer version. Inclusion of multiple conformers will increase the row count by at least an order of magnitude. We expect that our hardware/software architectural design will scale well to such row counts. Also we will investigate alternative shape searching mechanisms. The current approach is purely geometrical and does not include information regarding chemical groups. We will investigate the use of extra property information as a pre-filter. In addition we will investigate the possibility of performing pharmacophore [27] searches on the 3D structure database. Currently, such searches require a linear scan over the database and we will investigate ways in which pre-calculated pharmacophore fingerprints can be used to speed this process. Finally, we will investigate a number of applications. Given the ability to perform very efficient near neighbor queries, we will investigate the “density of space” around various query points. This method has been described by Guha et al [16], and allows one to characterize the spatial location of a molecule in arbitrary chemical spaces. In the context of the 3D structure database, we will be able to investigate how well certain molecular shapes are represented within PubChem. The indexing technology employed in this work can also be used for other multi-dimensional chemical spaces, allowing us to investigate the structure of arbitrary chemical spaces for very large collections of molecules.
REFERENCES
[1] Ahmet Uyar, Wenjun Wu, Hasan Bulut, Geoffrey Fox Service-Oriented Architecture for Building a Scalable Videoconferencing System March 25 2006 to appear in book "Service-Oriented Architecture - Concepts & Cases" published by Institute of Chartered Financial Analysts of India (ICFAI) University.
[2] Apache Axis, http://ws.apache.org/axis
[3] Apache Axis2, http://ws.apache.org/axis2/
[4] Ballester, P.J., Graham-Richards, W., J. Comp. Chem., 2007, 28, 1711-1723.
[5] Chaitanya K. Baru, Gilles Fecteau, Ambuj Goyal, Hui-I Hsiao, Anant Jhingran, Sriram Padmanabhan, George P. Copeland, Walter G. Wilson: DB2 Parallel Edition. IBM System Journal, Volume 34, pp 292-322, 1995.
[6] Chembiogrid (Chemical Informatics and Cyberinfrastructure Collaboratory),
http://www.chembiogrid.org/wiki/index.php/Main_Page
[7] Ciaccia, P., Patella, M., Zezula, P., Proc. 23rd Intl. Conf. VLDB, 1997. [8] Community Grids Lab (CGL), http://communitygrids.iu.edu
[9] Dalby, A., Nourse, J., Hounshell, W., Gushurst, A., Grier, D., Leland, B., Laufer, J., J. Chem. Inf. Comput. Sci., 1992, 32, 244-255.
[10] Data Clustering, http://en.wikipedia.org/wiki/Data_clustering
[11] Domenico Sacca and Gio Wiederhold. Database Partitioning in a Cluster of Processors. ACM Transaction on Database System, Vol. 10, No. 1, March 1985, Pages 29-56.
[12] Dong, X., Gilbert, K., Guha, R., Heiland, R., Pierce, M., Fox, G., Wild, D.J., J. Chem. Inf. Model., 2007, 47, 1303-1307. [13] Extensible Markup Language (XML) 1.0, W3C REC-xml, October 2000.
[14] F. Berman, G. Fox, and A. Hey, editors. Grid Computing: Making the Global Infrastructure a Reality, John Wiley & Sons, 2003.
Las Vegas May 14-17 2006; IEEE Computer Society, Ed: Smari, Waleed & McQuay, William, pp 419-428. ISBN 0-9785699-0-3 DOI.
[16] Guha, R., Dutta, D., Jurs, P.C., Chen, T., J. Chem. Inf. Model., 2006, 46, 1713-1722.
[17] Guttman, A., ACM SIGMOD, 1984, 47-57.
[18] Harshawardhan Gadgil, Geoffrey Fox, Shrideep Pallickara and Marlon Pierce. Managing Grid Messaging Middleware Proceedings of IEEE Conference on the Challenges of Large Applications in Distributed Environments (CLADE) Paris France June 19 2006, pp. 83 – 91.
[19] Hasan Bulut, Shrideep Pallickara and Geoffrey Fox. Implementing a NTP-Based Time Service within a Distributed Brokering System. ACM International Conference on the Principles and Practice of Programming in Java, June 16-18, Las Vegas, NV.
[20] Hellerstein, J.M., Naughton, J.F., Pfeffer, A., Proc 21st Intl. Conf. VLDB, 1995, 562-573. [21] Hermann Baer. Partitioning in Oracle Database 11g. An Oracle White Paper June 2007.
[22] I. Foster, C. Kesselman, and S. Tuecke. The Anatomy of the Grid: Enabling Scalable Virtual Organizations. International Journal of High Performance Computing Applications, 2001. 15(3): p. 200-222.
[23] Java Message Service (JMS), http://java.sun.com/products/jms
[24] JDBC (Java Database Connectivity), http://java.sun.com/javase/technologies/database/
[25] Jeffrey Dean and Sanjay Ghemawat. MapReduce: Simplified Data Processing on Large Clusters. OSDI'04: Sixth Symposium on Operating System Design and Implementation, San Francisco, CA, December, 2004.
[26] John L. Hennessy and David A. Patterson. Computer Architecture: A Quantitative Approach 2nd Edition. Morgan Kaufmann.
[27] Martin, Y.C., J. Med. Chem., 1992, 35, 2145-2154.
[28] Message Passing Interface Forum, University of Tennessee, Knoxville, TN. MPI: A Message Passing Interface Standard, June 1995. http://www.mcs.anl.gov/mpi
[29] Multicore CPU (or chip-level multiprocessor), http://en.wikipedia.org/wiki/Multi-core_(computing)
[30] M. Weiser. “The Computer for the Twenty-First Century,” Scientific American, September 1991. [31] NaradaBrokering, http://www.naradabrokering.org
[32] PostgreSQL, http://www.postgresql.org/
[33] Pub3d – Web Service Infrastructure, http://www.chembiogrid.org/wiki/index.php/Web_Service_Infrastructure
[34] R, B’Far. Mobile Computing Principles: Designing and Developing Mobile Applications with UML and XML, Cambridge University Press 2005.
[35] SALSA (Service Aggregated Linked Sequential Activities), http://www.infomall.org/salsa
[36] Simple Object Access Protocol (SOAP), http://www.w3.org/TR/soap12-part1/
[37] Shrideep Pallickara and Geoffrey Fox. NaradaBrokering: A Middleware Framework and Architecture for Enabling Durable Peer-to-Peer Grids. Proceedings of the ACM/IFIP/USENIX Middleware Conference. 2003. pp 41-61.
[38] Shrideep Pallickara, Harshawardhan Gadgil and Geoffrey Fox. On the Discovery of Topics in Distributed Publish/Subscribe systems Proceedings of the IEEE/ACM GRID 2005 Workshop, pp 25-32. November 13-14 2005 Seattle, WA.
[39] Smi23d – 3D Coordinate Generation. http://www.chembiogrid.org/cheminfo/smi23d/
[40] Sun Microsystems JXTA Peer to Peer Technology, http://www.jxta.org
[41] Tony Hey and Anne Trefethen, The data deluge: an e-Science perspective in “Grid Computing: Making the Global Infrastructure a Reality” edited by Fran Berman, Geoffrey Fox and Tony Hey, John Wiley & Sons, Chicester, England, ISBN 0-470-85319-0, February 2003.
[42] Vipin Kumar, Ananth Grama, Anshul Gupta, and George Karypis. Instruction to Parallel Computing: Design and Analysis of Algorithms.
[43] Web Service Architecture, http://www.w3.org/TR/ws-arch/
[44] WSDL (Web Service Description Language), http://www.w3.org/TR/wsdl