promoting access to White Rose research papers
Universities of Leeds, Sheffield and York
http://eprints.whiterose.ac.uk/
This is an author produced version of a paper published in Journal of Nuclear Materials.
White Rose Research Online URL for this paper: http://eprints.whiterose.ac.uk/4059/
Published paper
Spasova, L.M. and Ojovan, M.I. (2008) Characterisation of Al corrosion and its impact on the mechanical performance of composite cement wasteforms by
the acoustic emission technique,Journal of Nuclear Materials, Volume 375 (3),
Characterisation of Al corrosion and its impact on the mechanical
performance of composite cement wasteforms by the acoustic emission
technique
L.M. Spasova*, M.I. Ojovan
Immobilisation Science Laboratory, Department of Engineering Materials, University of Sheffield
Mappin Street, Sheffield, S1 3JD, UK
Abstract. In this study acoustic emission (AE) non-destructive method was used to
evaluate the mechanical performance of cementitious wasteforms with encapsulated Al
waste. AE waves generated as a result of Al corrosion in small-size blast furnace
slag/ordinary Portland cement wasteforms were recorded and analysed. The basic
principles of the conventional parameter-based AE approach and signal-based analysis
were combined to establish a relationship between recorded AE signals and different
interactions between the Al and the encapsulating cement matrix. The AE technique was
shown as a potential and valuable tool for a new area of application related to monitoring
and inspection of the mechanical stability of cementitious wasteforms with encapsulated
metallic wastes such as Al.
Keywords: Non-destructive evaluation, cementitious wasteforms, corrosion of Al, acoustic
emission
*
Corresponding author. Tel.: + 44 (0) 114 222 5973: fax. + 44 (0) 114 222 5943.
1. Introduction
All processes involved in the nuclear energy production are associated with
generation of gaseous, liquid and solid wastes with various concentrations of radioactive
elements [1]. In the UK these are classified according to their nature and level of
radioactivity into Very Low Level Waste (VLLW), Low Level Waste (LLW), Intermediate
Level Waste (ILW) and High Level Waste (HLW) [1,2]. VLLW has a negligible
radiological hazard and is safety disposed of at landfill sites. The liquid and solid LLW and
ILW arise mainly from the operation and decommissioning of power stations and spent
nuclear fuel (SNF) reprocessing. Most of the low and intermediate level wastes (LILW)
have been immobilised in cements and sent to the UK storage facilities near Drigg in
Cumbria. The mechanical stability along with radiation and chemical durability of the
produced wasteforms are the most important properties required for their safe storage,
transportation and disposal. According to the latest UK Radioactive Waste Inventory report
31557 cementitious packages immobilising solid and liquid ILW were produced up to 1 of
April 2004 and the forecast for encapsulation of future araisings determines a number of
177000 cement-based wasteforms to be produced [2]. The dominant ILW encapsulated in
cements are ion exchange resins, sludges from treated radioactive liquid effluents and
metallic debris such as SNF claddings and reactor components [3]. These wastes have been
progressively encapsulated in composite cements [3,4] sealed in 500-litre stainless steel
drums or for large items within high capacity concrete or steel containers [5]. Over a
number of years baseline data were accumulated for various waste streams immobilised in
(PFA)/OPC composite cements. The physical and chemical properties of the cementitious
wasteforms such as setting time, temperature elevation during early stage of hydration,
permeability, chemical durability, tensile strength and dimensional stability have been
studied [3]. However, the mechanical behaviour of the cementitious wasteforms during
long periods of time (tens and hundreds of years) is difficult to be predicted and can be
substantially affected by gas generation and corrosion of wasteforms constituents [3]. An
important issue is the degradation of the cementitious wasteforms caused by corrosion of
encapsulated metals such as Al, Mg and their alloy, termed Magnox, in the high pH cement
environment (∼12.5 for OPC) associated with hydrogen gas generation and deposition of an
expansive layer of corrosion products [6,7]. This is a major concern for the safe storage of
more than 23000 cementitious packages with encapsulated Magnox and Al which have
been or will be produced only by Sellafield encapsulation plants in the UK [2]. These
packages are in interim storage for minimum of 50 years before final disposal. Therefore
non-destructive methods for continuous monitoring and inspection of the mechanical
performance of the cementitious wasteforms such as acoustic emission (AE) testing would
be of significant benefit for assessment of their mechanical stability and final acceptability
for handling, transport and disposal at the end of the interim storage.
2. AE technique applied for structures immobilising nuclear wastes
AE is a natural occurring phenomenon associated with sudden release of elastic
dislocation movement, phase transformation or other irreversible mechanical changes
within different materials [8]. The largest scale AE sources are the seismic events whereas
processes that still generate detectible AE are microscopic defect movements of the order
of a few picometers in a stressed structure [9]. The collection and processing of AE waves
was developed and established as a non-destructive testing and evaluation (NDT&E)
method particularly shown as a powerful tool for characterisation of failure mechanisms
and damage assessment in various materials and structures [9,10].
The AE technique offers several advantages which make it a potentially suitable
tool for non-destructive testing and inspection of nuclear waste packages. These are related
to the high sensitivity of the method to micro and macromechanical events within the
structures providing an early indication for the damage development in-situ, the possibility
to be used as a passive testing method without additional stimuli to be applied and, in
theory, unlimited duration of monitoring. Moreover, the AE practice has shown that testing
can be conducted on structures with different composition, shape and volume and
successfully used for localisation of zones of damage [9-11]. The AE technique also uses
relatively simple but effective means of monitoring the time progress development of
different failure mechanisms. It employs approaches to differentiate them by AE data
analysis which can almost instantly alarm for un-controlled deterioration or human
intrusion. Nevertheless, the application of the AE technique is associated with a number of
issues. These are related to the diversified AE signal characteristics determined by the type
of defects, deterioration mechanisms, local stress distribution, mechanical properties and
geometry of the structures under monitoring, background noise, experimental conditions,
properties of the sensors employed [9-11]. These factors determine the complexity of the
experimental setup and the repeatability of the results obtained. Therefore a strict
correlation between dimensional indications obtained by the detected AE waves and the
nature of the failure process can be determined based on relatively complicate data
interpretation methods including advanced signal processing, e.g., wavelet and moment
tensor analysis [11-13]. However, the information gained from defects growth, onset of
new microfracture patterns and their dynamics, especially in cement-based structures,
supply useful elements for a diagnosis of the degradation phenomena in progress [14-20].
Apart from our previous work [21-23] there are few studies on AE as a NDT&E
technique applied for nuclear wasteforms. Belov and Aloy [24] reported that AE signals
can be detected, distinguished from the background noise and associated with defects
formation during fabrication of glass and ceramic samples used for immobilisation of
nuclear wastes. Even though different AE methods have been extensively developed and
optimised for damage characterisation in cement-based structures for civil engineering
applications at the authors’ knowledge the AE technique has not been applied to monitor
the mechanical stability of cementitious wasteforms; thus this a new area with a potential
for future development. We recently reported the results obtained from the AE monitoring
of a pure OPC structure with encapsulated Al used as a reference for further study on
samples resembling real cementitious wasteforms with encapsulated Al [21-23]. Different
methods for analysis of the collected AE data were applied in order to characterise the
potential sources of AE within the cementitious system. It was shown in [21-23] that the
AE signals recorded from the reference OPC structure with encapsulated Al can be
damage development within the structure with the time progress of the Al corrosion
process. The aim of this study was to extend the work, briefly reported in [21-23], on
composite cement formulation used for production of real wasteforms for encapsulation of
metallic radioactive wastes [1,3,4]. Herein the evaluation of the damage induced within the
structures was performed using AE parameter and signal-based analysis.
3. Experimental procedure
3.1. Specimens
AE monitoring was conducted on composite cement samples with 70 wt% BFS
replacement of OPC (BFS/OPC to mass ratio 7:3) used as a lower limit in the composition
envelope for nuclear waste encapsulation applied by British Nuclear Group (BNG). The
metal encapsulated was high purity (99.999%) Al. The OPC and BFS were supplied
respectively by Castle Cement and Redcar Steel Works.
For the preparation of the laboratory scale units the OPC and BFS powders with
water, in mass ratio 0.33, were mixed and then poured in 340 mL capacity plastic
containers. Before to close the container with airtight lid Al rod with a length between 35
and 50 mm and a diameter of 10 mm was centrally placed into the cement grout.
Cylindrical cementitious samples were formed and cured at 20 ºC and 95% relative
humidity (RH) in an environmental chamber for different period of time – from 3 days to
more than 3 years. For the purpose of this study the corrosion of Al in cementitious
water in the plastic containers. The latter was done in order to simulate one of the possible
scenario during the interim storage of the packaged wasteforms when water can penetrate
and interact with the encapsulating cementitious matrix and waste [1]. In this paper the
results from the AE monitoring of a BFS/OPC sample cured for more than 6 months are
presented and discussed.
3.2. AE data acquisition
The AE experimental setup, shown in Fig. 1, and layout for data acquisition were as
described in [21-23]. A piezoelectric AE transducer (or sensor) with a diameter of 17 mm
was attached to the bottom of the container with the cement-based sample via a thin layer
of grease used as acoustic couplant. Although the quality of the sensor coupling affects the
reproducibility of the characteristics of the detected AE waves all experiments on the
cementitious samples were conducted by the same operator following the same procedure
minimizing random effects. A wideband transducer, type WD, calibrated and supplied by
Physical Acoustics Corporation (PAC) has been chosen due to its high sensitivity in a
broad range of frequencies between 100 and 1000 kHz. The electrical signals (voltage)
generated by the AE transducer were amplified by 40 dB and passed through a bandpass
filter between 20 kHz and 3 MHz. Then each of the analog signals was measured, and if
above the threshold level of 40 dB [25], was sampled and quantized by 18 bits
analog-to-digital converter (ADC) with 5 MSPS sampling rate.
A hit driven data acquisition process with PCI-2 based AE system, supplied and
to the sample, the generated electrical signal amplified by a preamplifier type 2/4/6 from
PAC and its amplitude exceeded the threshold level data streaming was allowed. The data
recorded on a PC hard drive in an ASCII file for each AE signal (or hit) consisted of a set
of parameters such as duration, amplitude, counts, rise time and absolute (ABS) energy,
defined in [21], and subsequently used for post-test analysis.
The waveform of each filtered and recorded AE signal was discretised in 3072
points stored in the PC memory. The pre-trigger time (in μs) used to record the signal
waveform before the first threshold level crossing was set at 100 µs. Selective cross-plots
such as hits amplitude versus duration and histograms plotted by PAC AEwin software
package provided real-time information for the AE from the sample under monitoring.
4. Results and Analysis
4.1. Relationship between the time domain parameters of the recorded AE hits from the
BFS/OPC sample with encapsulated Al and their potential sources due to the Al corrosion
development
Signal parameter-based analysis is a conventional approach for AE sources
characterisation and overall assessment of the mechanical performance of materials and
structures [9,12]. It is suitable for less time and storage consuming data acquisition
applications, e.g., monitoring and inspection of large concrete bridges, pressure vessels and
oil tanks. However, the AE hits rate and parameters such as counts, amplitude and duration
acoustic signature of cement-based structures in laboratory experiments under various
conditions [14-20].
In the present study during the conducted AE monitoring on the cementitious
sample with encapsulated Al the cumulative number of AE hits and associated ABS energy
provided initial, real-time information for micromechanical events within the structure
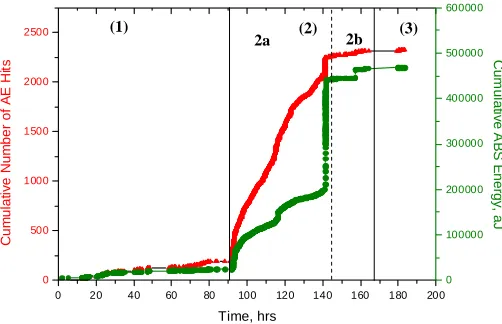
associated with the generation and release of acoustic waves. As it can be seen in Fig. 2
there were several stages in the AE history of the experiment with a discriminative rate
(high or low) also reported from the AE monitoring of the reference OPC structure with
encapsulated Al [21].
The first relatively long period of time (92 hours) from the commencement of the
experiment was associated with a very low AE activity consisting of 193 signals or 8.29%
of the total number of the detected AE hits (Table 1). The sources of this AE can be related
with the process of water infiltration through the porous zone in the Al corrosion products
layer and re-initiation of the metal corrosion leading to a stable growth of the pre-existing
microcracks formed due to the hydrogen gas generation and release during the cement
setting and curing [6,7].
After the first stage a new period characterised by an abrupt increase in the number
of the recorded AE hits and their ABS energy was observed likely to indicate for localised
microcracking and formation of critical size crack(s) within the structure [14-18, 21]. This
period with a duration of around 50 hours (Fig. 2) has been followed by a time interval
when the hits rate considerably decreased in comparison with the previous period denoted
as 2a in Fig. 2. Similar results were reported to correspond to propagation of critical size
in concrete or hydrogen gas release due to Al corrosion associated with high energy AE
signals ultimately leading to decrease of the overall stress level within the structures
[14-18,26]. Then a period of AE “silence” (denoted in Fig. 2 as a stage 3) followed in the AE
history of the conducted experiment. This was also observed during the AE monitoring of
the reference OPC sample with encapsulated Al [21].
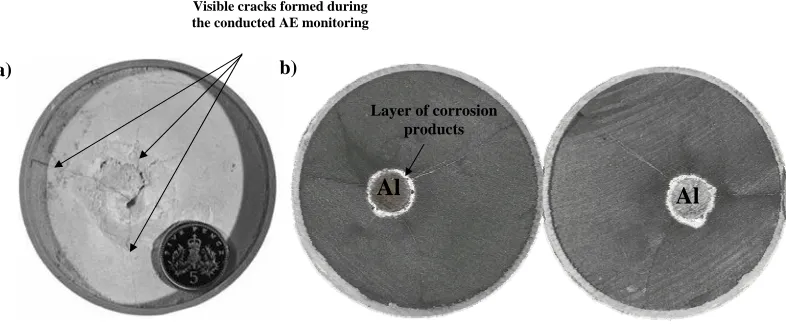
A visual observation during the experiment confirmed that visible cracks appeared
on the surface of the sample as shown in Fig. 3a. The latter were found also in the
cross-section of the structure (Fig. 3b) not expected to be formed within the BFS/OPC system at
that age of curing [7]. The initiation and/or propagation of these cracks were the very first
potential source of AE identified during our test.
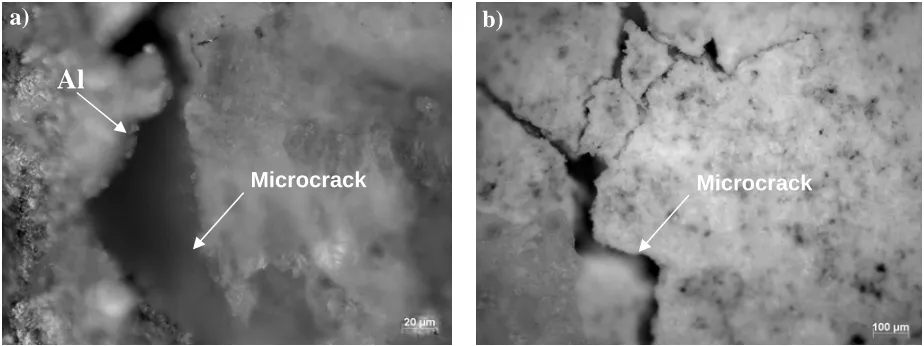
A post-test optical microscopy observation on the specimen provided additional
evidences for formation of splitting microcracks between the Al rod and the corrosion
products layer (Fig. 4a). These were formed as a result of the increased compressive forces
due to the hydrogen gas generation, friction and release [6,7,26]. Moreover, the presence of
microcracks within the corrosion products layer, as shown in Fig. 4b, was another proof for
active micro scale AE sources within the cementitious structure.
In order to differentiate the AE hits recorded from the cement-based structure the
analysis was extended from the AE hits rate providing information for some kind of
structural changes to the parameters of the recorded signals. According to Pollock [9] some
of the most commonly used acoustic parameters for characterisation of the AE sources are
amplitude, duration, counts and rise time. For the purpose of this study we applied a
procedure developed by Wu et al. [20], also described in details in [21], to classify detected
duration and counts and associate their appearing with the mechanisms causing damage
within the encapsulating composite cement system. The results obtained are summarised in
Table 1. Similar parameter-based AE study and differentiation of the recorded acoustic hits
extended with calculation of the average ABS energy (EABS,av) as a ratio between the total
number of AE hits (Nhits) and total ABS energy (EABS) for the OPC sample with
encapsulated Al are reported in [21].
From the data included in Table 1 can be seen that the AE during stage 1 from Fig.
2 consists of classified AE signals with a short duration (up to 50 μs) and a low amplitude
(up to 42 dB) in a good agreement with the data reported for the OPC sample with
encapsulated Al for the initial stage of the conducted monitoring [21]. This type of AE can
be associated with distributed microcracking within the Al corrosion products layer as
shown in Fig. 4b [17-19]. The group of acoustic signals with similar amplitude and
duration detected in a most large population at the beginning of the second stage (period 2a
from Fig. 2) can be attributed to localised microcracking within the layer of corrosion
products and the onset and/or activation of damage mechanisms such as debonding along
the Al rod due to the increase of the compressive forces on the Al/corrosion products layer
and corrosion products layer/cement interfaces as a result of hydrogen gas generation and
further deposition of corrosion products [8,15-17]. The most energetic hits, however, also
recorded in a large number during the period 2a and also 2b from Fig. 2 (Table 1) can be
associated with the extension of the splitting cracks between the Al rod and the corrosion
products layer (Fig. 4a) and the radial crack(s) initiation and/or extension within the cement
structure (Fig. 3) caused by the evolution of the hydrogen gas generated due to the Al
during period 3 from Fig. 2. It is important to note that during each of the stages of the
experiment there were AE signals that cannot be classified using the criteria of the
procedure from [20]. Moreover, these are characterised with a higher amplitude, a longer
duration and EABS,av in comparison with the classified dominant populations of AE signals
(Table 1). The latter is an indication for the activity of different AE sources within the
encapsulating cementitious system associated with the observed failure of the structure.
From the analysis performed above and in [21] it is clear that the parameter-based
approach provides a good differentiation (in term of AE) of the mechanisms causing
damage in the cementitious samples due to the corrosion of the encapsulated Al. Although
the same AE sensor was firmly attached to the samples during the AE experiments and any
changes in the time domain parameters of the recorded signals was attributed to the
different sources and materials used it is important to consider the strong dependence of the
measured acoustic parameters on the experimental setup. For that purpose signal-based
approaches were applied using the recorded signal waveforms from the BFS/OPC sample
with encapsulated Al to provide a more independent from the experimental setup (sensor
coupling and positioning) results for analysis and conclusions. Conventional fast Fourier
transformation (FFT) and wavelet transformation (WT) were used to characterise the
processes associated with the Al corrosion and its impact on the mechanical performance of
the BFS/OPC structure.
4.2. Relationship between the frequency characteristics of the recorded AE hits and the
Signal-based AE analysis includes advanced mathematical transformations to
facilitate the identification of characteristic features of the recorded acoustic waves.
Conventional FFT [27] is typically applied to determine the frequency spectra of the
detected acoustic waves. The primary frequency, defined as the most energetic frequency
component in the Fourier spectrum, has been used to classify different failure modes in
concrete and composites [17,28,29]. However, the FFT is of a fixed resolution at all
frequencies and can obscure small, high frequency events which usually last for a very
short interval of time (a few tens of μs) [29,30]. These events can be characterised by WT.
WT is relatively new signal processing technique applied to AE signal waveforms in order
to obtain their frequency-time domain characteristics. Since AE is not a stationary process,
i.e., a number of wave modes are present with different frequencies, WT can be helpful to
characterise the processes generated AE in heterogeneous cement-based structures as those
used in this study.
Continuous WT (CWT) is defined as a set of basic functions obtained by
compression/dilation or shifting of a “mother wavelet”. CWT of a function f(t) in time t is
determined as [31]:
( )
a b f( )
t( )
t dtWf
∫
ab+∞ ∞ − = * , , ψ
ψ (1)
where
( )
⎟⎠ ⎞ ⎜ ⎝ ⎛ − = b a t b t b a ψ
The two terms, a and b, are known respectively as translation and scale parameters.
The translation a defines the shift of the time window through the signal. The scale b in WT
corresponds to the scale used in maps, i.e., high scale is used for low frequencies which
correspond to global information of the signal and low scale for the frequencies that can
provide more details for important mechanical events usually lasting for very short time
[17,29-31]. Different mother wavelet functions ψ
( )
t have been studied and applied foranalysis of complex signals such as AE transients. However, the Gabor analysing wavelet
was shown as suitable to differentiate failure modes in various materials [29,30]. Gabor
mother wavelet ψ
( )
t is given as [31]:( )
⎥ ⎥ ⎦ ⎤ ⎢ ⎢ ⎣ ⎡ + ⎟⎟ ⎠ ⎞ ⎜⎜ ⎝ ⎛ − ⎟⎟ ⎠ ⎞ ⎜⎜ ⎝ ⎛ = − t i tt p p ϖp
γ ϖ γ ϖ π ψ 2 2 2 / 1 4 / 1 2
exp (2)
where ϖp is the centre frequency and γ is a constant calculated as
.
(
2/ln2)
1/2 =5.336=π γ
The WT of the detected acoustic waves from the cementitious wasteform sample
with encapsulated Al was calculated and plotted with AGU-Vallen Wavelet freeware [32]
based on Gabor mother wavelet with key parameters being: maximum frequency 400 kHz,
frequency resolution 1 kHz and wavelet size of 600 samples. The results from WT were
performed in 3D plots where x-axis corresponds to the time, y-axis to the frequency and z
-axis to the calculated coefficients of ψ
( )
t for given values of a, b andϖp. For thebuild-in algorithm was used to limit the integration in the interval between 0 and ,
where N is the number of discrete points (3072 for this study),
t NΔ
t
Δ is the sampling interval
and limited range of values given for the shift a and the scale b [31].
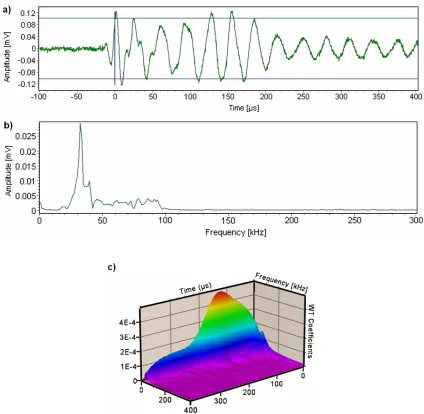
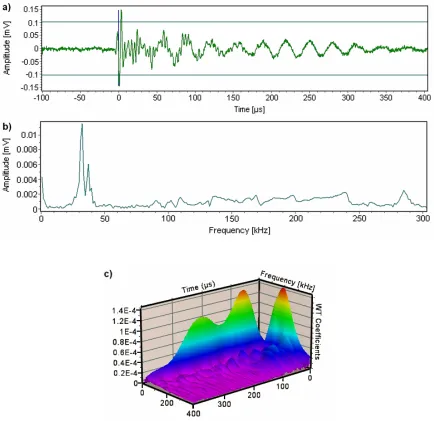
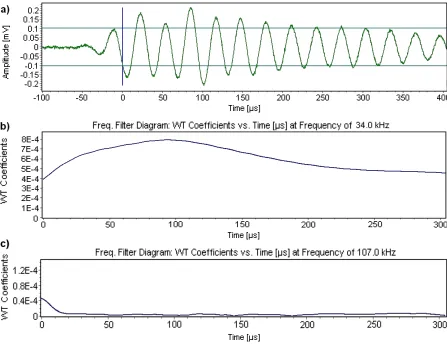
Fig. 5 illustrates typical acoustic signal waveform and its frequency spectrum and
3D plot of WT recorded from the BFS/OPC sample with encapsulated Al in a large
population (Table 1) during stage 1 from Fig. 2. This type of resonance-like signals with a
primary frequency at 34 kHz (Fig. 5b) shows that the low frequency components were
clearly transmitted by the sensor even though characterised by a relatively low sensitivity
for this range of frequencies. Therefore there was negligible effect of the sensor coupling or
ringing effect caused by the frequency response of the sensor on the recorded AE waves.
Moreover, from the plot in Fig. 5b it can be seen that this AE signal is also characterised by
intensity in the Fourier spectrum up to 100 kHz. The 3D plot of WT (Fig. 5c) shows that
these two main frequency components: below and above 40 kHz constituent the first 100 μs
of the signal waveform and can be directly related to the initial features of the AE sources
[33]. As stated by Grosse et al. [33] after a few oscillations the signals generated by the
sensor are dominated by side reflections or geometry, heterogeneity of the materials under
study, the intrinsic properties of the sensor such as resonant frequency and sensor coupling.
The presence of those frequency components in the Fourier spectrum of the signal
waveform from Fig. 5a is an indication for the complex nature of the AE originating from
the Al corrosion process associated with accumulation of corrosion products and hydrogen
gas generation and release causing cracking of the encapsulating cementitious structure.
Similar separation of the frequency components as dominant low (below 40 kHz)
signal waveform recorded during period 2a from stage 2 (Fig. 2) as shown in Fig. 6b. Again
these frequency modes arrived within the first 100 µs of the duration of the AE hit (Fig.
6c). Therefore similar processes as those identified during stage 1 could be responsible for
the generation of these acoustic waves suggested to be localised microcracking and
debonding between the Al rod and the corrosion products layer.
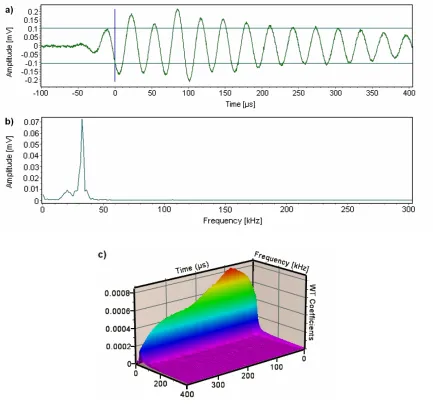
For the most energetic AE hits recorded during the periods denoted as 2a and 2b in
Fig. 2 the frequency spectrum was dominated by the low frequency component at 34 kHz
(Fig. 7b). Visible cracks formation and/or extension within the cement structures along with
hydrogen gas evolution could be associated with the generation and release of this type of
acoustic waves.
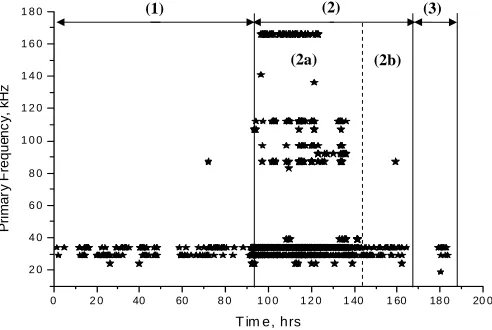
According to their primary frequency all detected AE hits from the BFS/OPC
sample with encapsulated Al throughout the duration of the experiment were clustered for
frequencies below 40 kHz, between 90 and 110 kHz and around 170 kHz as shown in Fig.
8. Similar results were obtained for the primary frequency of the AE hits detected from the
OPC sample with encapsulated Al [23].
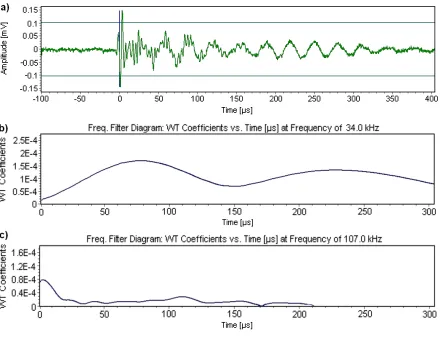
The WT analysis can be also used to provide information on the time of occurrence
and the duration of the low and high frequency components found in acoustic signal
waveforms [29]. 2D plots of WT at frequencies of 34 kHz and 107 kHz are illustrated in
Figs 9 and 10 for the AE hits detected from the BFS/OPC sample with encapsulated Al
respectively during period 2a and 2b of stage 2 from Fig. 2.
The dominant low frequency component at 34 kHz, as shown in Figs 9b and 10b,
lasted during the first 100 μs whereas the selected high frequency wave mode at 107 kHz
component arrived first; hence this very short event from the AE hit can be associated with
microcracks formation and propagation. The AE sources characterised by the dominant low
frequency component of the signal waveforms can be related to the macro scale damage
development within the structure due to the formation and/or propagation of visible cracks
and hydrogen gas evolution.
5. Discussion
A large number of 2328 AE hits were recorded from the BFS/OPC sample with
encapsulated Al for 183.5 hours of monitoring separated into clearly defined periods with
very low or almost none activity followed by an abrupt jump in the AE hits number. This
behaviour of the sample, in term of AE, resembled the response of studied cement-based
structures under loading associated with micro and macro scale damage development
[14-20]. Moreover, the interval of AE “silence” following the period of a high AE activity in
the history of the conducted experiment (stage 2 from Fig. 2) showed Kaiser effect
observed in cement-based materials during loading-unloading cycles [18].
The applied conventional AE parameter-based analysis, following the procedure
from Wu et al. [20], allowed to classify the AE hits according to their duration, amplitude
and counts number. The results obtained provided the first point to conclude the complex
nature (in term of AE) and activity of a large number of processes (sources) later confirmed
by visual and microscopy observations.
According to their parameters the AE hits recorded from the BFS/OPC sample with
[20,21], can be generally divided in two main groups. The first group consists of a large
number of signals with a duration up to 80 μs and an amplitude up to 46 dB associated with
microcracks initiation and propagation. Moreover, the second smaller group of signals,
with an amplitude up to 55 dB and a duration more than 80 μs, were associated with critical
size crack(s) formation and/or extension and hydrogen gas release within the cementitious
structure with encapsulated Al. The results from the FFT and WT analysis revealed that the
AE events detected from the BFS/OPC structures with encapsulated Al consist of two main
frequency components: low (primary frequency at 34 kHz) and high (above 40 kHz).
Therefore it can be suggested that two mechanisms of AE co-exist together associated with
microcracks formation and localization in a fracture process zone ultimately leading to
visible cracks initiation and propagation. Very similar results were obtained from the AE
data analysis performed on a reference OPC sample with encapsulated Al as reported in
[21-23].
It is worth noting that under very similar experimental conditions, preparation and
age of curing the AE hits recorded were significantly less for the BFS/OPC sample in
comparison with that for the OPC system [21]. The latter is in a good agreement with the
reported by Setiadi [6,7] lower rate of Al corrosion in composite cements than in the pure
OPC. However, the basic parameters and frequency characteristics of the AE signals did
not reveal any important differences; thus the sources and the propagation properties of the
structures (in term of AE) are similar under the established experimental conditions.
Additional evidence for the decreased rate of the Al corrosion and therefore the less
damage developed within the BFS/OPC sample prior to the conducted test is also the
BFS/OPC sample to be 41.1 AE hits/hour whereas for the OPC structure during the similar
period of a high AE activity it was reported to be 335 AE hits/hour [21].
6. Conclusions
The AE technique and methods for analysis of the collected data were shown
feasible for monitoring and assessment of the mechanical performance of cementitious
structures with encapsulated metallic wastes such as Al. The methodology of analysis was
based on AE processing accounting for hits rate, signal parameters and frequency
characteristics along with visual and microscopy observations which enabled identification
of major AE sources in the simulant cementitious wasteforms. Distributed and localised
microcracking, hydrogen gas evolution and visible cracks formation and extension within
the cementitious matrix can be differentiated by their AE response in term of signals
duration, amplitude and frequency components. Despite of some differences found in the
AE hits rate and their time distribution detected from the BFS/OPC sample with
encapsulated Al in comparison with those from the reference OPC structure under identical
experimental conditions, the AE signals detected have been successfully classified based on
similar parameters and frequency characteristics. To evaluate the feasibility of the method
for industrial use an optimization of the experimental setup will be required as well as
additional research to assess the importance of various parameters such as sensor frequency
characteristics, positioning and coupling, background noise, waste type and loading,
Acknowledgements
This work was possible with the financial support of EPSRC and Nexia Solution Ltd.
Authors are grateful for the practical advises throughout this work to M. Hayes from
AMEC, C.R. Scales and H. Godfrey from Nexia Solutions Ltd. We also are grateful for the
detailed comments of the reviewers of the paper.
References
[1] M.I. Ojovan, W.E. Lee, An introduction to nuclear waste immobilisation, Elsevier,
Amsterdam, 2005.
[2] The 2004 United Kingdom Radioactive Waste Inventory: Main Report.
DEFRA/RAS/05.002, Nirex Report N/090, October 2005.
[3] R. Streatfield, A review and update of the BNFL cement formulation development
programme for the immobilisation of intermediate level wastes from Magnox power
stations, In Proceedings of Waste Management Conference, 2001, Tucson, AZ, Paper
52-02.
[4] J.H. Sharp, J. Hill, N.B. Milestone, E.W. Miller, Cementitious systems for
encapsulation of intermediate level waste, In Proceedings of the Ninth International
Conference on Radioactive Waste Management and Environmental Remediation, Oxford,
[5] WSP/100: Introduction to the Nirex Waste Package Specification and Guidance
Documentation, Nirex Ltd. Waste Package Specification and Guidance Documentation
481350, July 2005.
[6] A. Setiadi, N.B. Milestone, J. Hill, M. Hayes, Corrosion of aluminium and magnesium
in BFS composite cements, Adv. Appl. Ceram., 105(4) (2006) 191-196.
[7] A. Setiadi, Corrosion of metals in composite cements, PhD thesis, University of
Sheffield, UK, 2006.
[8] P. Filippi, D. Habault, J.P. Lefebvre, A. Bergassoh, Acoustics - Basic physics, theory
and methods, Academic Press, London, 1999.
[9] A.A. Pollock, Acoustic emission inspection, Technical Report TR-103-96-12/98.
Physical Acoustics Corporation, 1989.
[10] K. Ono, Current understanding of mechanisms of acoustic emission, J. Strain Anal.,
40(1) (2005) Special Issue Paper N1.
[11] M. Ohtsu, K. Ono, AE source location and orientation determination of tensile cracks
from surface observation, NDT Int., 21(3) (1988) 143-150.
[12] C.U. Grosse, F. Finck, Quantitative evaluation of fracture processes in concrete using
signal-based acoustic emission technique, Cem. Concr. Compos., 28 (2006) 330-336.
[13] K. Ono, AE methodology for the evaluation of structural integrity, Adv. Meter. Res.,
13-14 (2006) 17-22.
[14] E. Landis, Micro-macro fracture relationships and acoustic emission in concrete,
[15] H. Idrissi, A. Limam, Study and characterization by acoustic emission and
electrochemical measurements of concrete deterioration caused by reinforcement steel
corrosion, NDT&E Int., 36 (2003) 563-569.
[16] B. Assouli, F. Simescu, G. Debicki, H. Idrissi, Detection and identification of concrete
cracking during corrosion of reinforced concrete by acoustic emission coupled to the
electrochemical techniques, NDT&E Int., 38 (2005) 682-689.
[17] D.J. Yoon, W.J. Weiss, S.P. Shah, Assessing damage in corroded reinforced concrete
using acoustic emission, J. Eng. Mech., 126(3) (2003) 273-283.
[18] T. Tam, C.C. Weng, A study on acoustic emission characteristics of fly ash cement
mortar under compression, Cem. Concr. Res., 24(7) (1994) 1335-1346.
[19] J.K. Lee, J.H. Lee, Nondestructive evaluation on damage of carbon fiber sheet
reinforced concrete, Com. Struct., 58 (2002)139-147.
[20] K. Wu, B. Chen, W. Yao, Study of the AE characteristics of fracture process of
mortar, concrete and steel-fiber-reinforced concrete beams, Cem. Concr. Res., 30 (2000)
1495-1500.
[21] L.M. Spasova, M.I. Ojovan, Acoustic emission detection of microcrack formation and
development in cementitious wasteforms with immobilised Al, J. Hazard. Mater., 138(3)
(2006) 423-432.
[22] L.M. Spasova, M.I. Ojovan, C.R. Scales, Acoustic Emission monitoring of aluminium
corrosion in cemented-based wasteforms, Adv. Mater. Res., 13-14 (2006) 223-229.
[23] L.M. Spasova, M.I. Ojovan, Frequency characteristics of acoustic emission signals
from cementitious wasteforms with encapsulated Al, Mat. Res. Soc. Symp. Proc., 985
[24] V.Z. Belov, A.S. Aloy, Using acoustic emission in quality control of class and
ceramics for radioactive waste immobilisation, Mat. Res. Soc. Symp. Proc., 807 (2004)
163-168.
[25] The set threshold level of 40 dB was considered as a high enough to eliminate the
influence of the background noise and at the same time sufficiently low to collect signals
associated to the mechanical performance of the monitored structure. This was concluded
based on conducted pre-test continuous monitoring on the acoustic characteristics of the
background noise and other cementitious samples with encapsulated Al.
[26] M. Fregonese, H. Idrissi, H. Mazille, L. Renaud, Y. Cetre, Initiation and propagation
steps in pitting corrosion of austenitic stainless steels: monitoring by acoustic emission,
Corros. Sci., 43 (2001) 627-641.
[27] C.D. McGillem, G.R. Cooper, Continuous and discrete signal and system analysis,
CBS College Publishing, 1984, pp. 174-180.
[28] C.R. Ramirez-Jimenez, N. Papadakis, N. Reynolds, T.H. Gan, P. Purnell, M. Pharaoh,
Identification of failure modes in glass/polypropylene composites by means of the primary
frequency content of the acoustic emission event, Compos. Sci. Tech., 64 (2004)
1819-1827.
[29] Q. Ni, M. Iwamoto, Wavelet transformation of acoustic emission signals in failure of
model composites, Eng. Fract. Mech., 69 (2002) 717-728.
[30] G. Qi, Wavelet-based AE characterization of composite materials, NDT&E Int., 33
[31] H. Suzuki, T. Kinjo, Y. Hayashi, M. Takemoto, K. Ono, Appendix ed. by Y. Hayashi,
Wavelet Transform of Acoustic Emission Signals, J. Acoustic Emission, 14(2) (1996)
69-84.
[32] J. Vallen, Wavelet software version R2005.1121, Vallen-Systeme GmbH, Münich,
Germany. Available online at: http://www.vallen.de/wavelet/index.html.
[33] C. Grosse, H. Reinhardt, F. Finck, Signal-based acoustic emission techniques in civil
Figures
Fig. 1. AE experimental setup used for monitoring of the BFS/OPC sample with
Fig. 2. Cumulative number of AE hits and associated ABS energy detected during the AE
monitoring of the BFS/OPC samples with encapsulated Al.
0 20 40 60 80 100 120 140 160 180 200
Time, hrs 0 100000 200000 300000 400000 500000 600000
(1) (2) (3)
a) b)
Visible cracks formed during the conducted AE monitoring
Al Al
[image:28.612.104.497.97.263.2]Layer of corrosion products
Fig. 3. Visible cracks formed at the (a) surface and (b) cross-section of the BFS/OPC
a)
Microcrack
Al
Microcrack
[image:29.612.86.548.89.262.2]b)
Fig. 4. Micrographs showing (a) splitting crack between the Al rod and corrosion products
layer and (b) microcracks within the corrosion products layer found in the BFS/OPC
Fig. 5. (a) Typical AE signal waveform, (b) its power spectrum by FFT, and (c) 3D plot of
[image:30.612.92.516.87.501.2]Fig. 6. (a) Typical AE signal waveform, (b) its power spectrum by FFT, and (c) 3D plot of
[image:31.612.87.521.85.506.2]Fig. 7. (a) Typical AE signal waveform, (b) its power spectrum by FFT, and (c) 3D plot of
[image:32.612.91.524.85.493.2]0 2 0 40 60 8 0 1 0 0 1 2 0 1 40 1 60 18 0 20 0 2 0
4 0 6 0 8 0 1 0 0 1 2 0 1 4 0 1 6 0 1 8 0
Pr
im
a
ry F
re
q
u
e
n
c
y
,
kH
z
T im e, hrs
(1) (2) (3)
[image:33.612.112.358.111.276.2](2a) (2b)
Fig. 8.Primary frequency of the AE signals detected from the BFS/OPC sample with
Fig. 9. (a) Typical AE signal waveform and its 2D plots of WT at frequencies of (b) 34 kHz
and (c) 107 kHz recorded from the BFS/OPC sample with encapsulated Al during period 2a
[image:34.612.88.528.84.430.2]Fig. 10. (a) Typical AE signal waveform (a) and its 2D plots of WT respectively at
frequencies of (b) 34 kHz and (c) 107 kHz of recorded from the BFS/OPC sample with
[image:35.612.87.534.85.430.2]Table 1. Time domain parameters of the hits recorded during the AE monitoring of the BFS/OPC sample with encapsulated Al
Time Period Hits Duration, [µs] Amplitude Peak, [dB] Amplitude Range, [dB] Max of Counts/Hits Calculated Average Counts/Hits
Nhits Ncounts
% of Total
Nhits
Total
EABS,
[aJ]
EABS,av,
[aJ]
0 - 50 41 40 - 42 1 1.25 92 115 3.95 4120 35.82 51 - 200 43 40 - 48 4 3.92 88 345 3.78 11100 32.17 0 – 92 h
(1) 201 - 1993 * Not
determined 42 - 54 *10 *19.3 13 251 0.56 68700 5284.6
Total 193 711 8.29 83920 5353.59
0 - 20 41 40 - 46 1 1.14 740 841 31.79 28200 38.1 21 - 80 42 40 - 46 2 2.07 590 1222 25.34 40900 69.32 81 - 1000 43 40 - 55 4 4.76 634 3018 27.23 124000 195.98 92 – 142 h
(Period 2a of Stage 2)
1001 - 10136 determined *Not 40 - 64 determined *Not *91.55 92 8423 3.95 224000 2434.7
Total 2056 13504 88.31 417100 2738.1 0 - 20 41 40 - 45 1 1.13 22 25 0.95 917 41.68 142 – 168 h
(Period 2b of
Stage 2) 21 - 601 43 41 - 53 3 *5.6 43 241 1.84 24300 565.11
Total 65 266 2.79 25217 606.79
0 - 20 40 40 - 42 1 1 8 8 0.34 235 29.37 168 – 183.5 h
(3) 21 - 100 42 42 - 44 2 1.83 6 11 0.25 378 63
Total 14 19 0.59 613 92.37